Admiral Markets
AdmiralMarkets.com Representative
- Messages
- 95
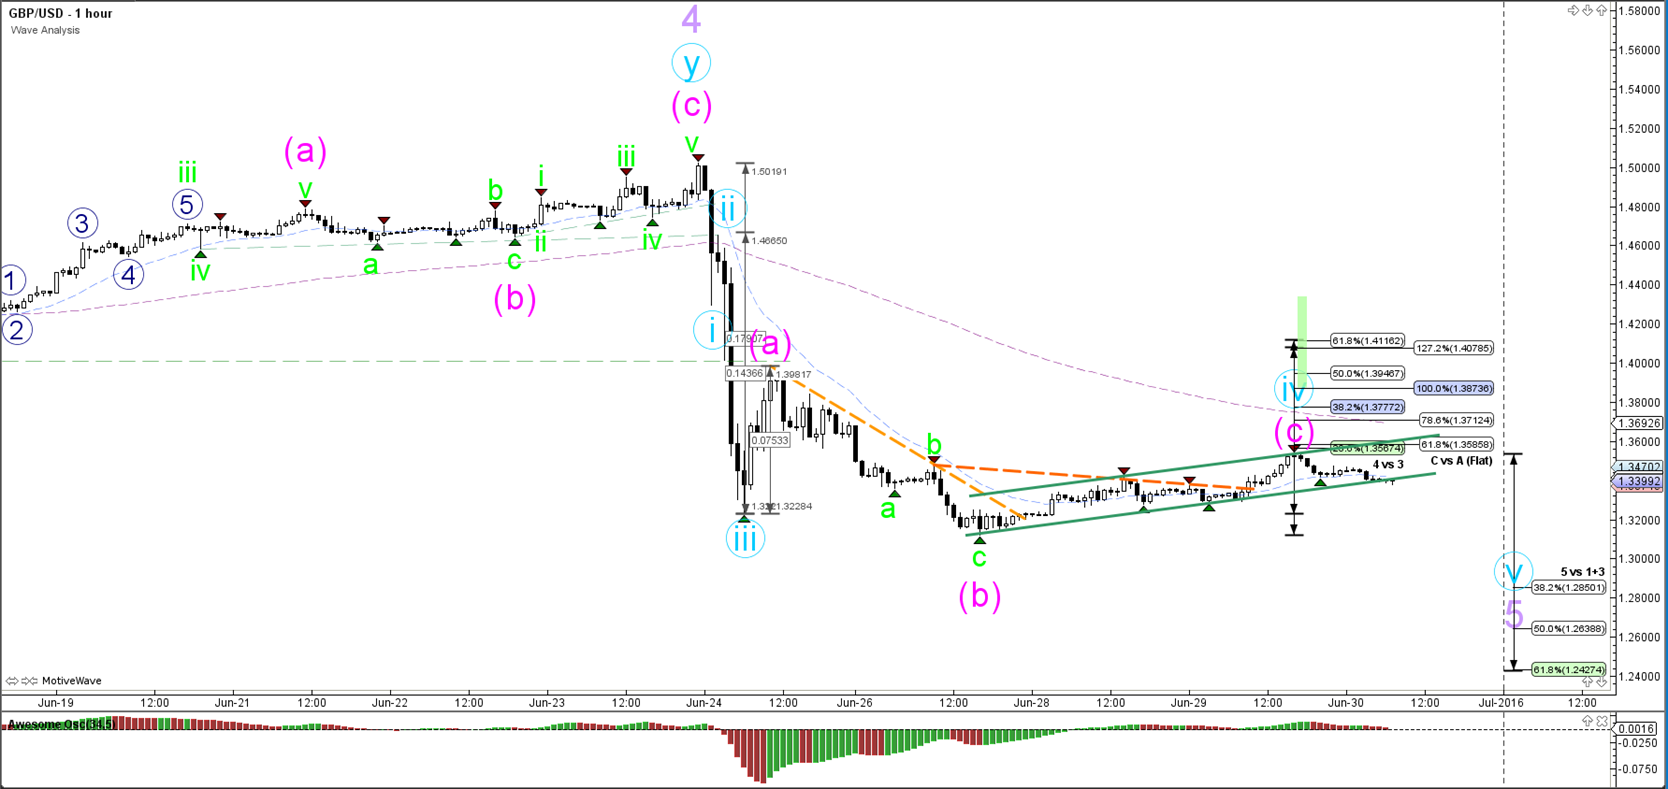
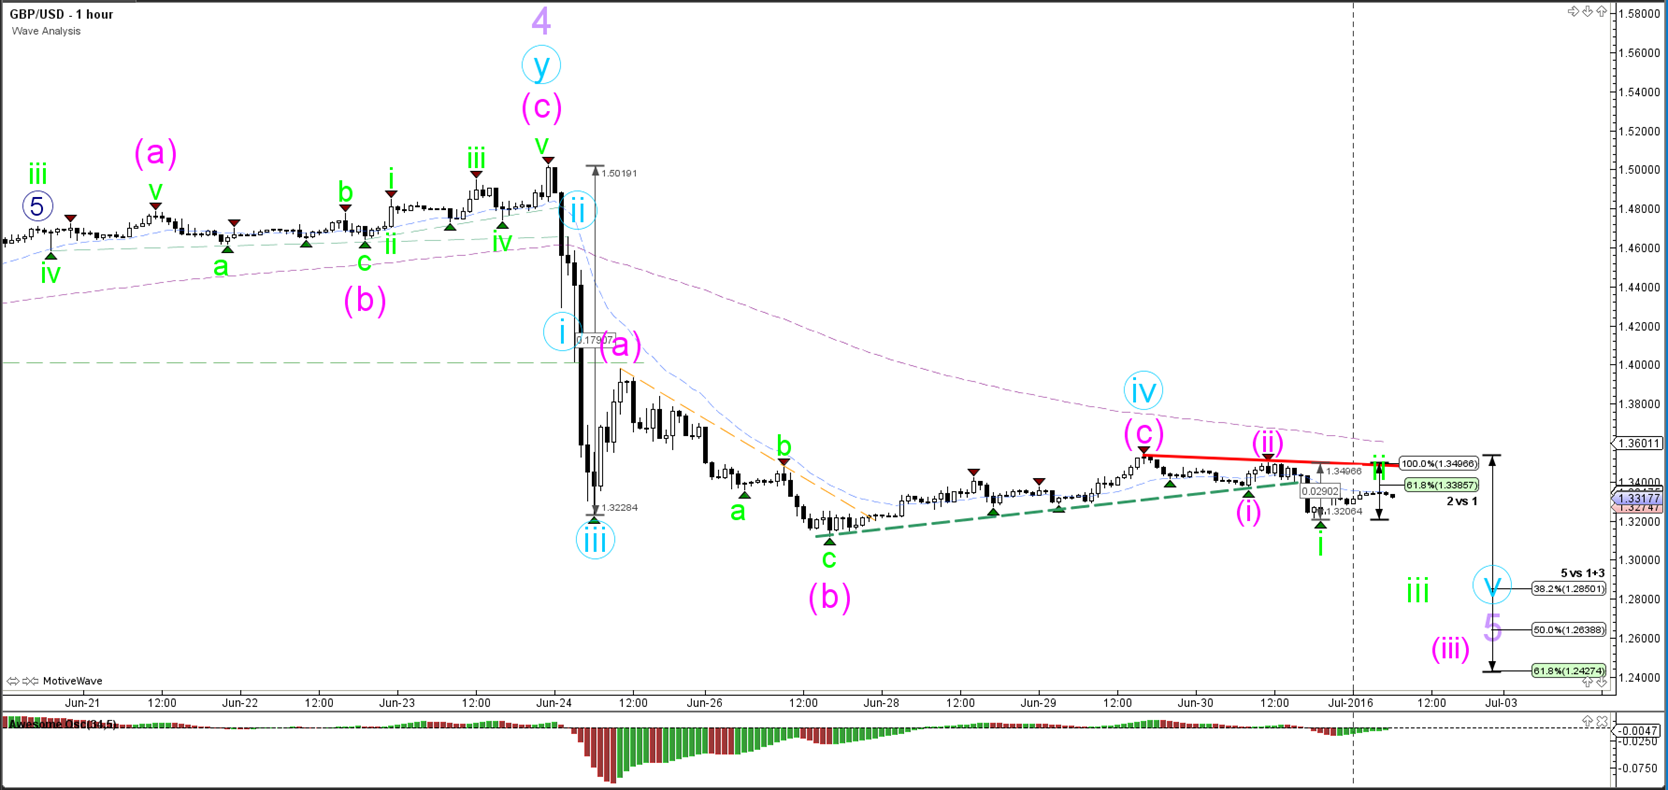
Further GBP weakness expected by Fibs and wave structure
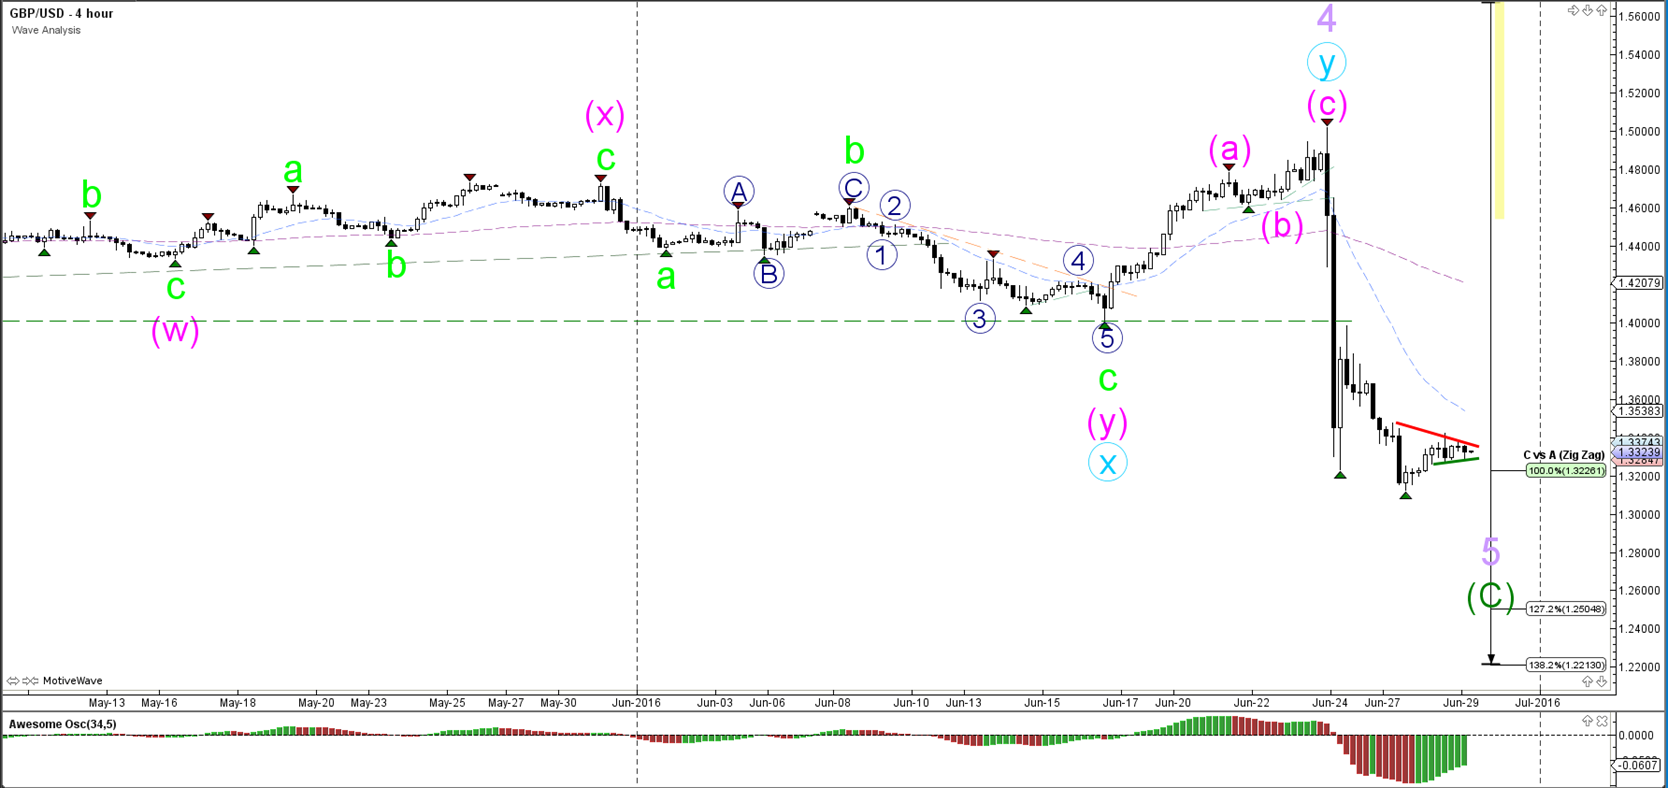
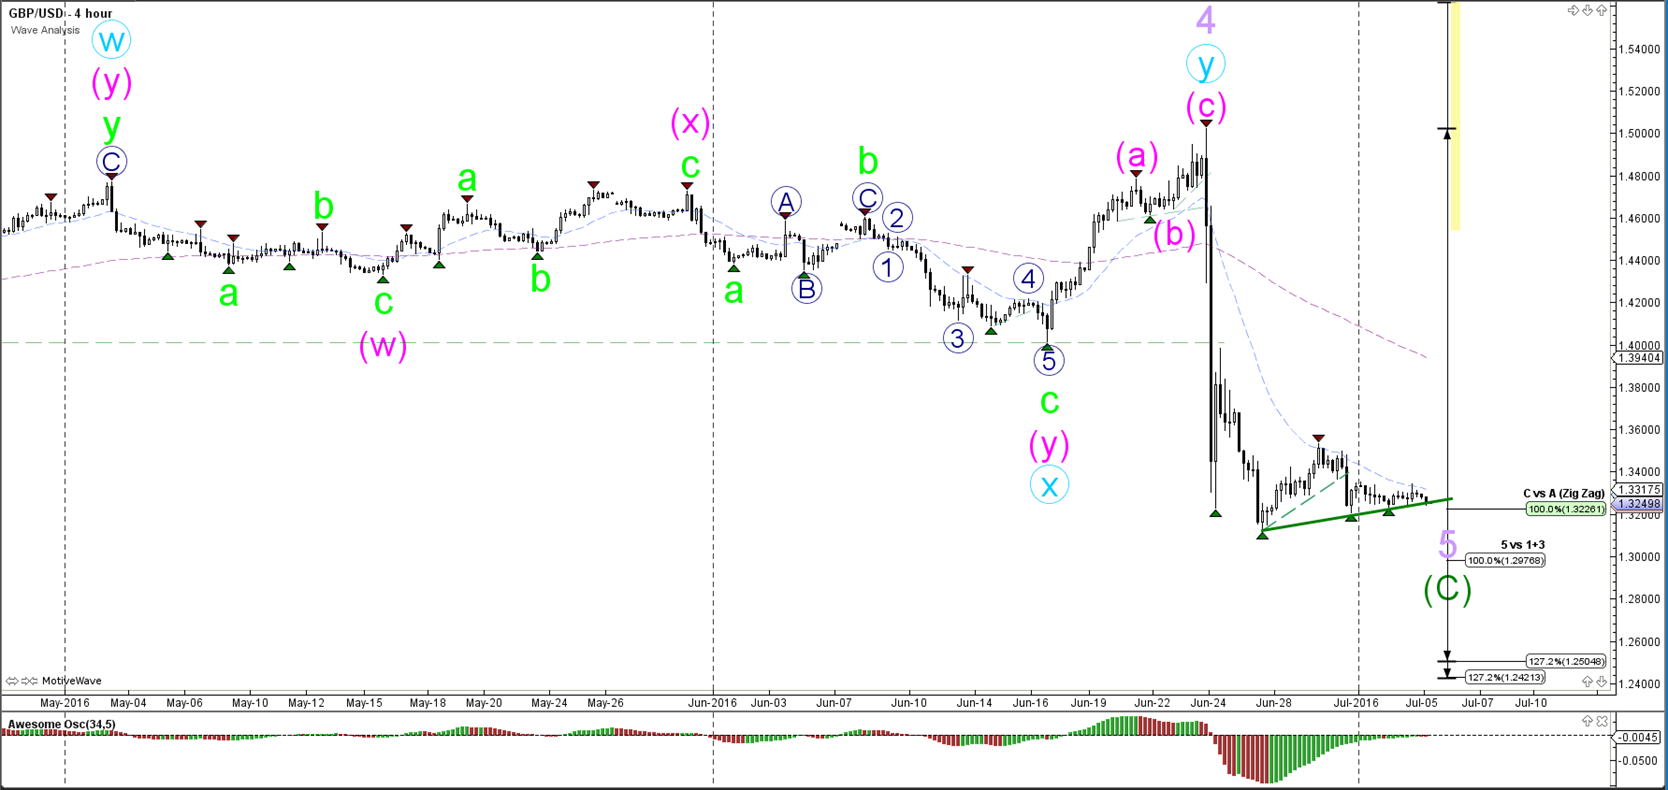
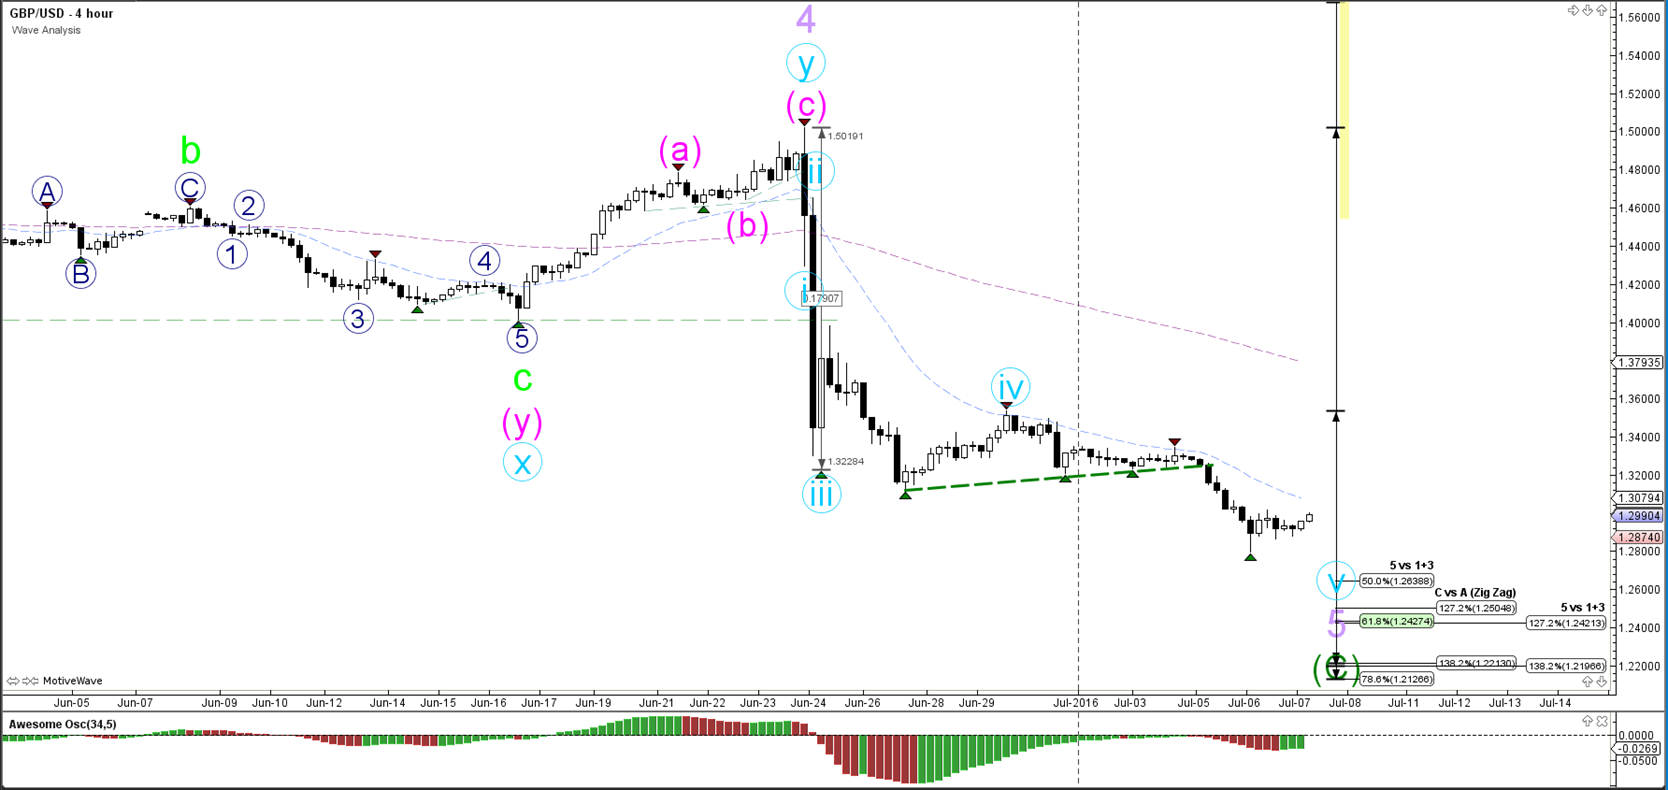
GBP/USD
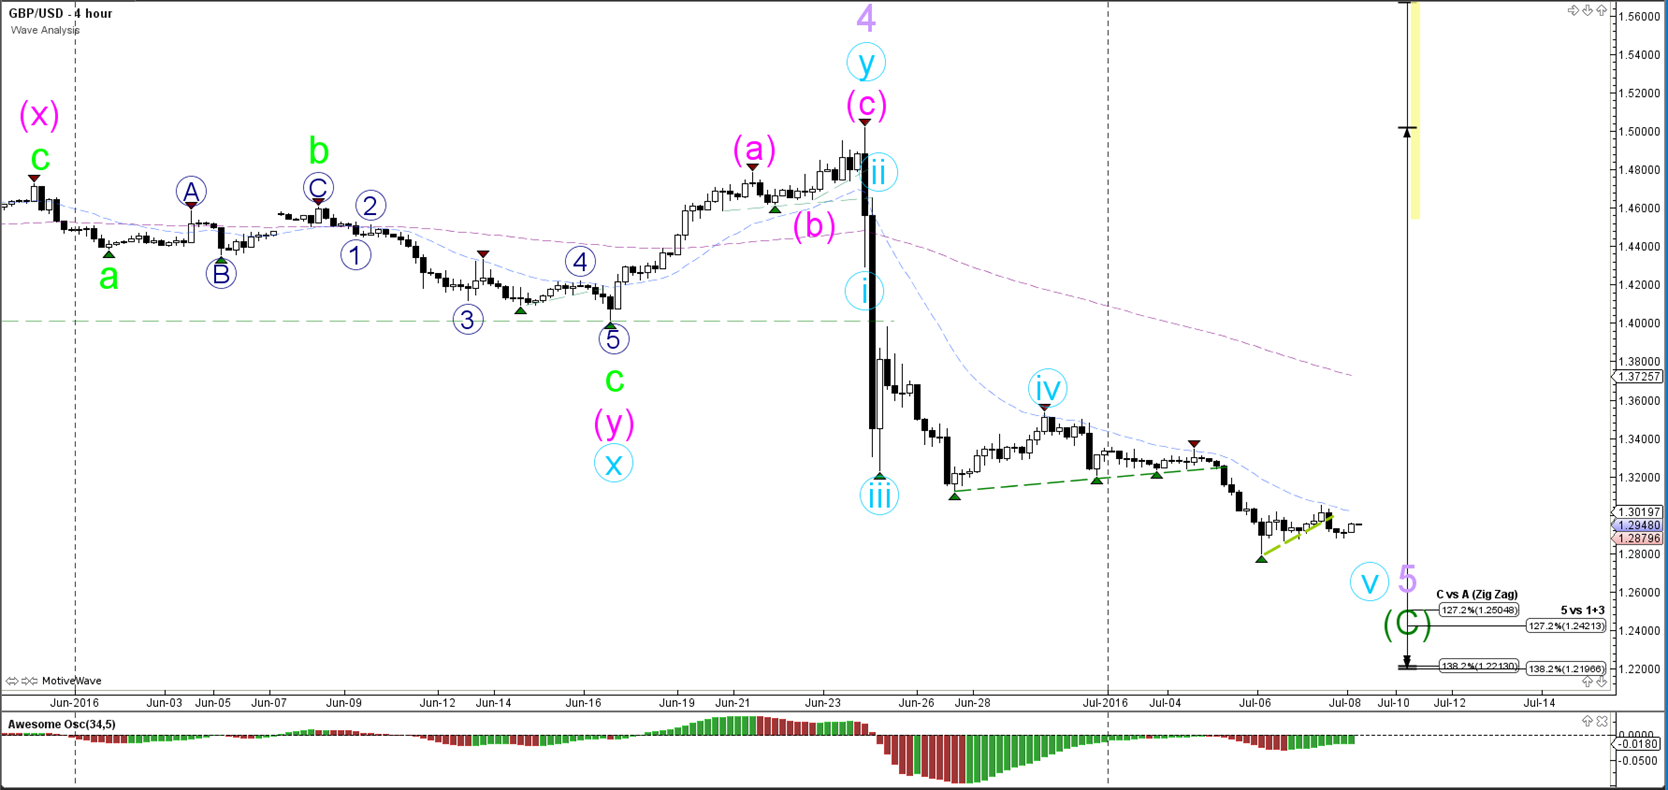
4 hour

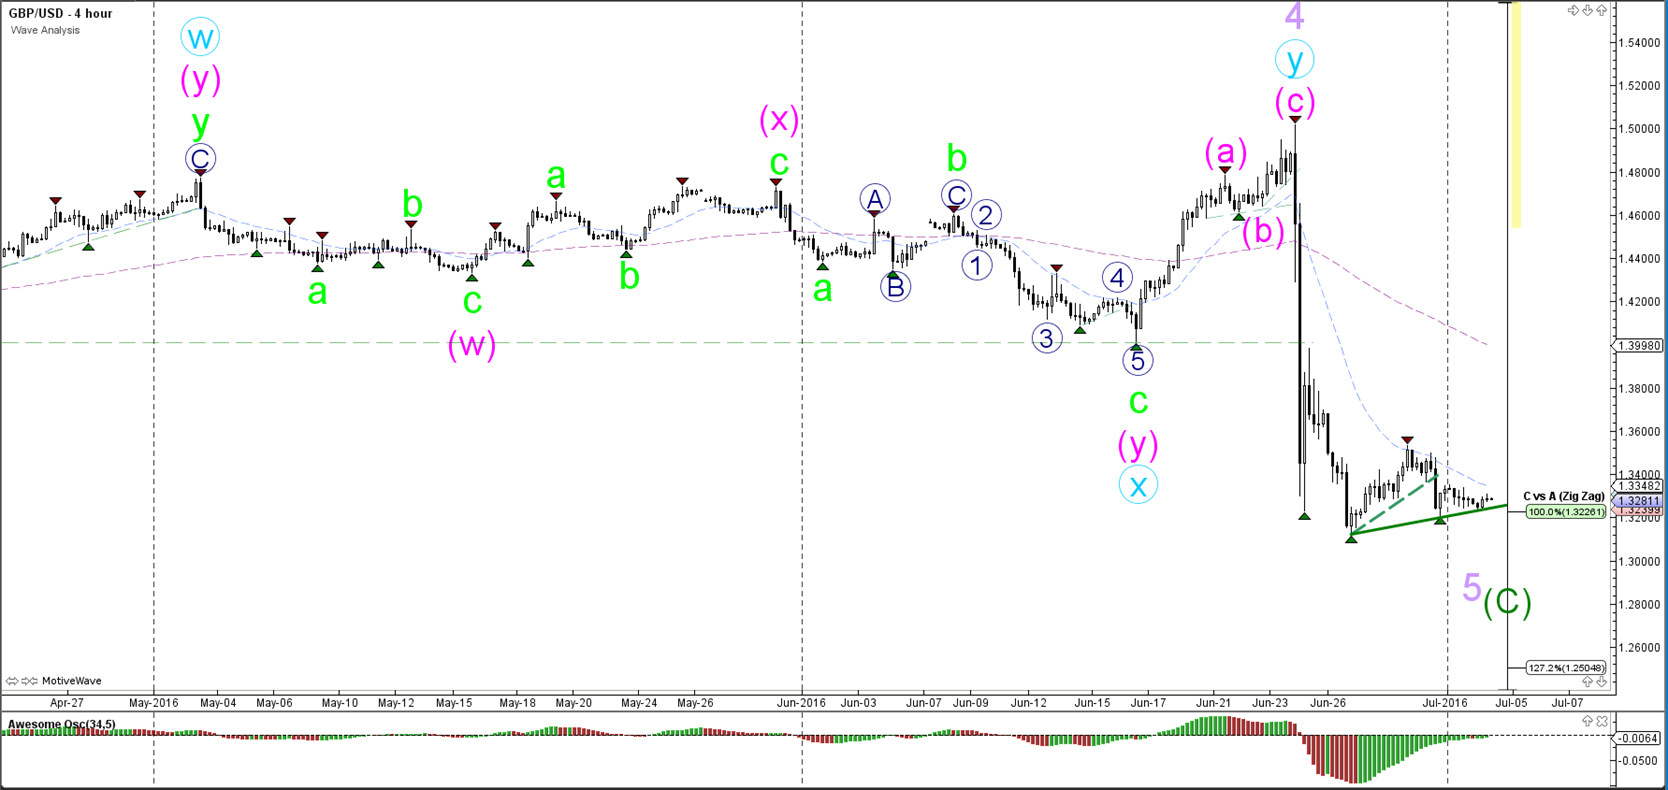
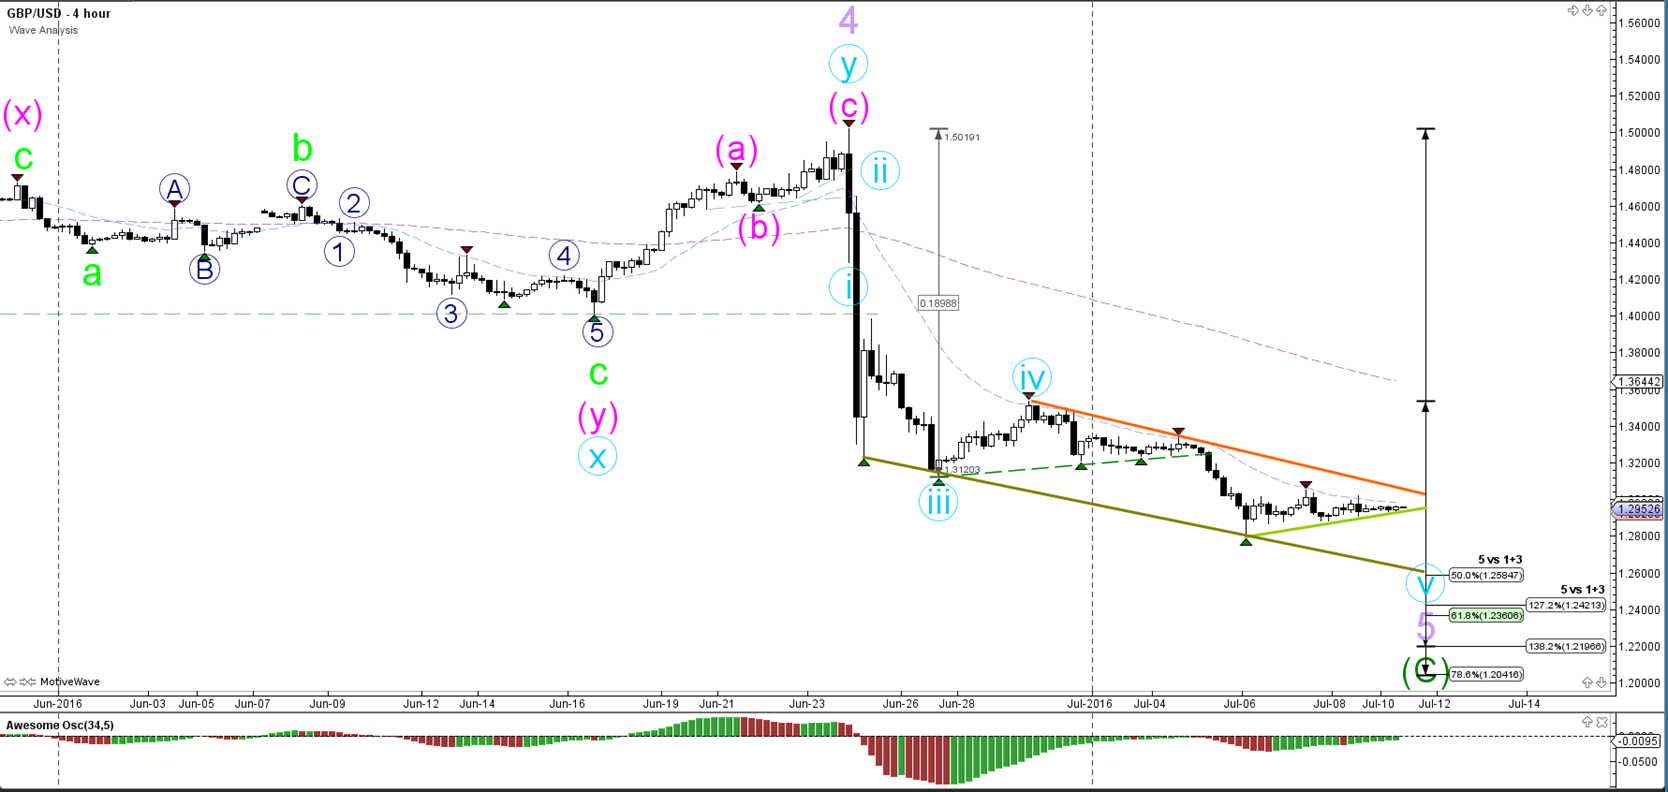
The GBP/USD took a strong hit and made a nose dive from 1.50 to 1.32 when the Brexit results were released. The first target of the wave C (green) has been hit and reached but further bearish pressure could mean an extension to the next Fibonacci 127.2% target at 1.25.
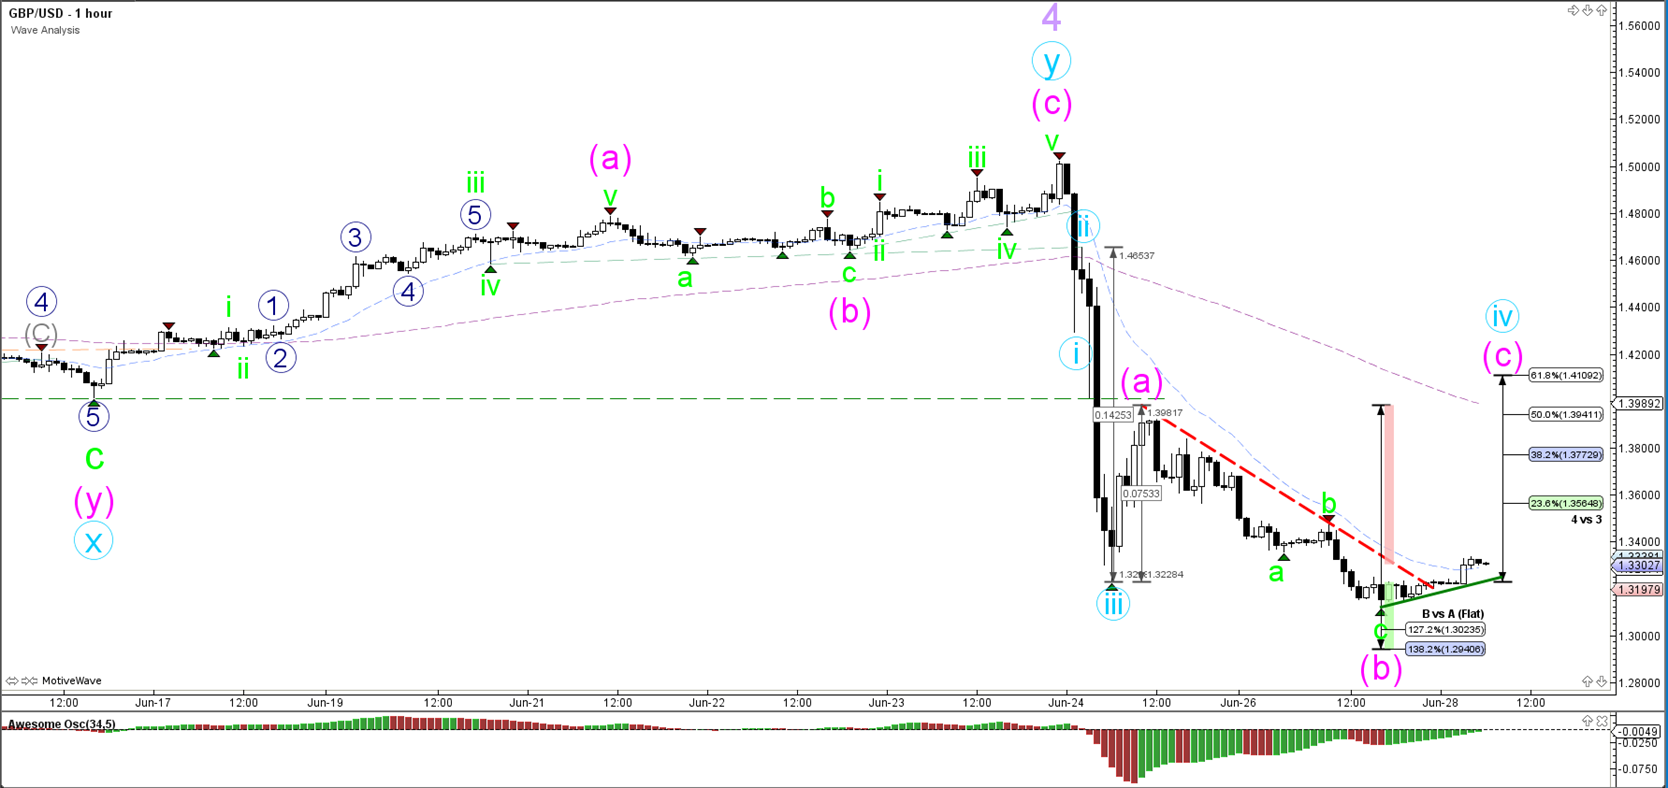
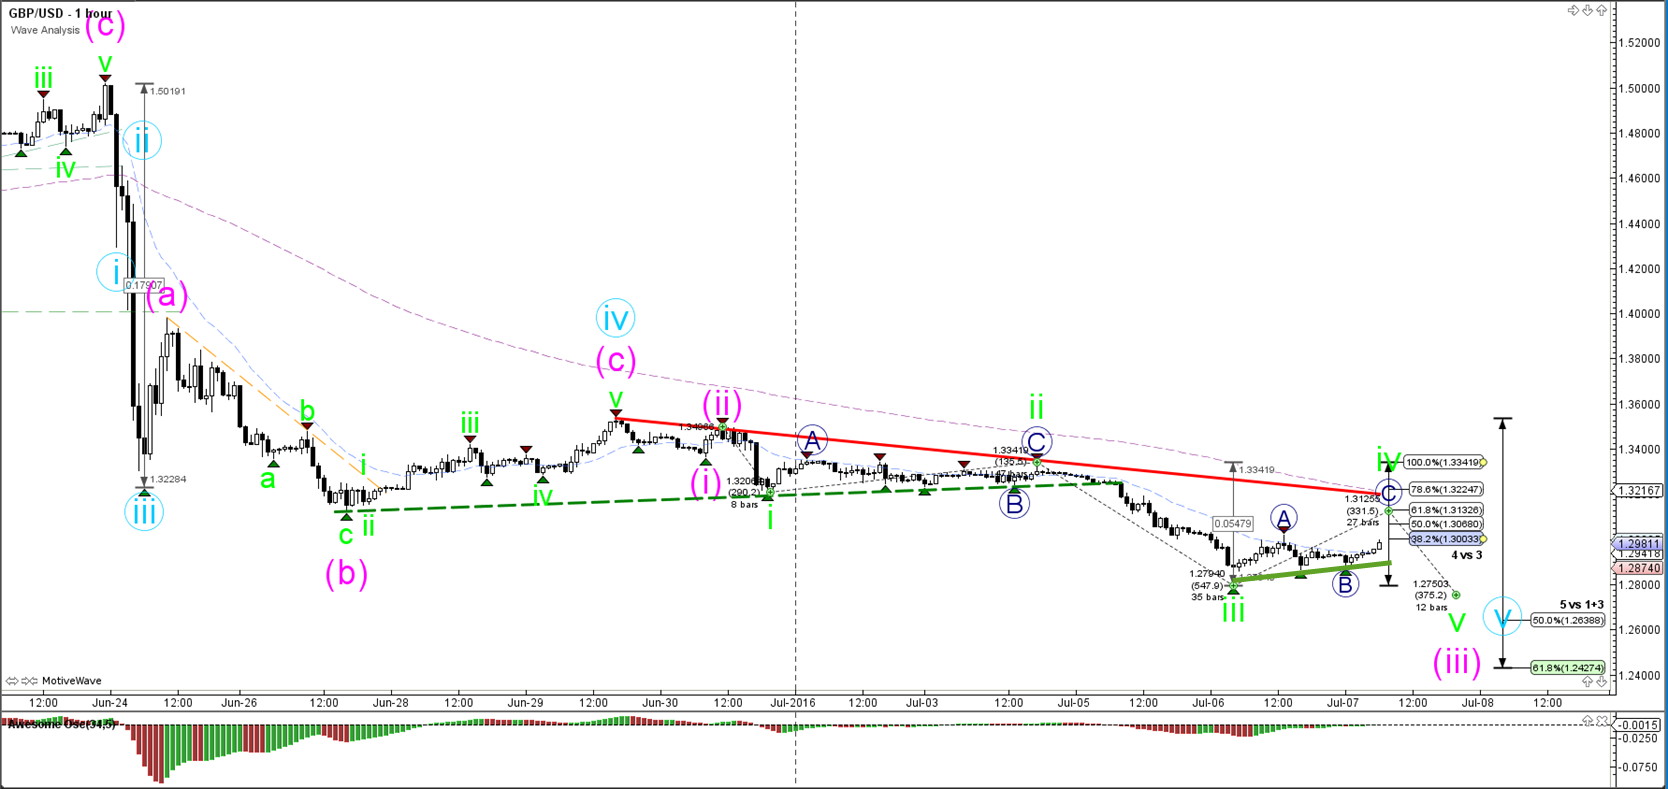
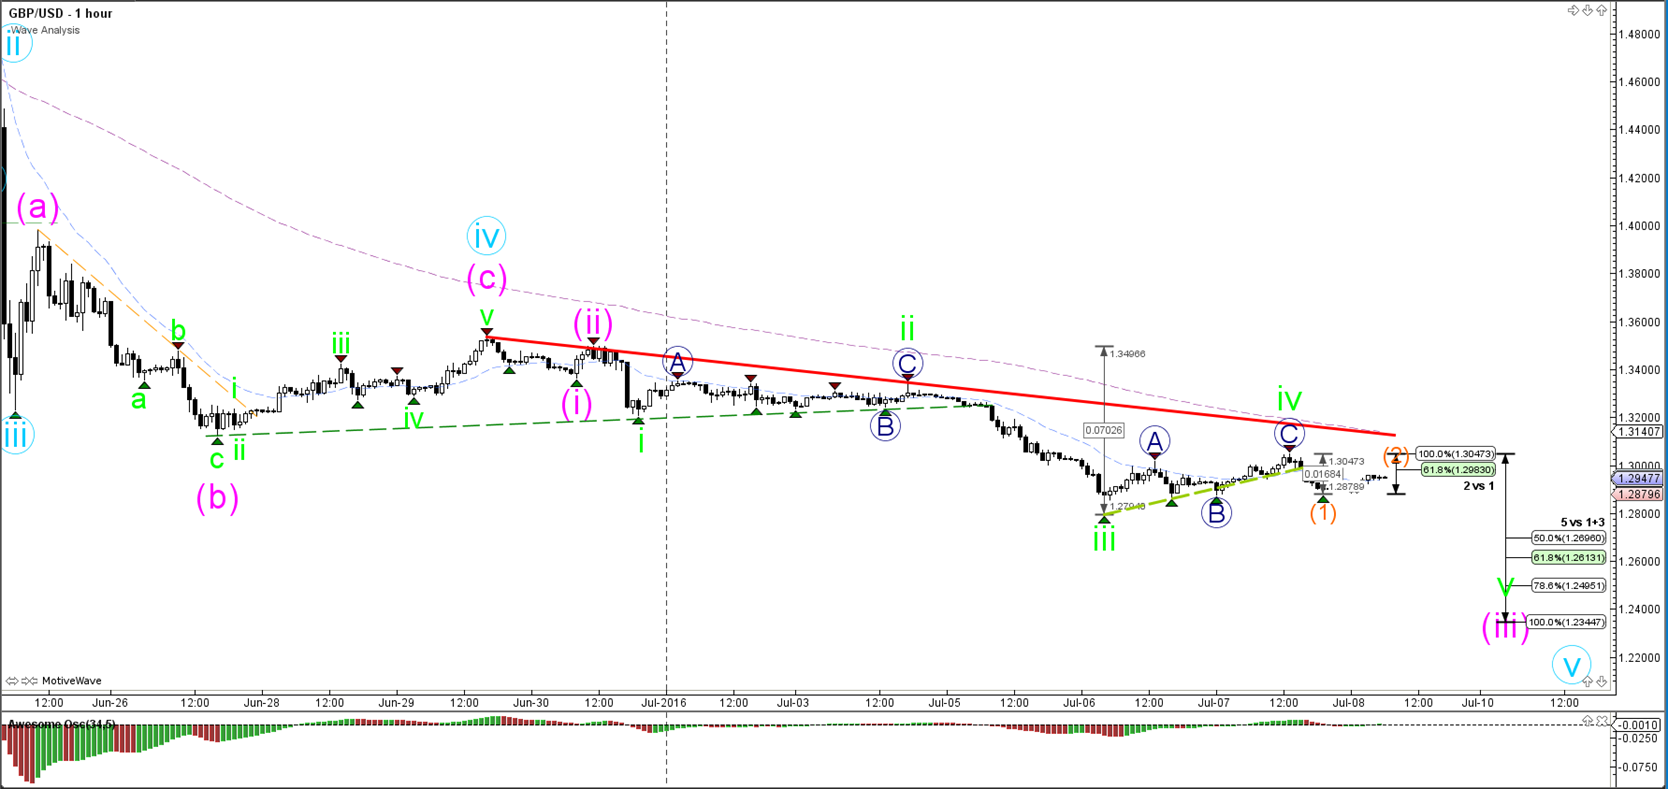
1 hour

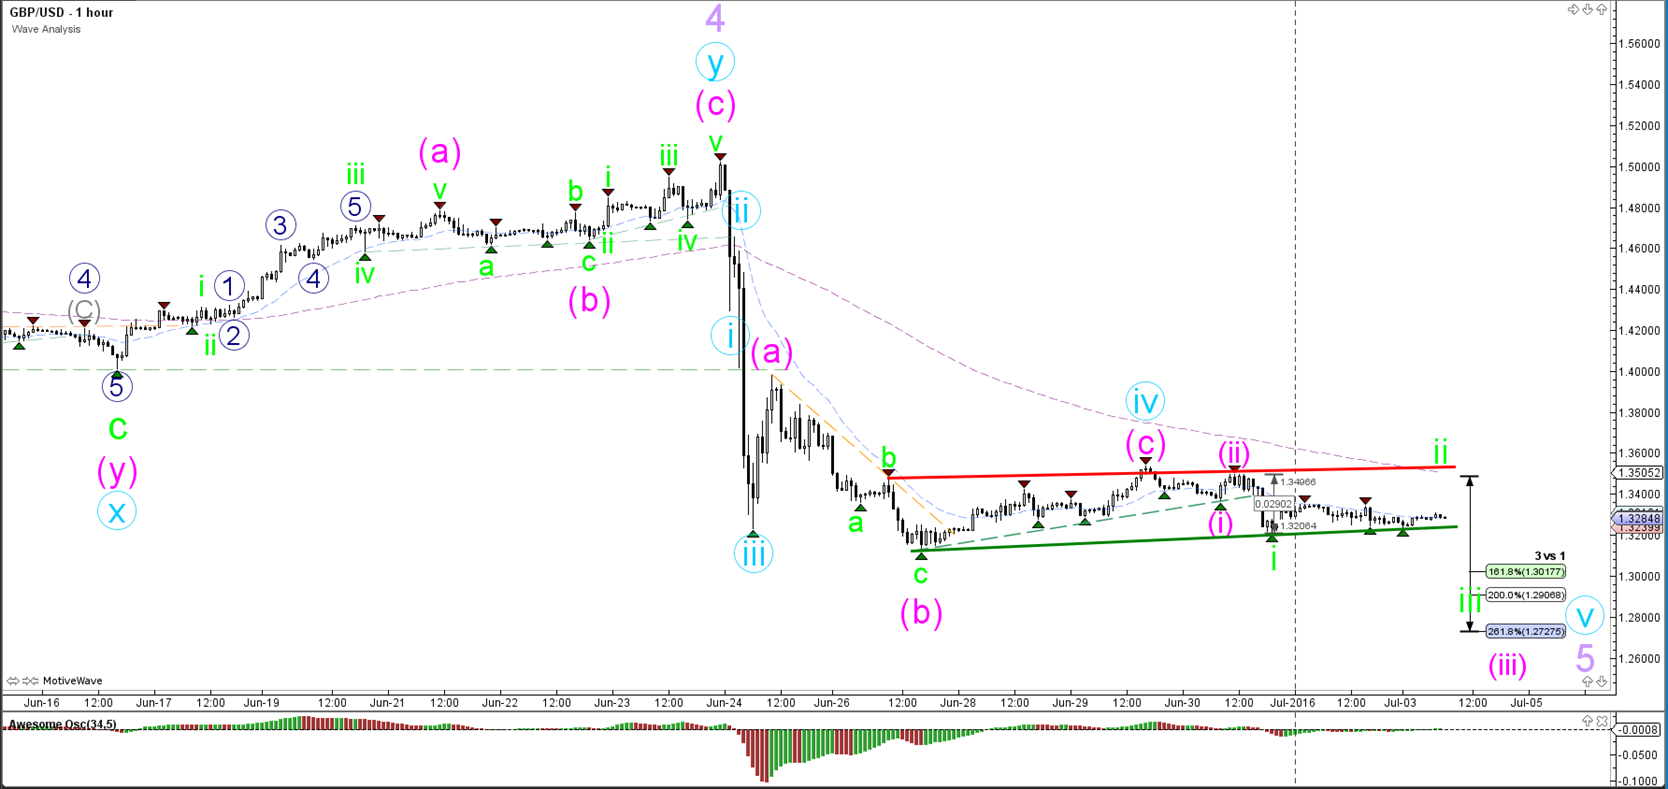
The GBP/USD seems to building a 5 wave structure (blue) within the wave 5 of the 4 hour chart. Wave 4 (blue) respected the 50% Fibonacci level. A push above the 78.6% invalidates the wave 4. A break below the support trend line (green) could start the wave 5 (blue). A larger wave 4 consolidation where price goes sideways is also possible.
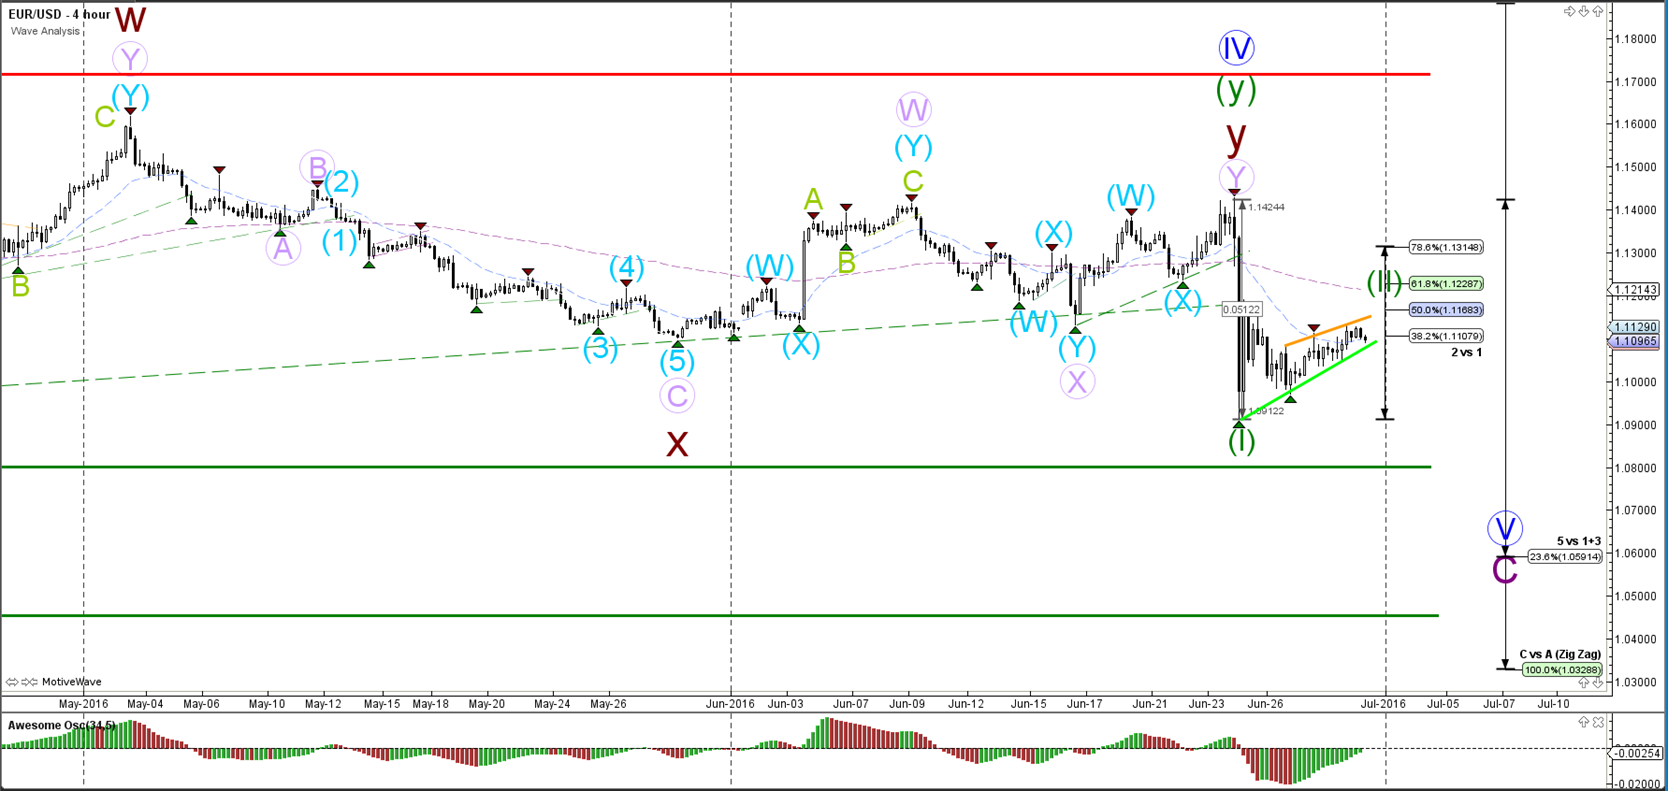
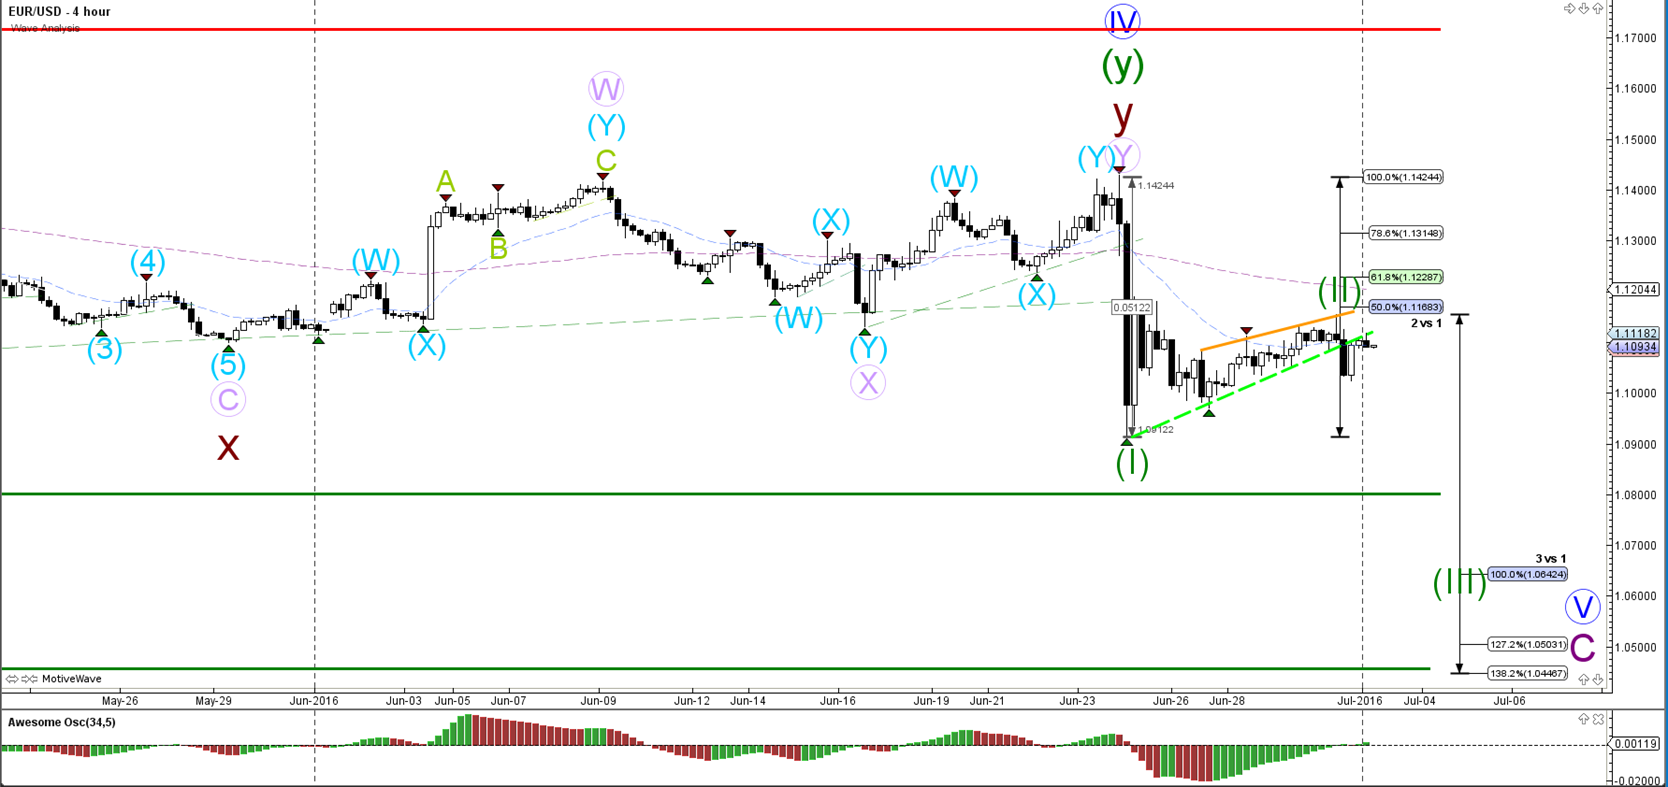
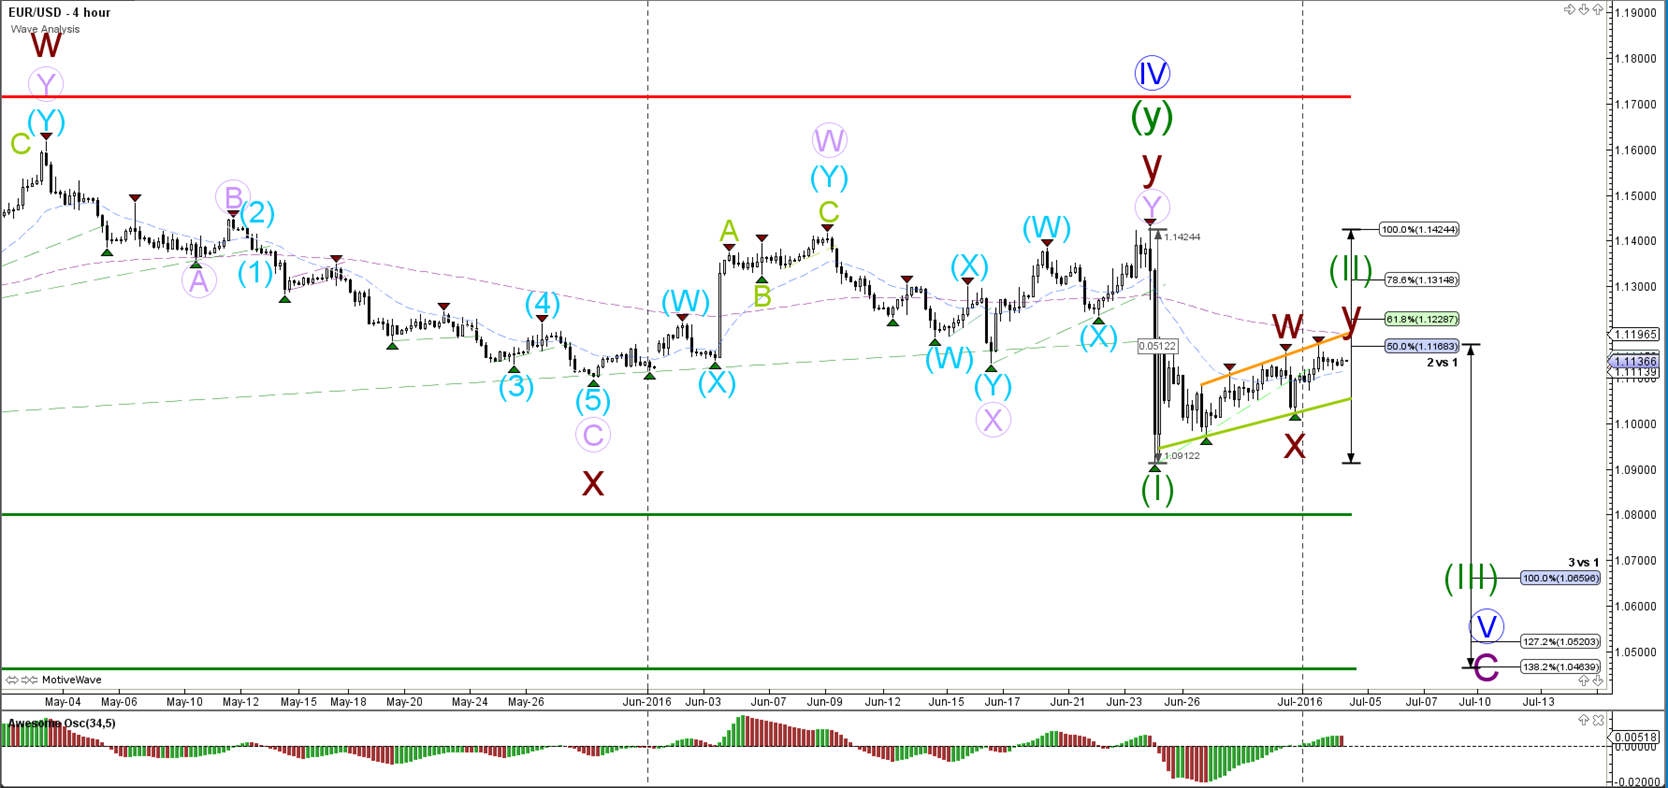
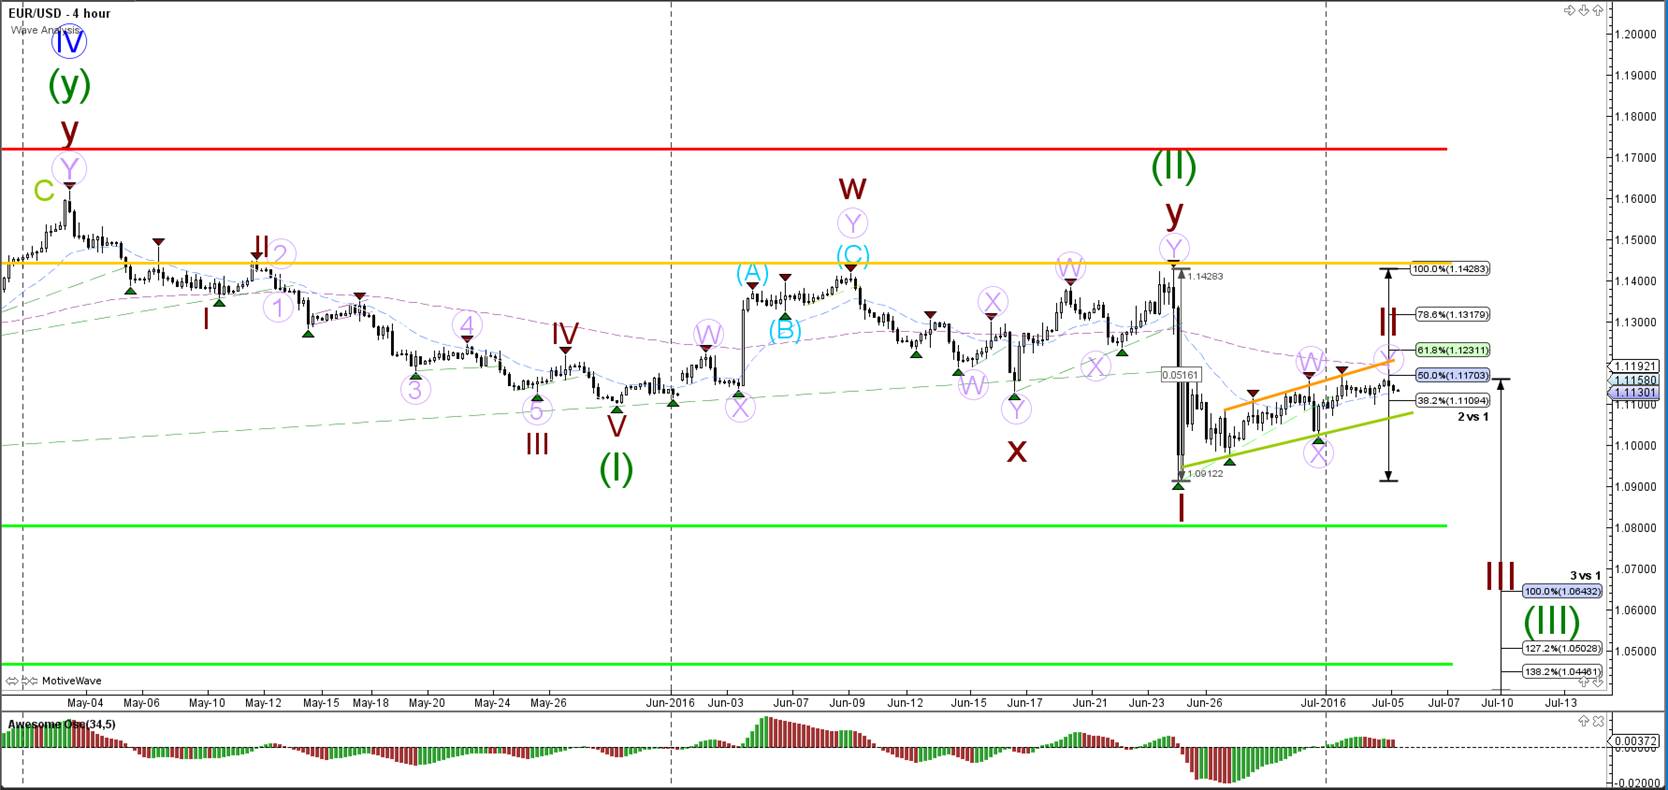
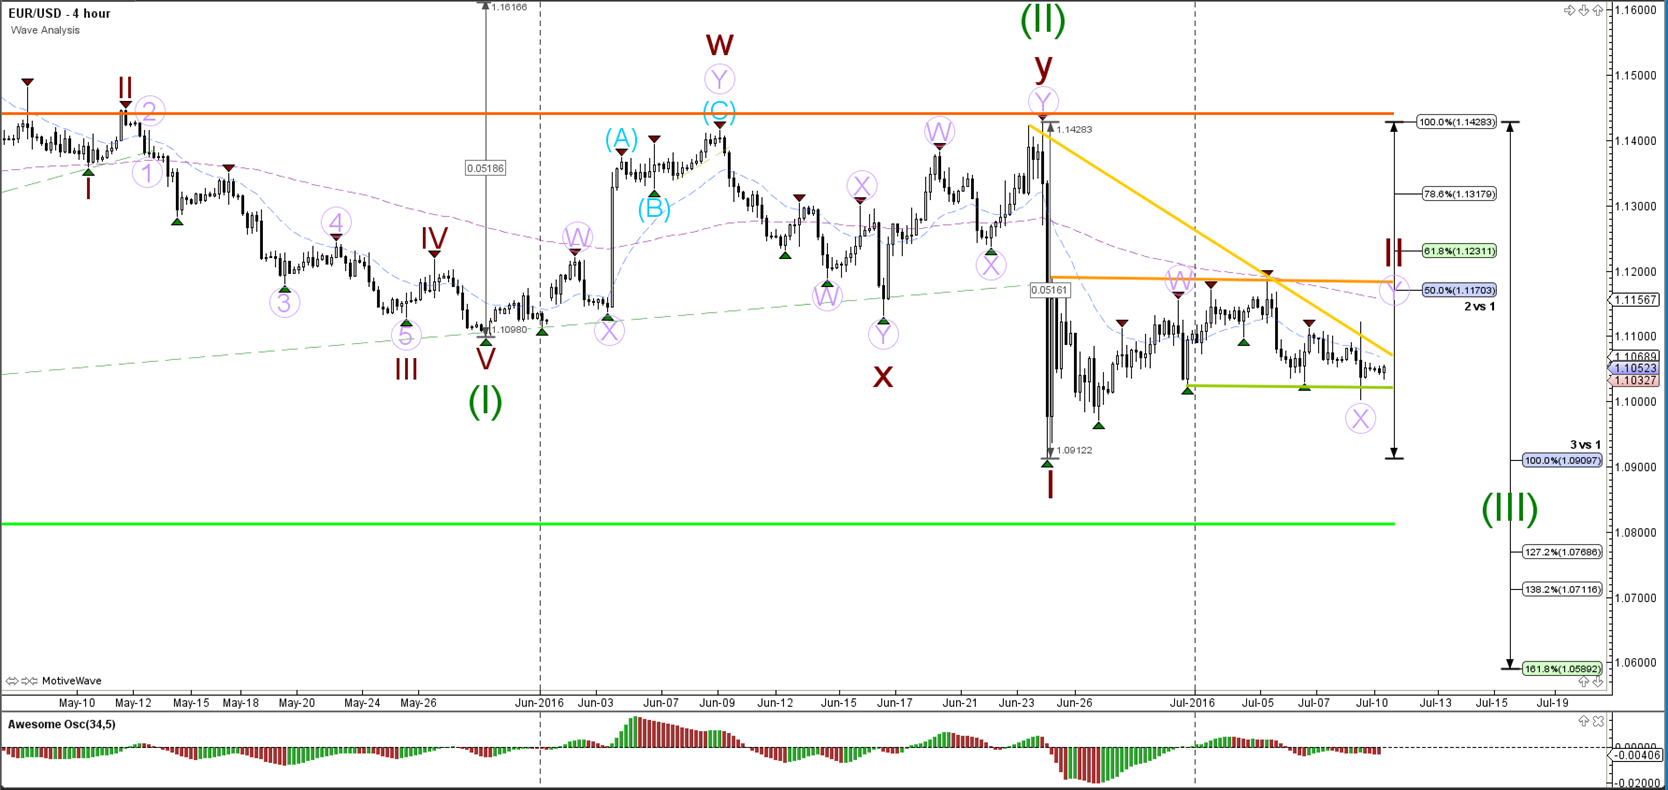
EUR/USD
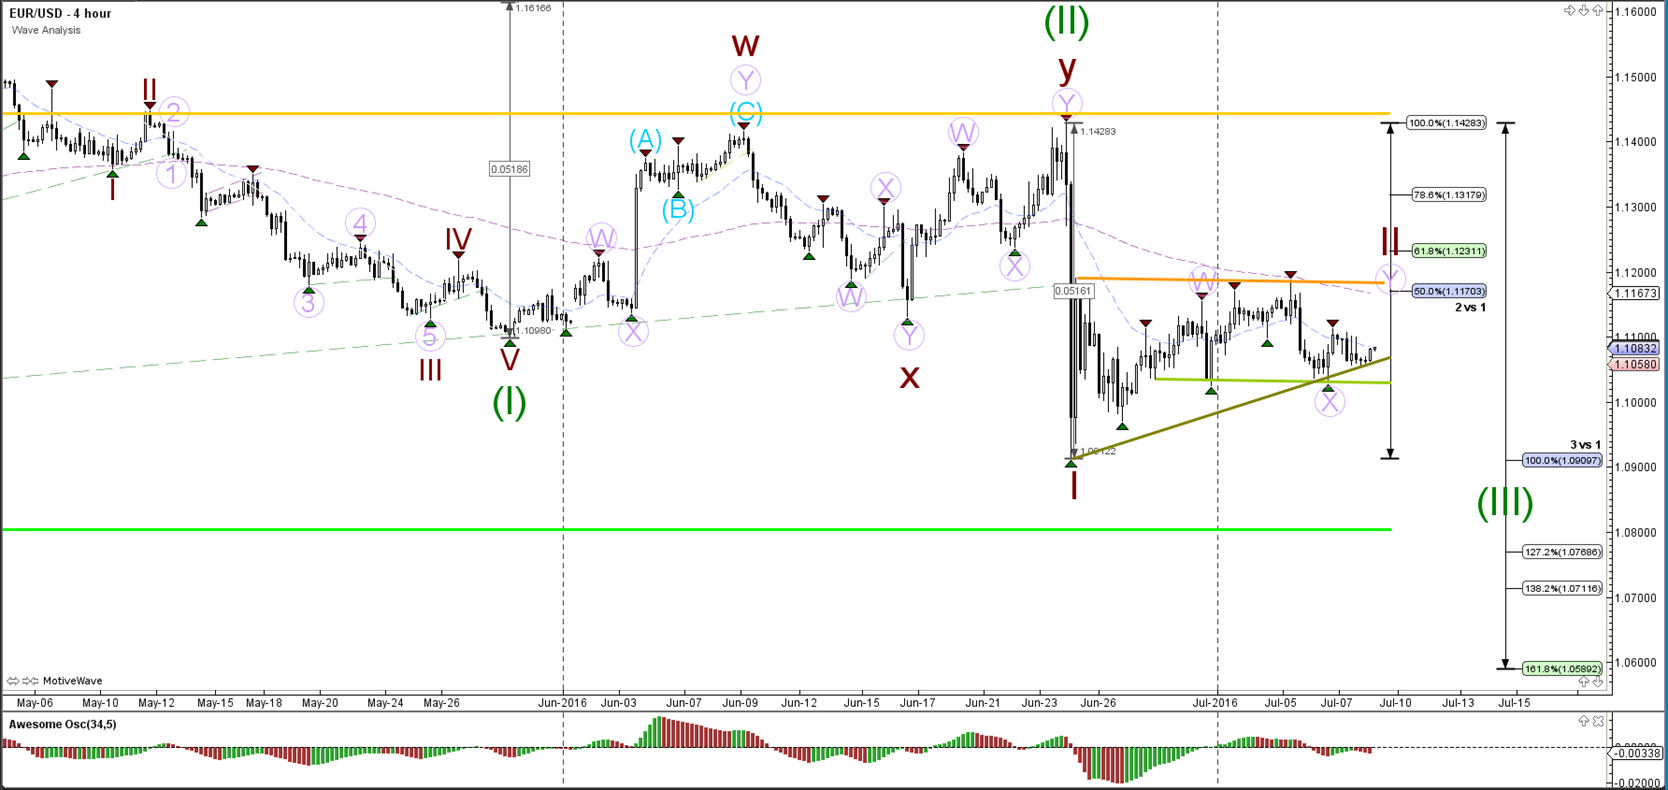
4 hour

The EUR/USD broke the support trend lines (dotted) upon the British electorate voting for Brexit last week. Price tumbled from 1.14 to 1.09 before retracing back to the 50%. The most likely wave count would suggest a wave 1-2 (green) within a wave 5 (purple) breakout. The wave 5 becomes invalidated if price were to break above the 100% Fibonacci level.
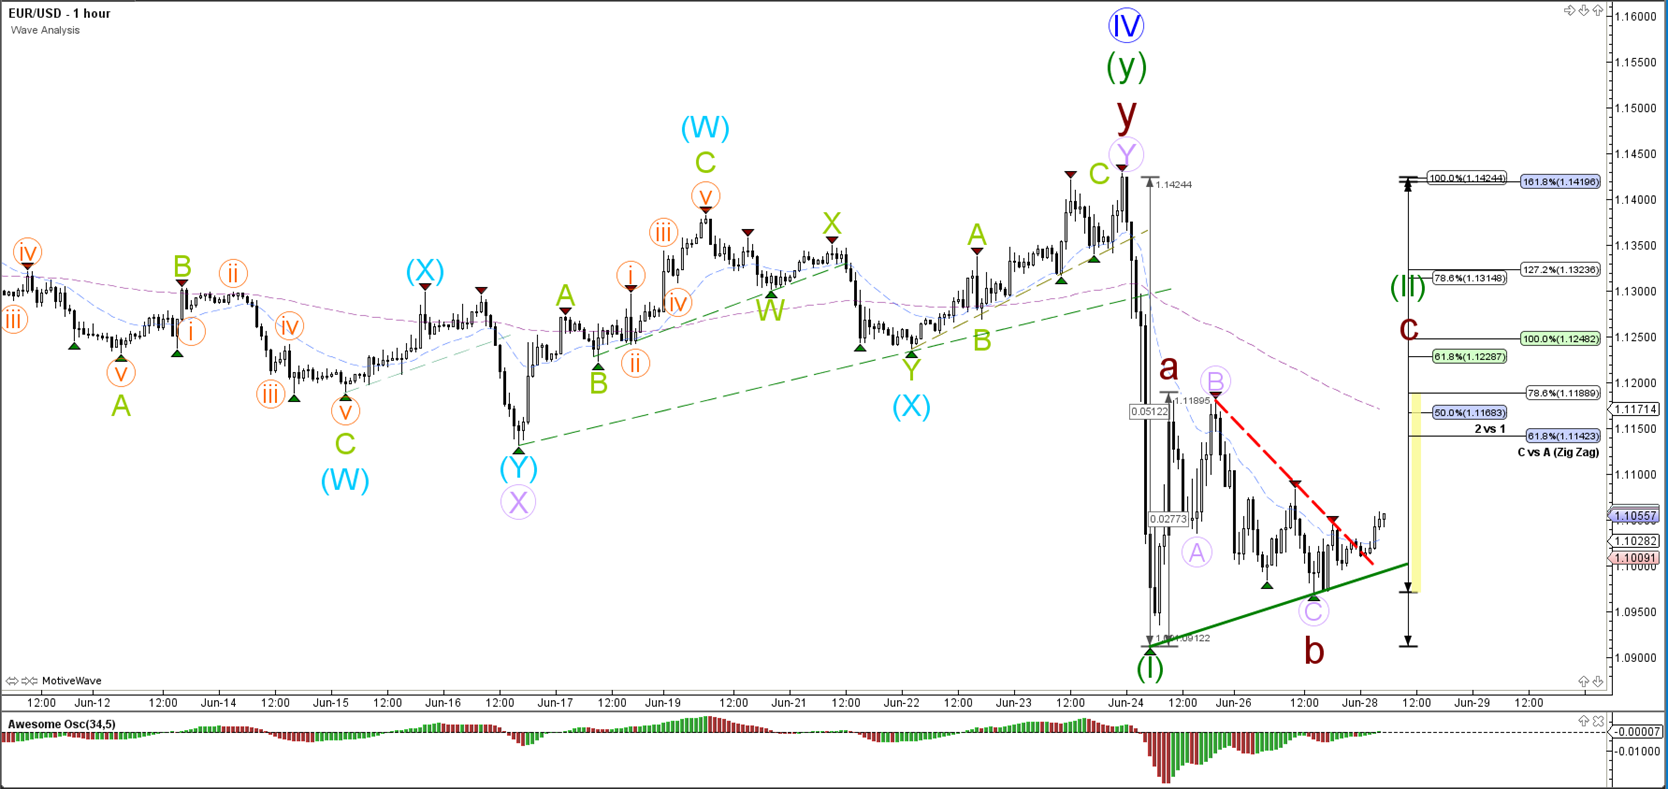
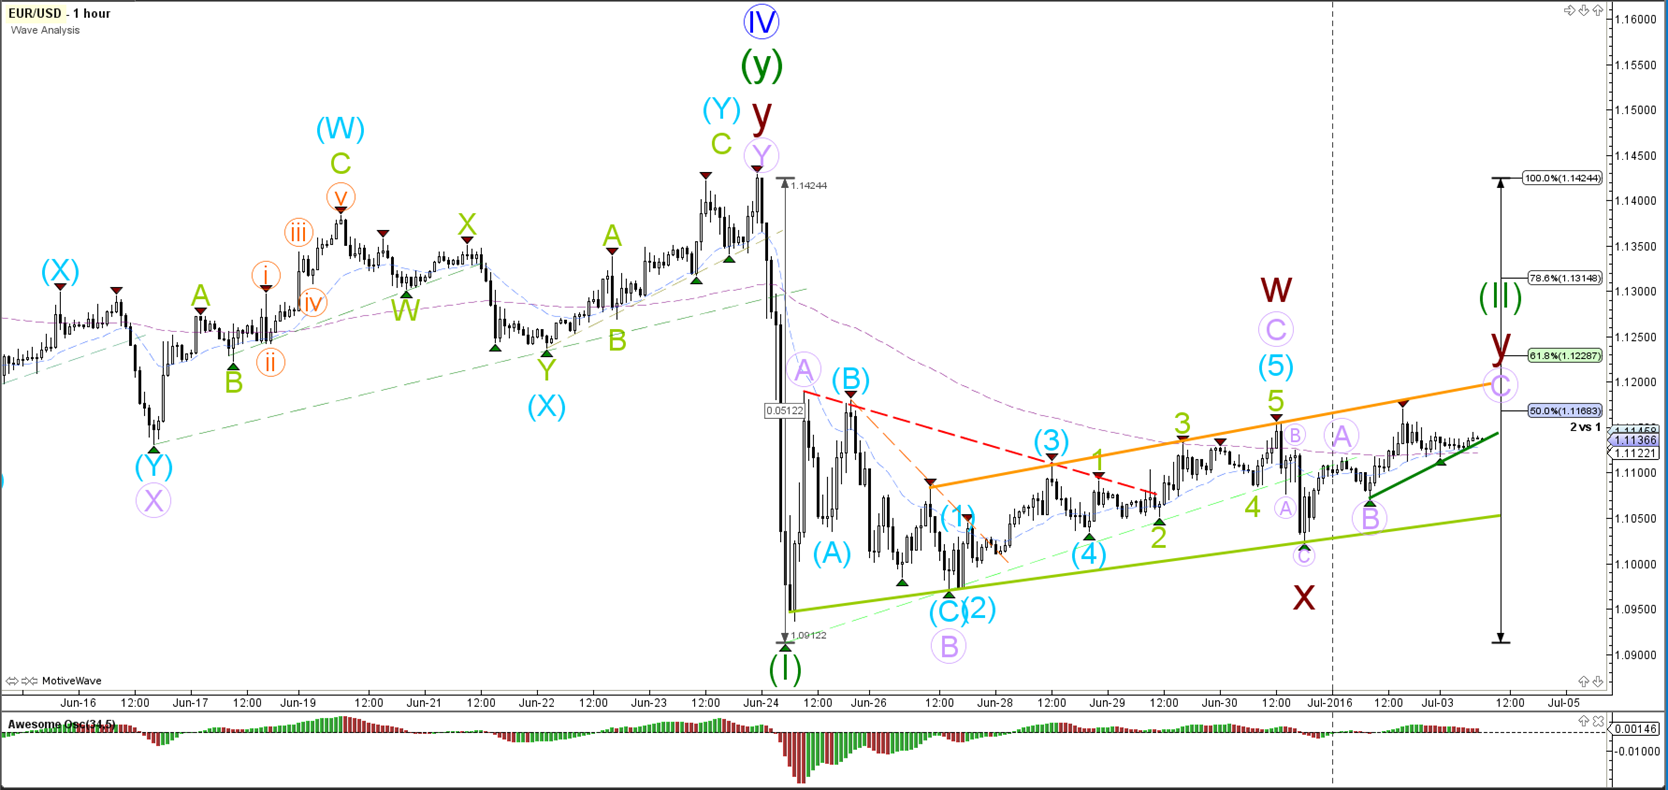
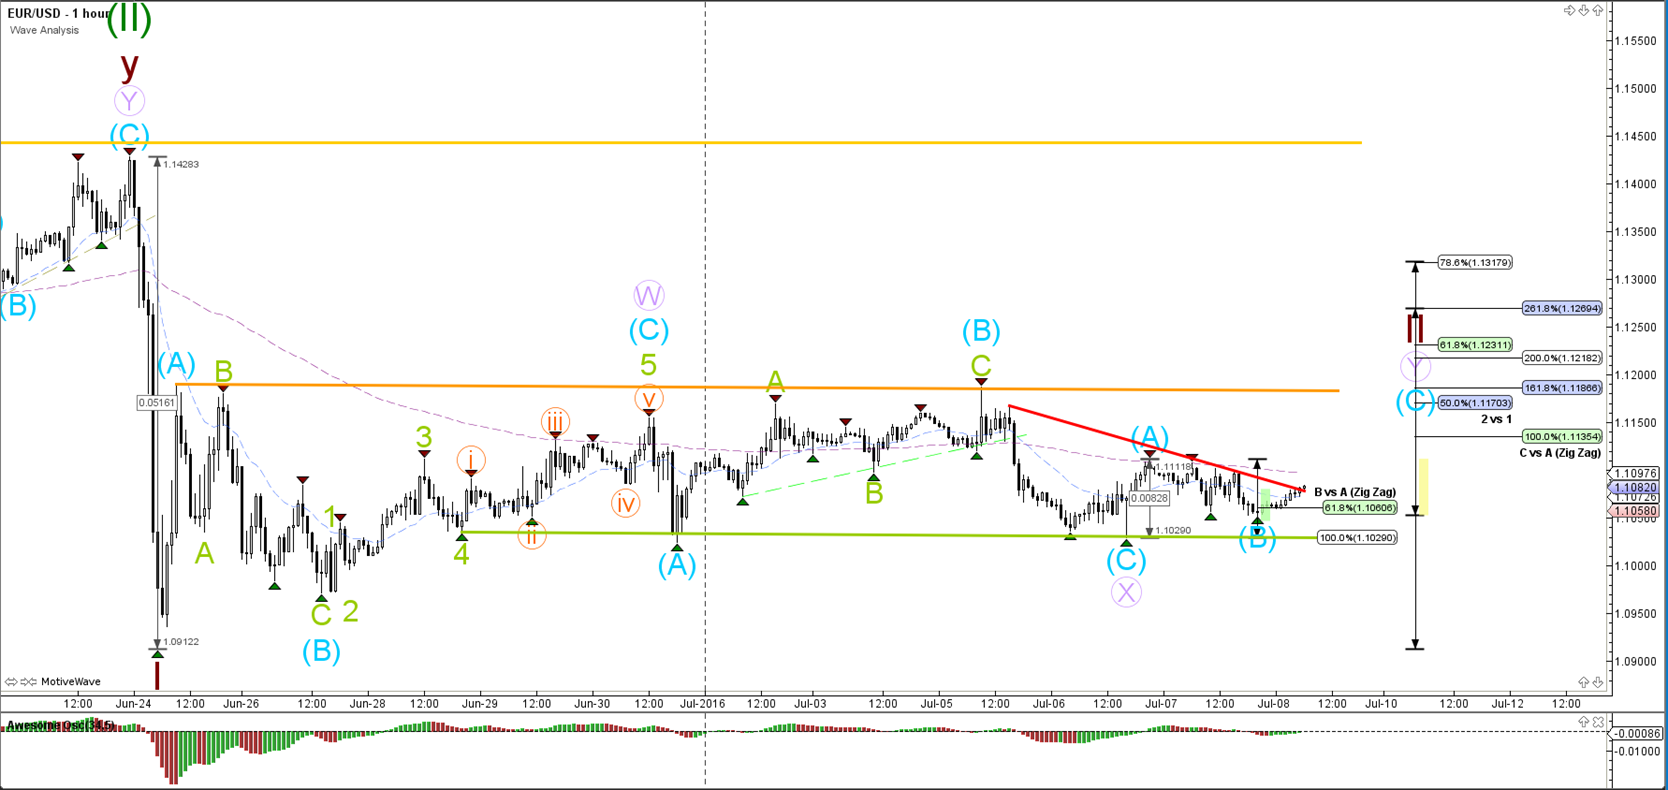
1 hour

The EUR/USD seems to be building a bullish zigzag (brown) correction within wave 2 (green). A break of the support trend line (green) could mark the completion of that wave 2.
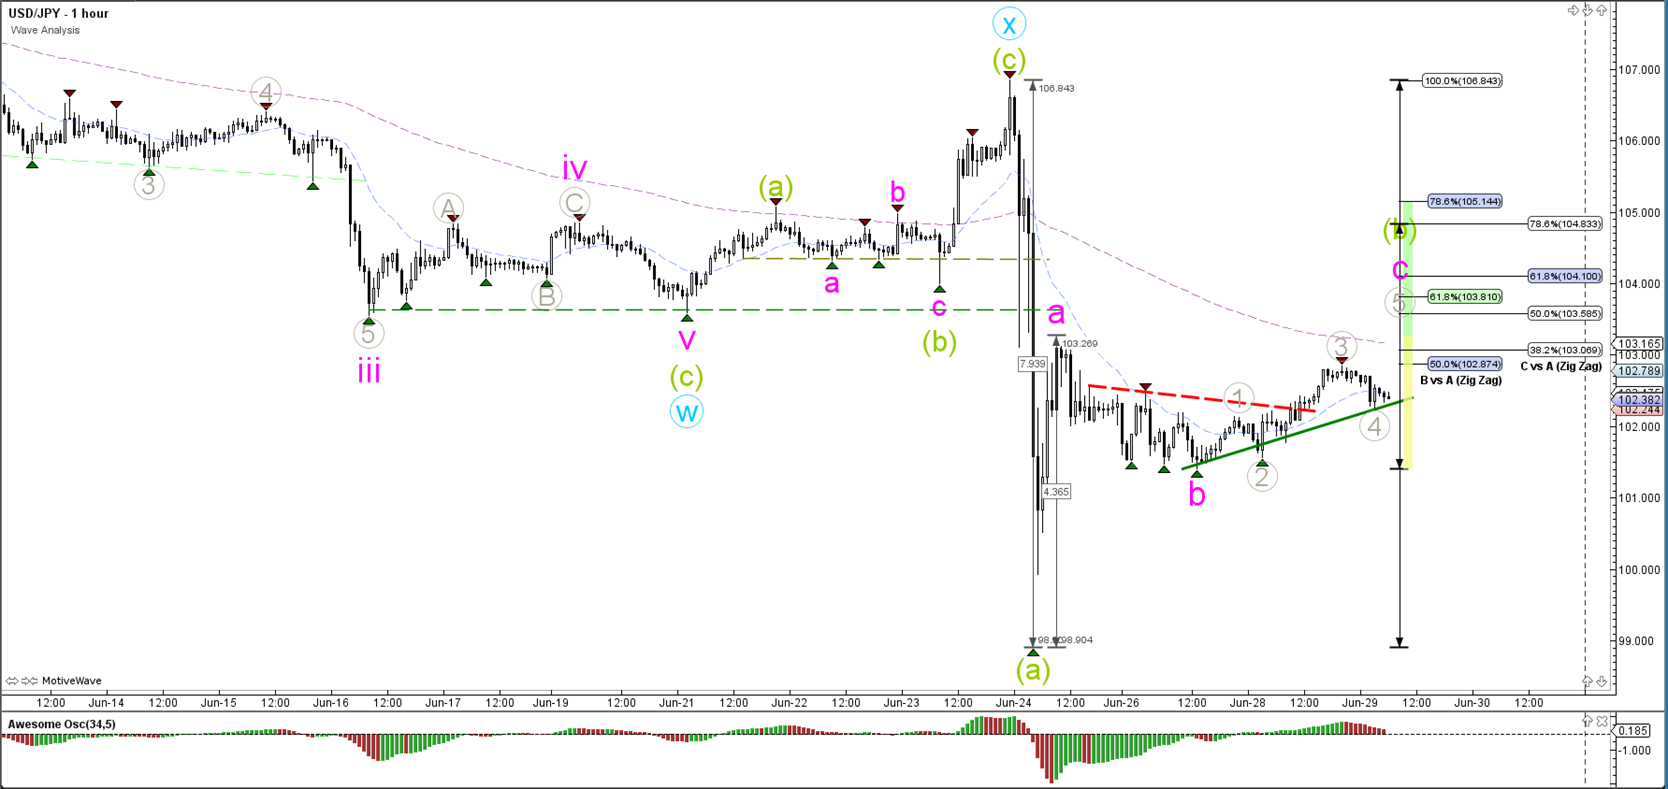
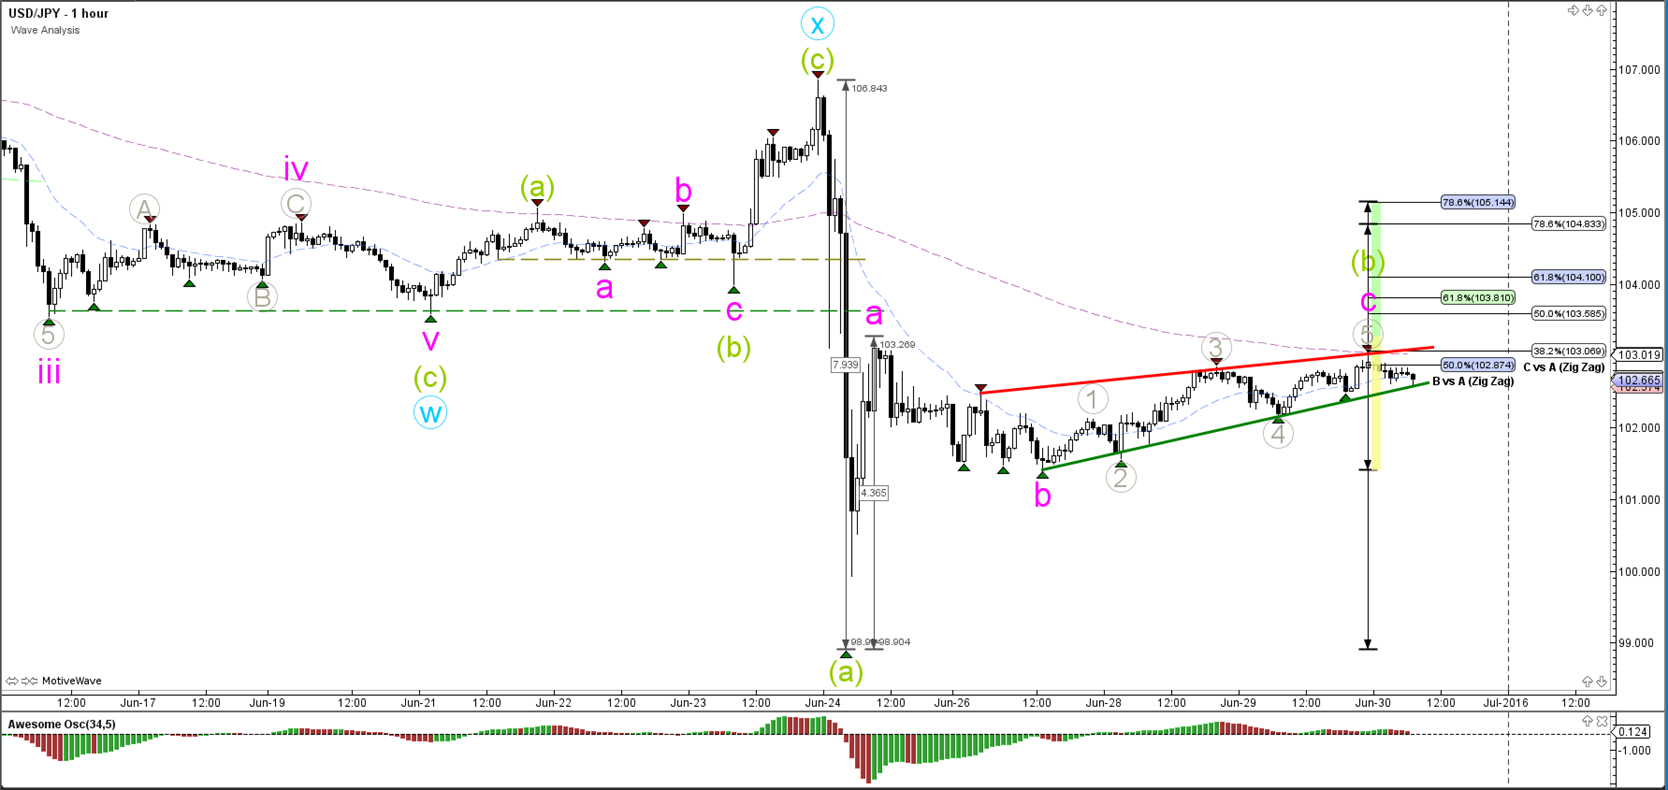
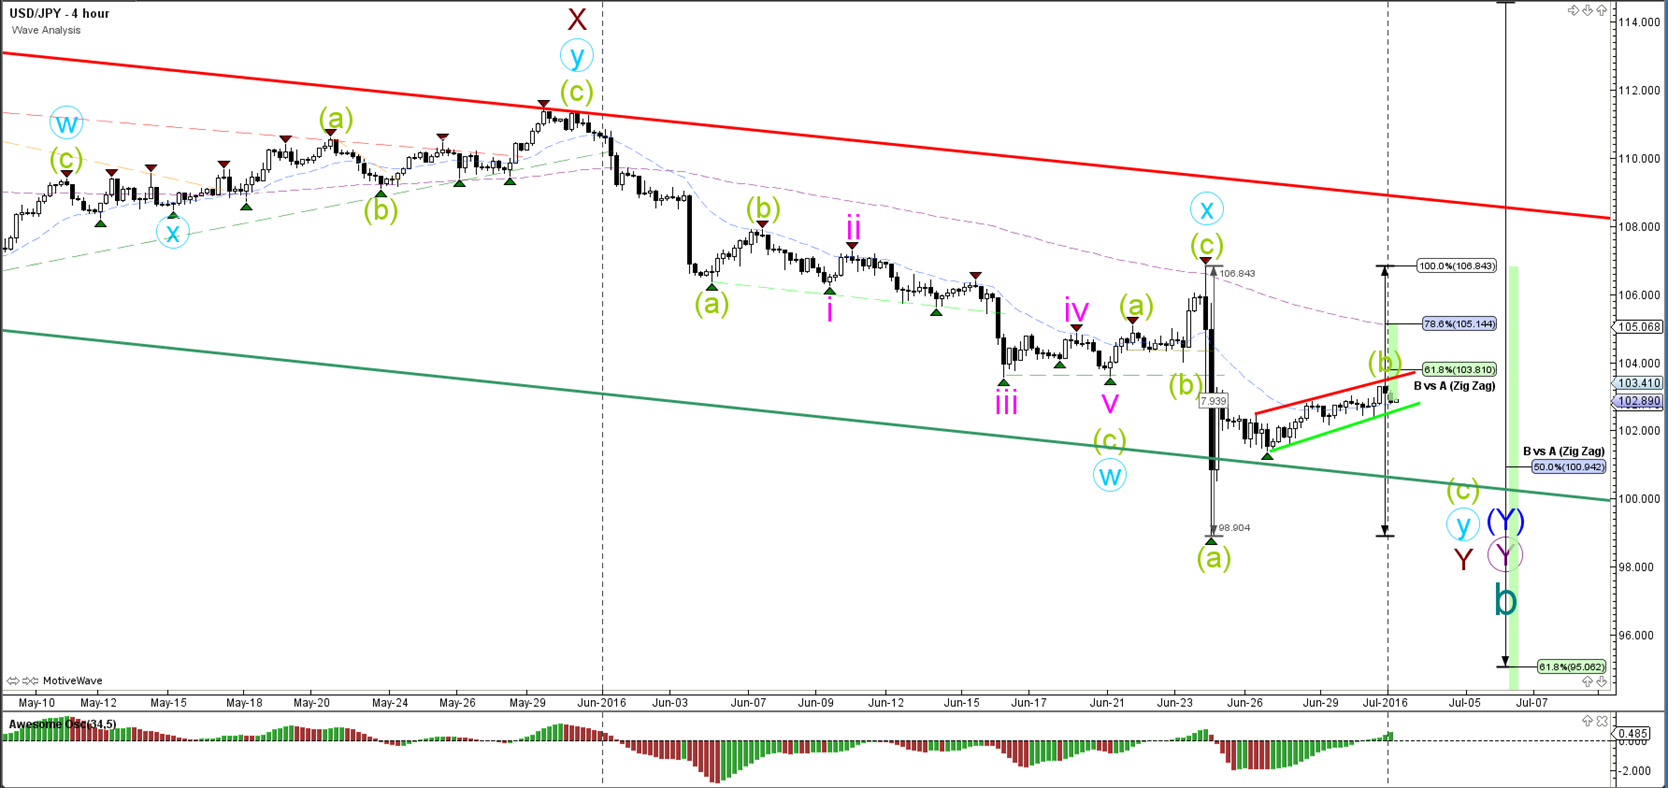
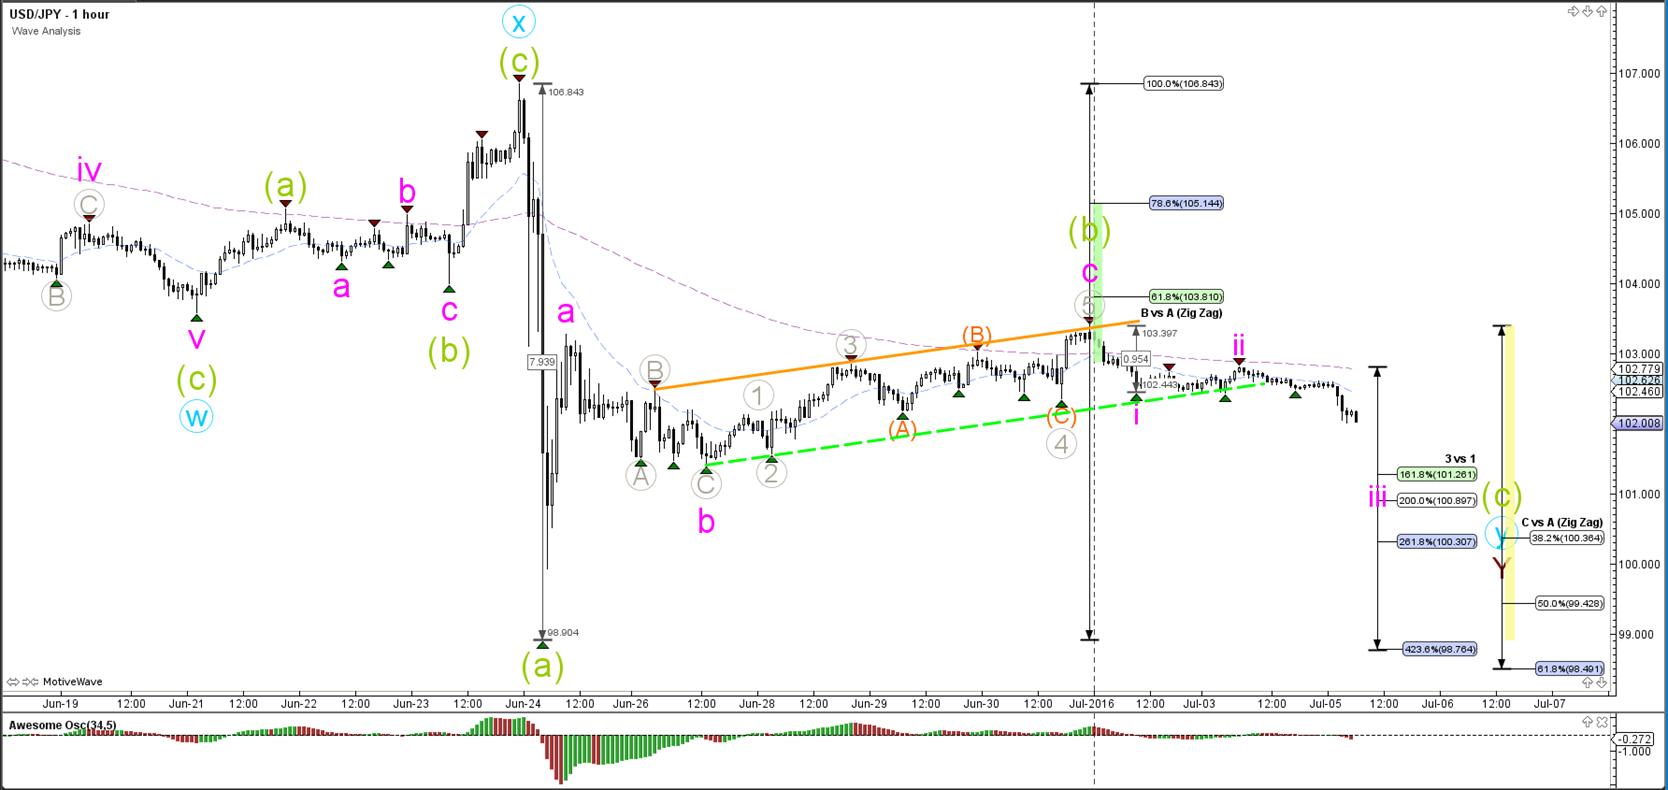
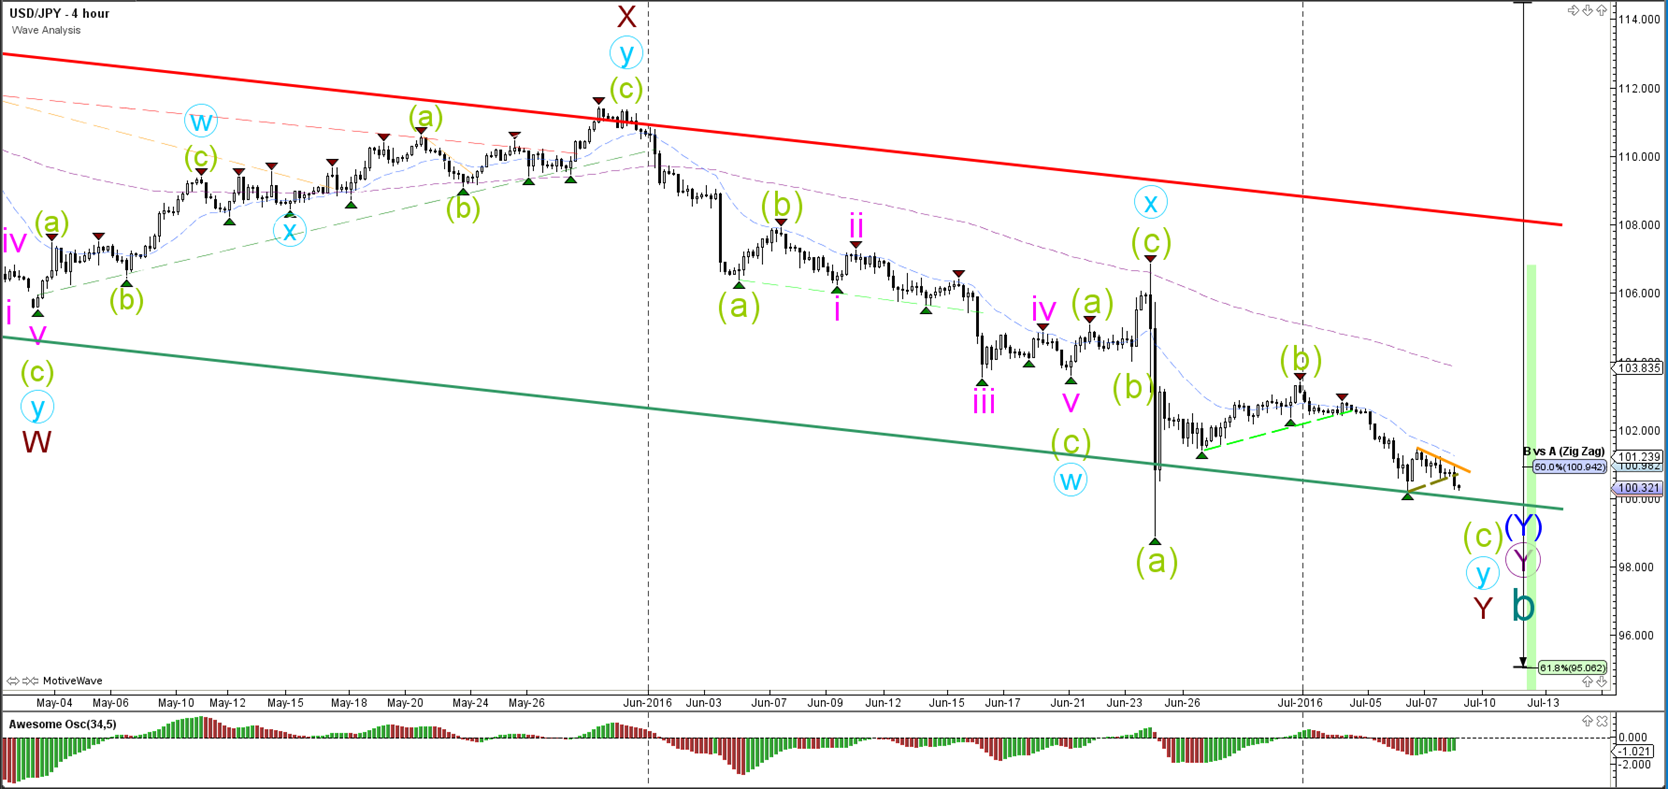
USD/JPY
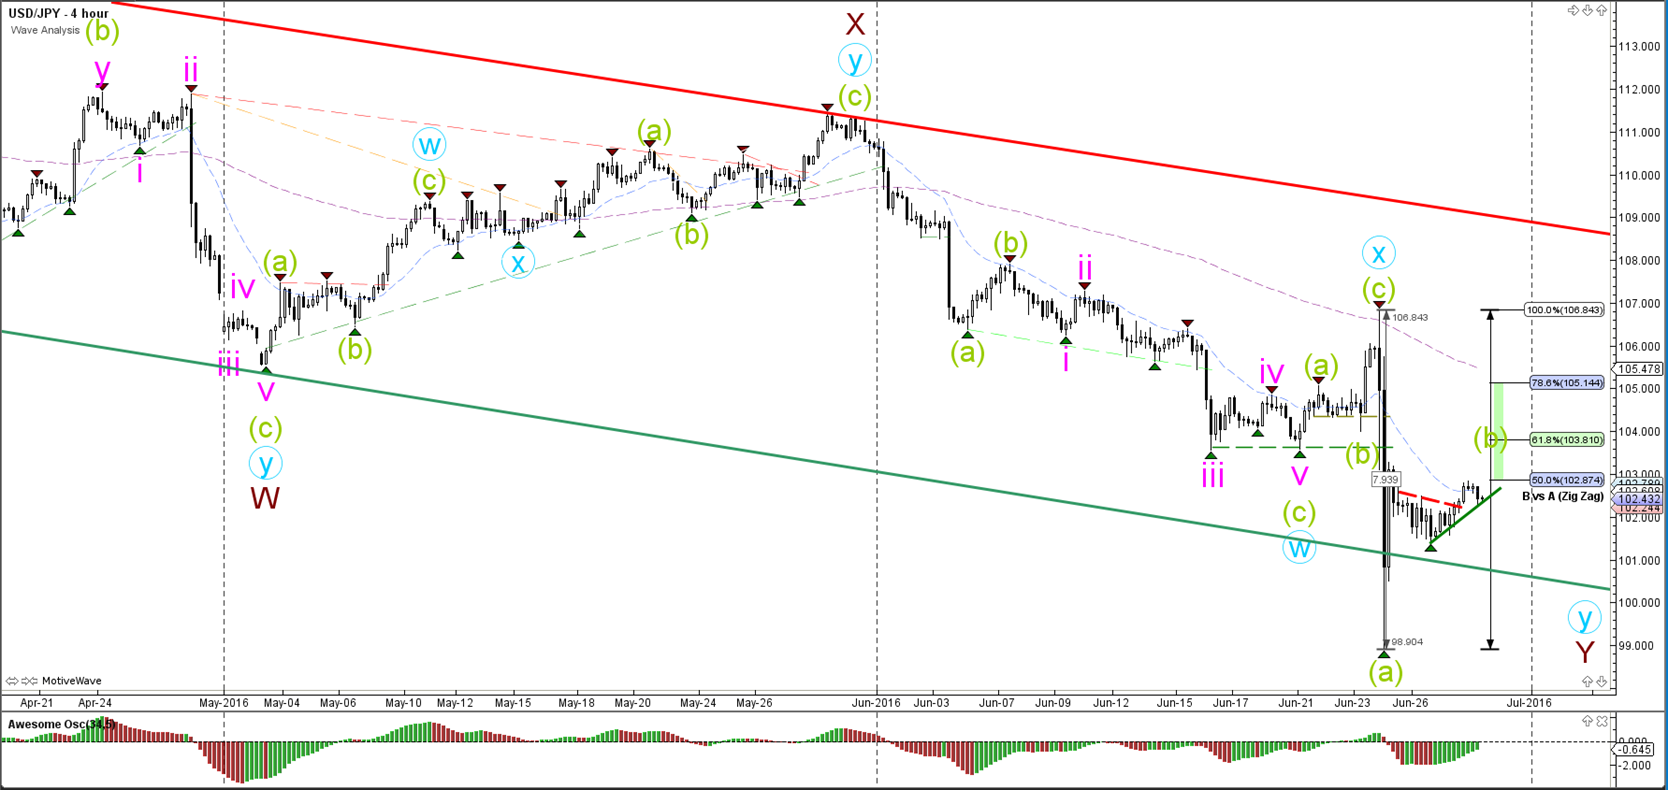
4 hour

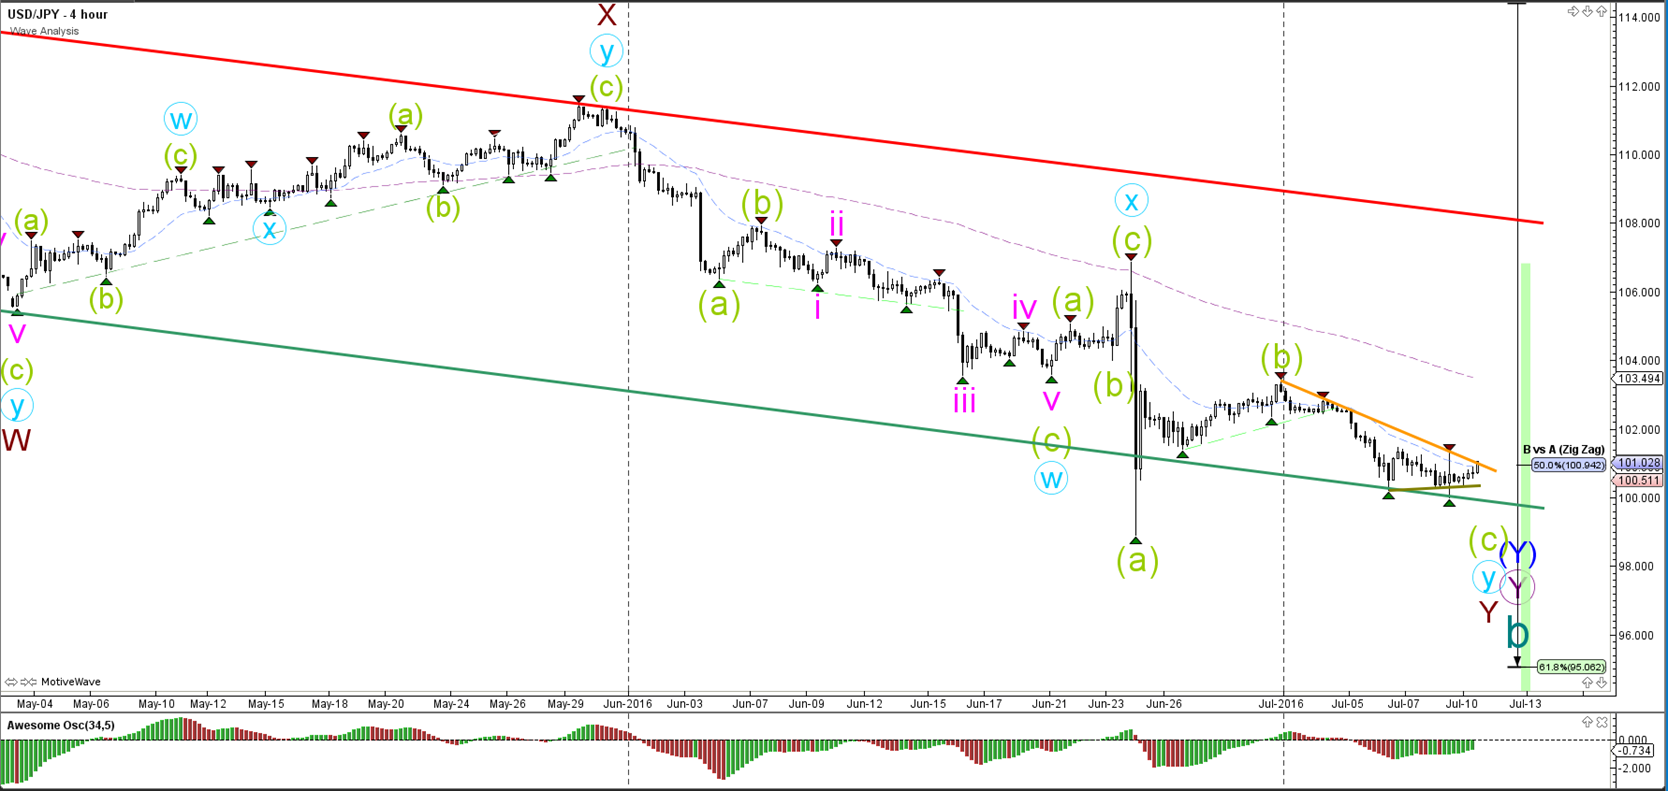
The USD/JPY has moved down towards and bounced at the 50% Fibonacci level. Price could bounce at this Fib or fall towards the 61.8%.
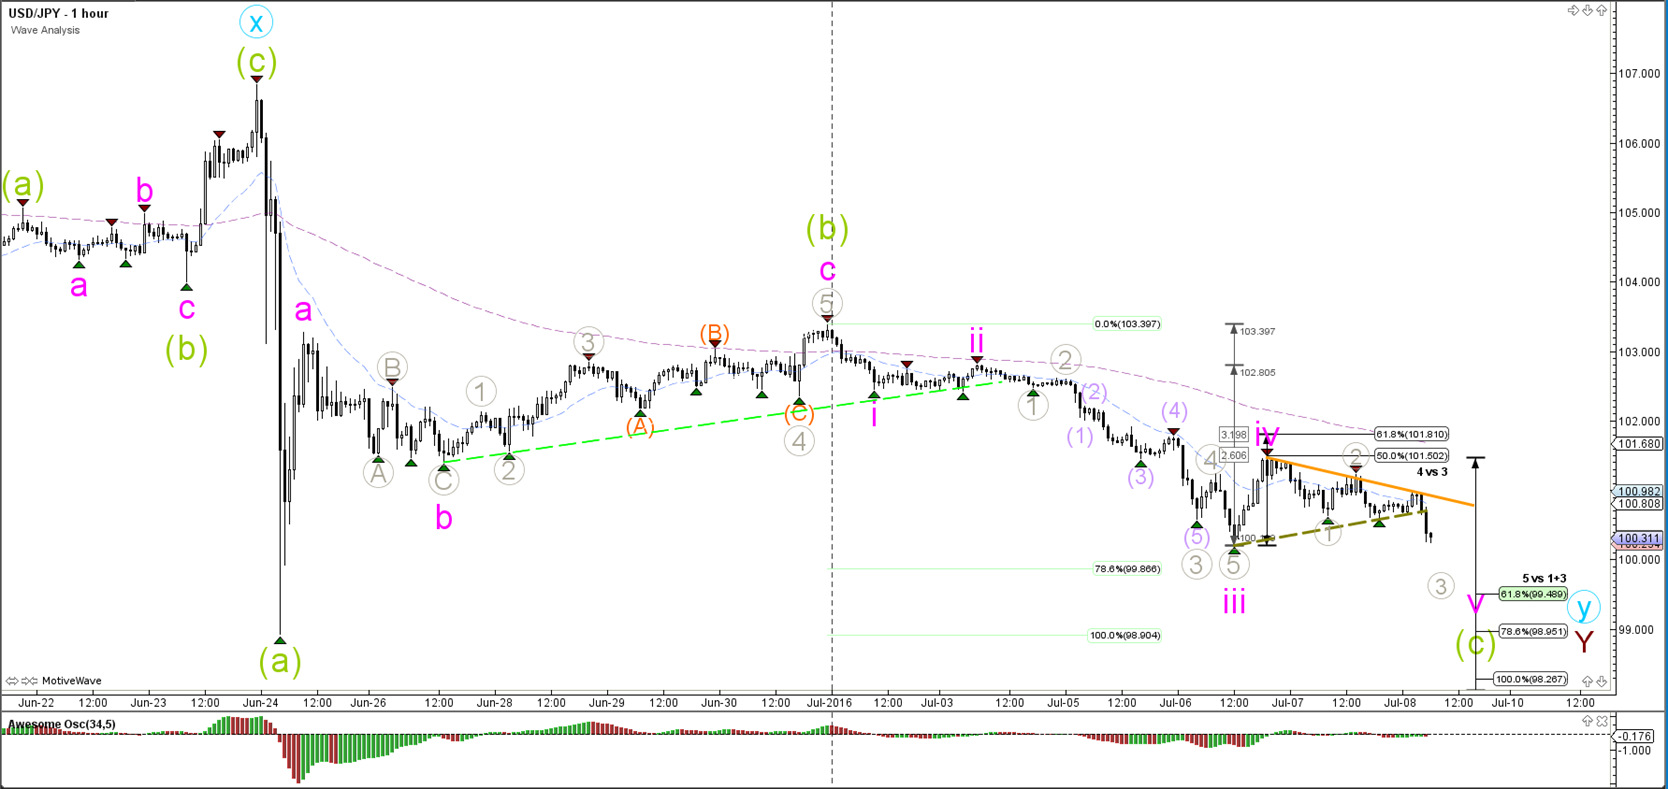
1 hour

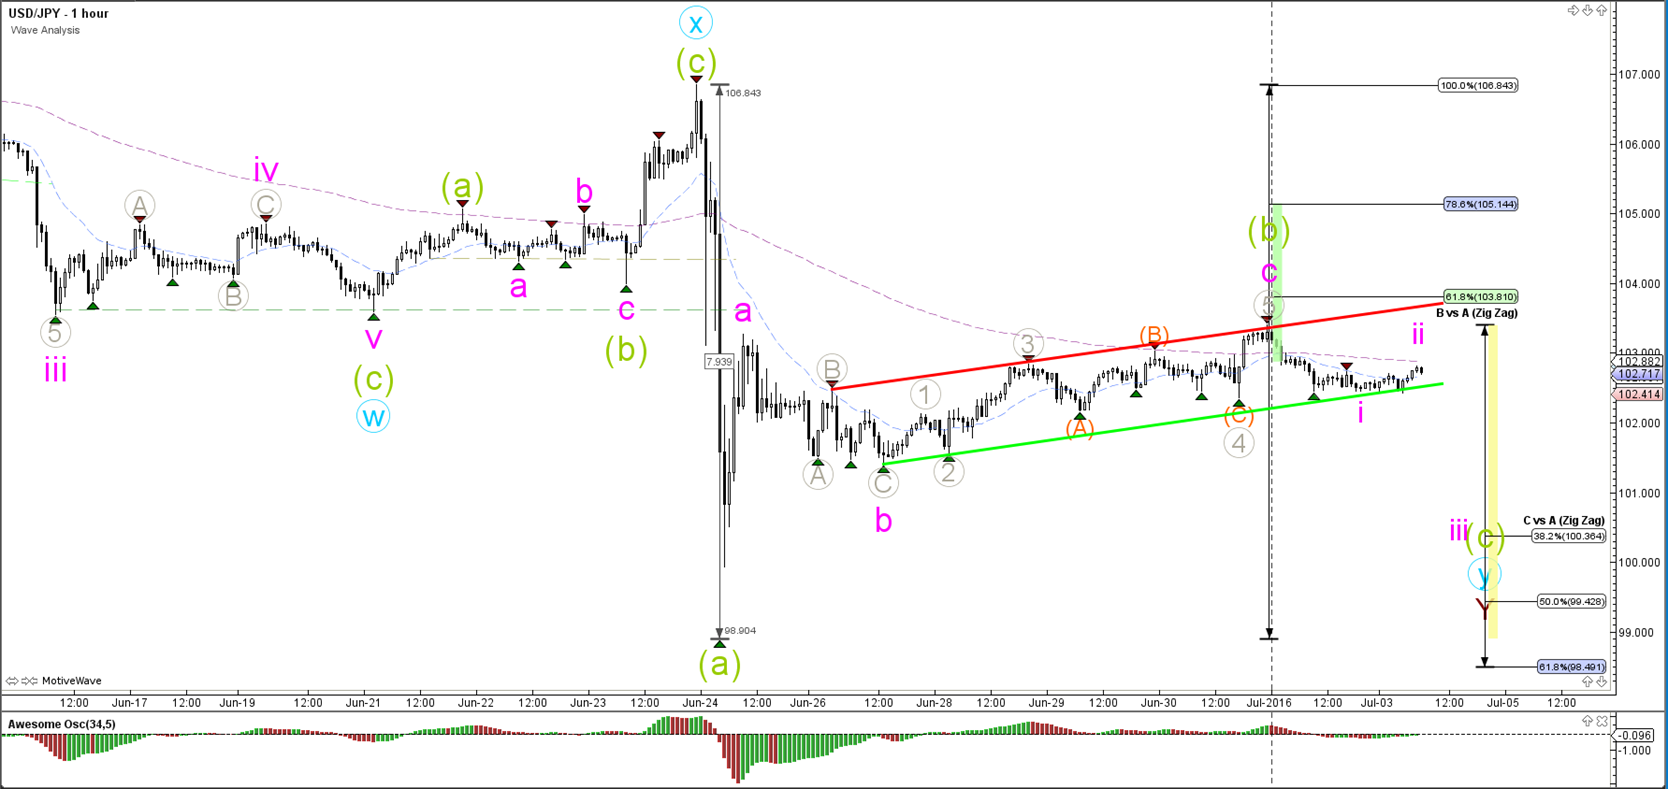
The USD/JPY is building a bullish zigzag (pink) within wave B (green).
“Original analysis is provided by Admiral Markets”
GBP/USD
4 hour
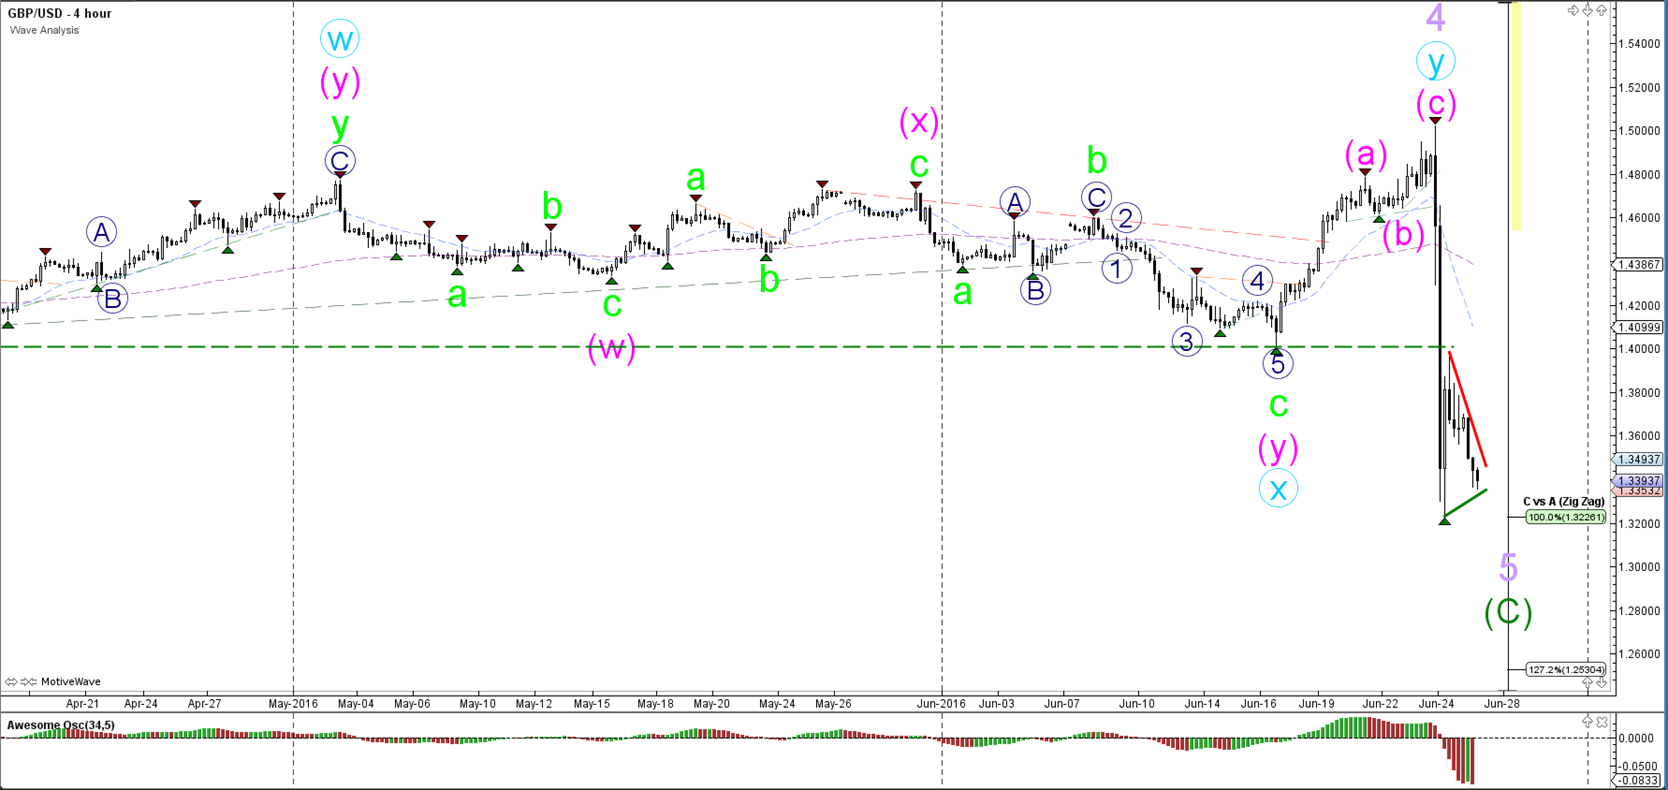
The GBP/USD took a strong hit and made a nose dive from 1.50 to 1.32 when the Brexit results were released. The first target of the wave C (green) has been hit and reached but further bearish pressure could mean an extension to the next Fibonacci 127.2% target at 1.25.
1 hour
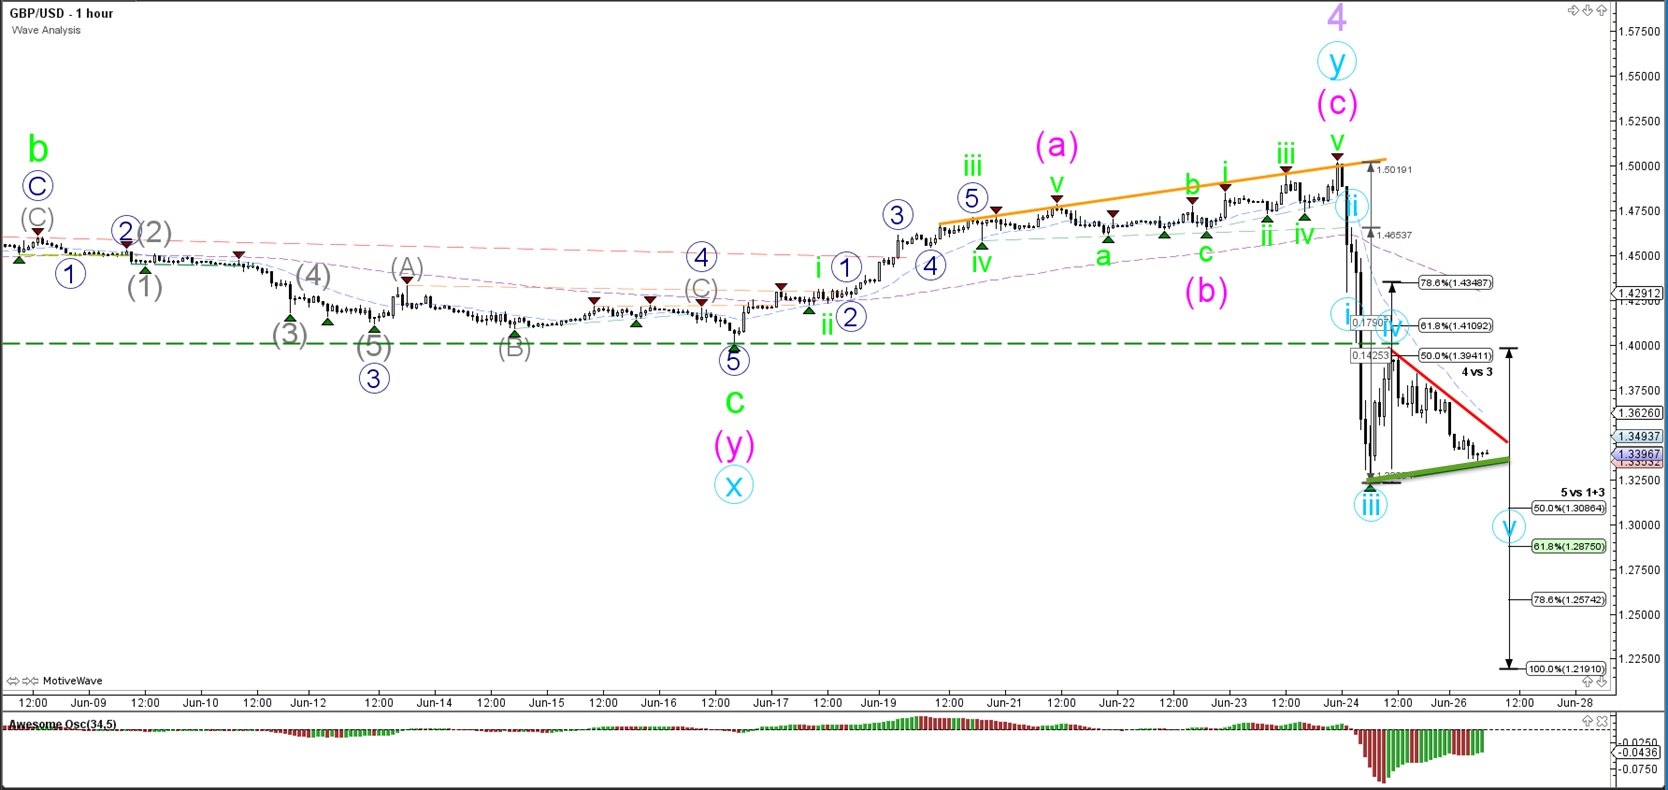
The GBP/USD seems to building a 5 wave structure (blue) within the wave 5 of the 4 hour chart. Wave 4 (blue) respected the 50% Fibonacci level. A push above the 78.6% invalidates the wave 4. A break below the support trend line (green) could start the wave 5 (blue). A larger wave 4 consolidation where price goes sideways is also possible.
EUR/USD
4 hour

The EUR/USD broke the support trend lines (dotted) upon the British electorate voting for Brexit last week. Price tumbled from 1.14 to 1.09 before retracing back to the 50%. The most likely wave count would suggest a wave 1-2 (green) within a wave 5 (purple) breakout. The wave 5 becomes invalidated if price were to break above the 100% Fibonacci level.
1 hour
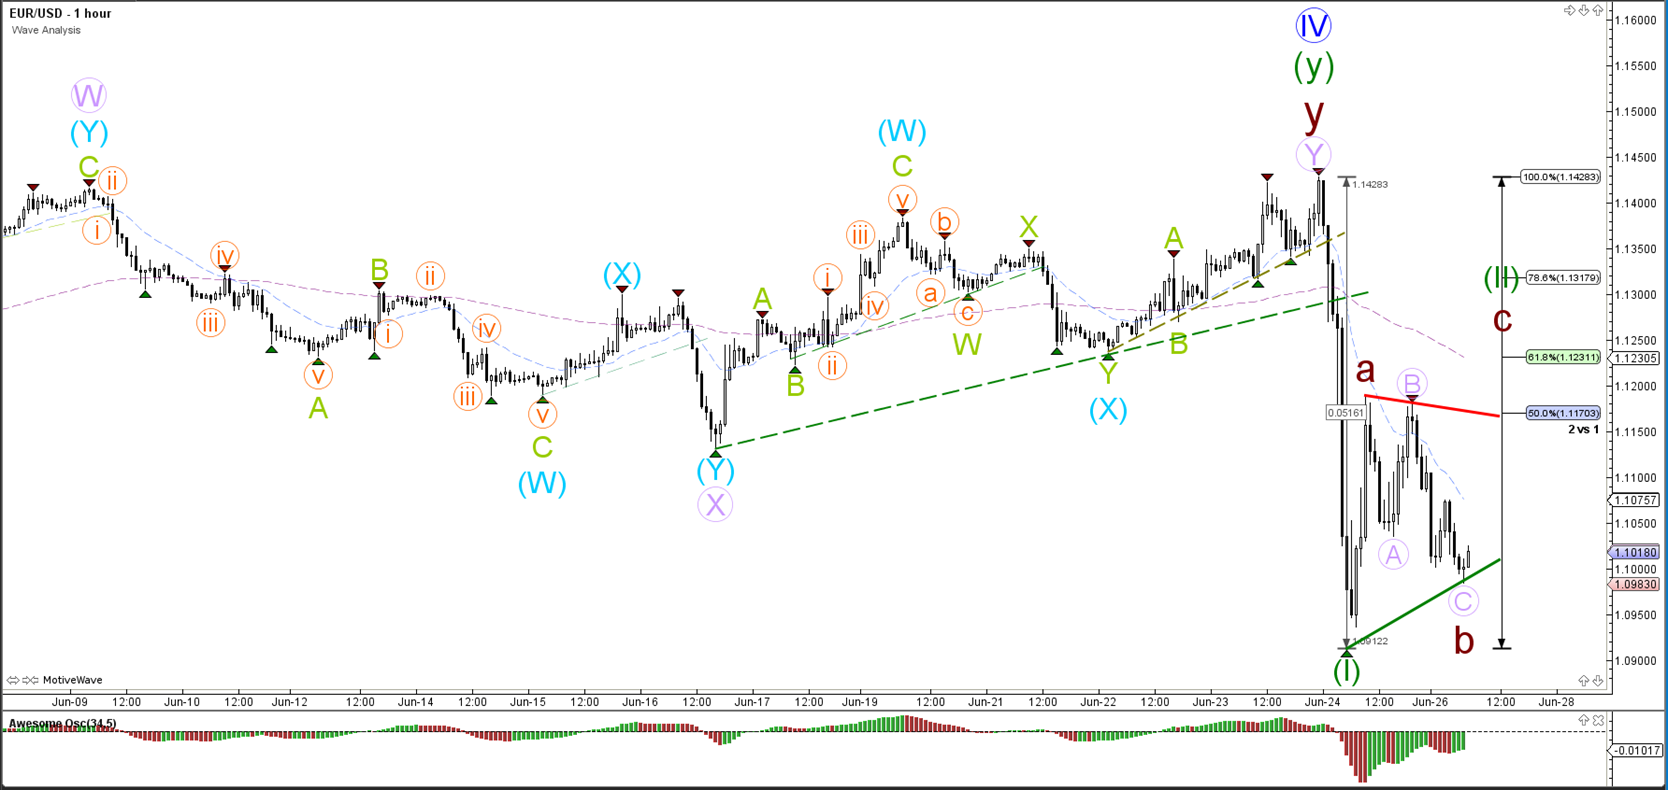
The EUR/USD seems to be building a bullish zigzag (brown) correction within wave 2 (green). A break of the support trend line (green) could mark the completion of that wave 2.
USD/JPY
4 hour

The USD/JPY has moved down towards and bounced at the 50% Fibonacci level. Price could bounce at this Fib or fall towards the 61.8%.
1 hour
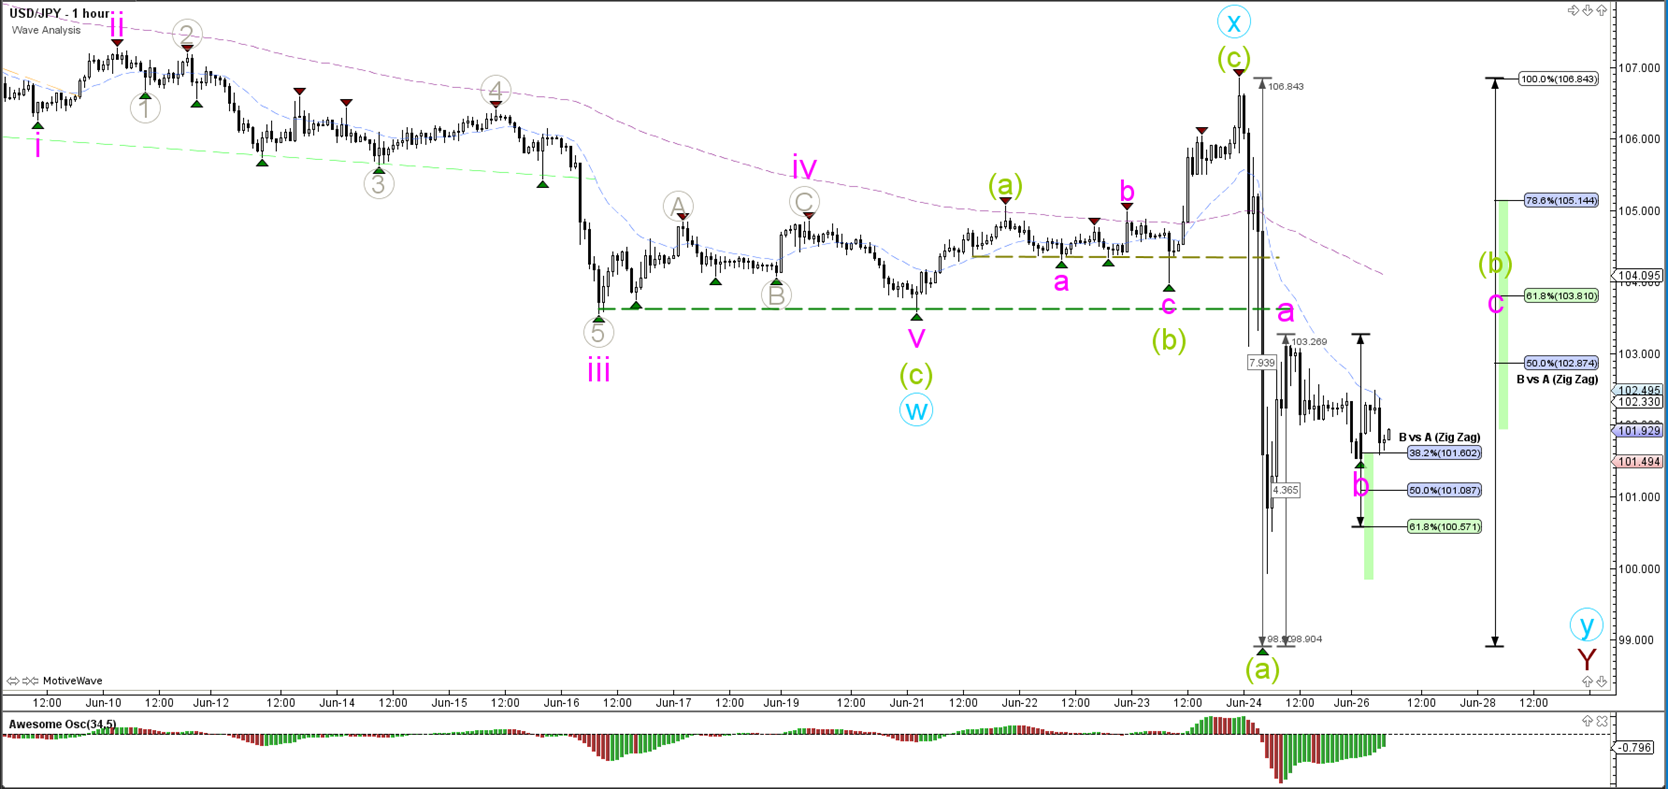
The USD/JPY is building a bullish zigzag (pink) within wave B (green).
“Original analysis is provided by Admiral Markets”