Admiral Markets
AdmiralMarkets.com Representative
- Messages
- 95
EUR/USD, USD/JPY develop divergent patterns: bear flag versus wave-3 momentum
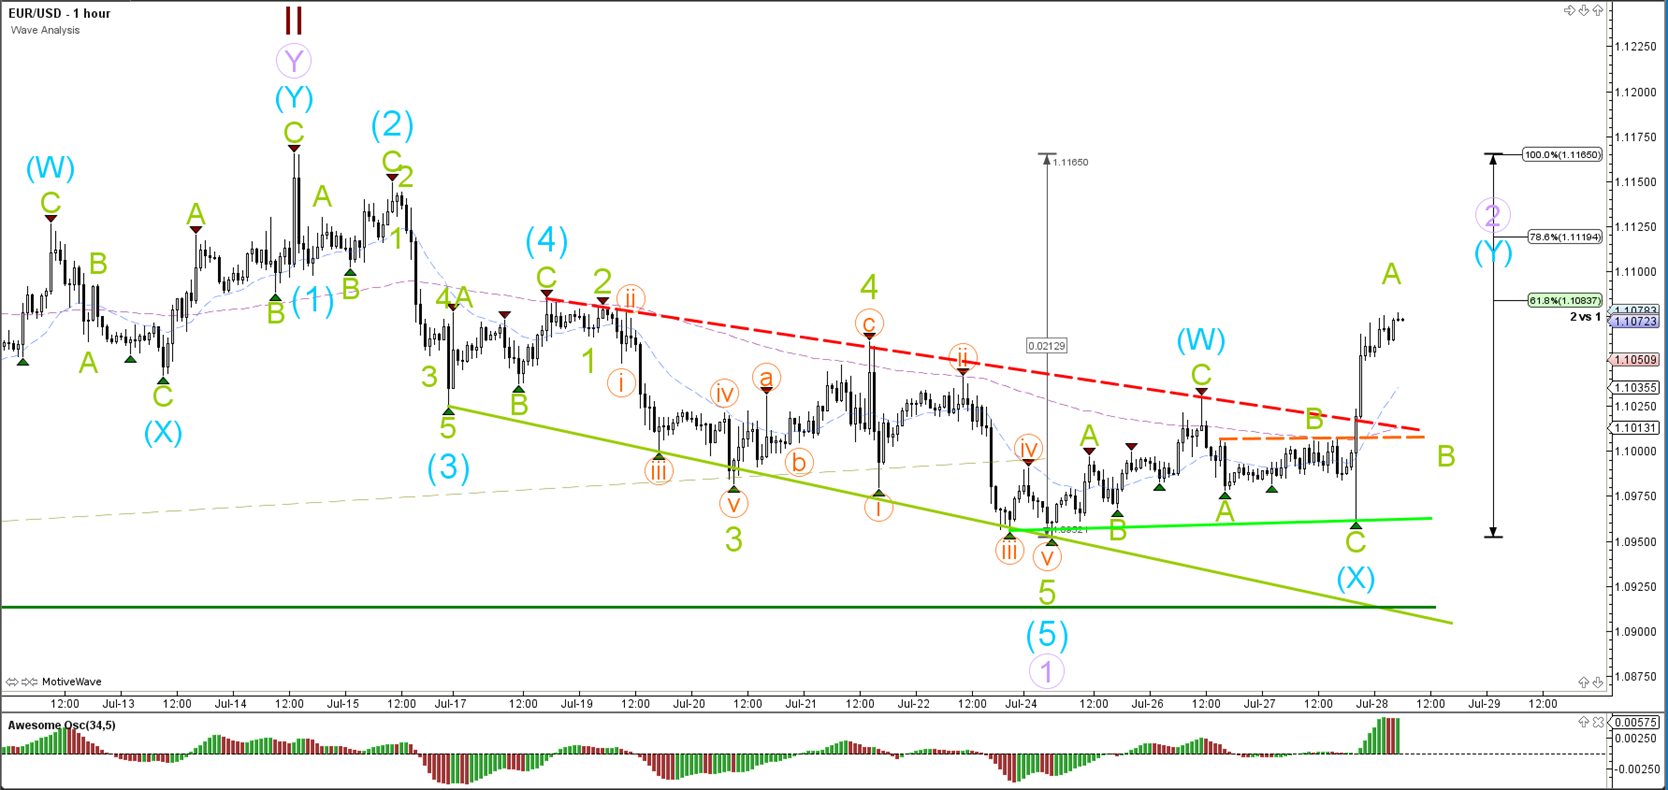
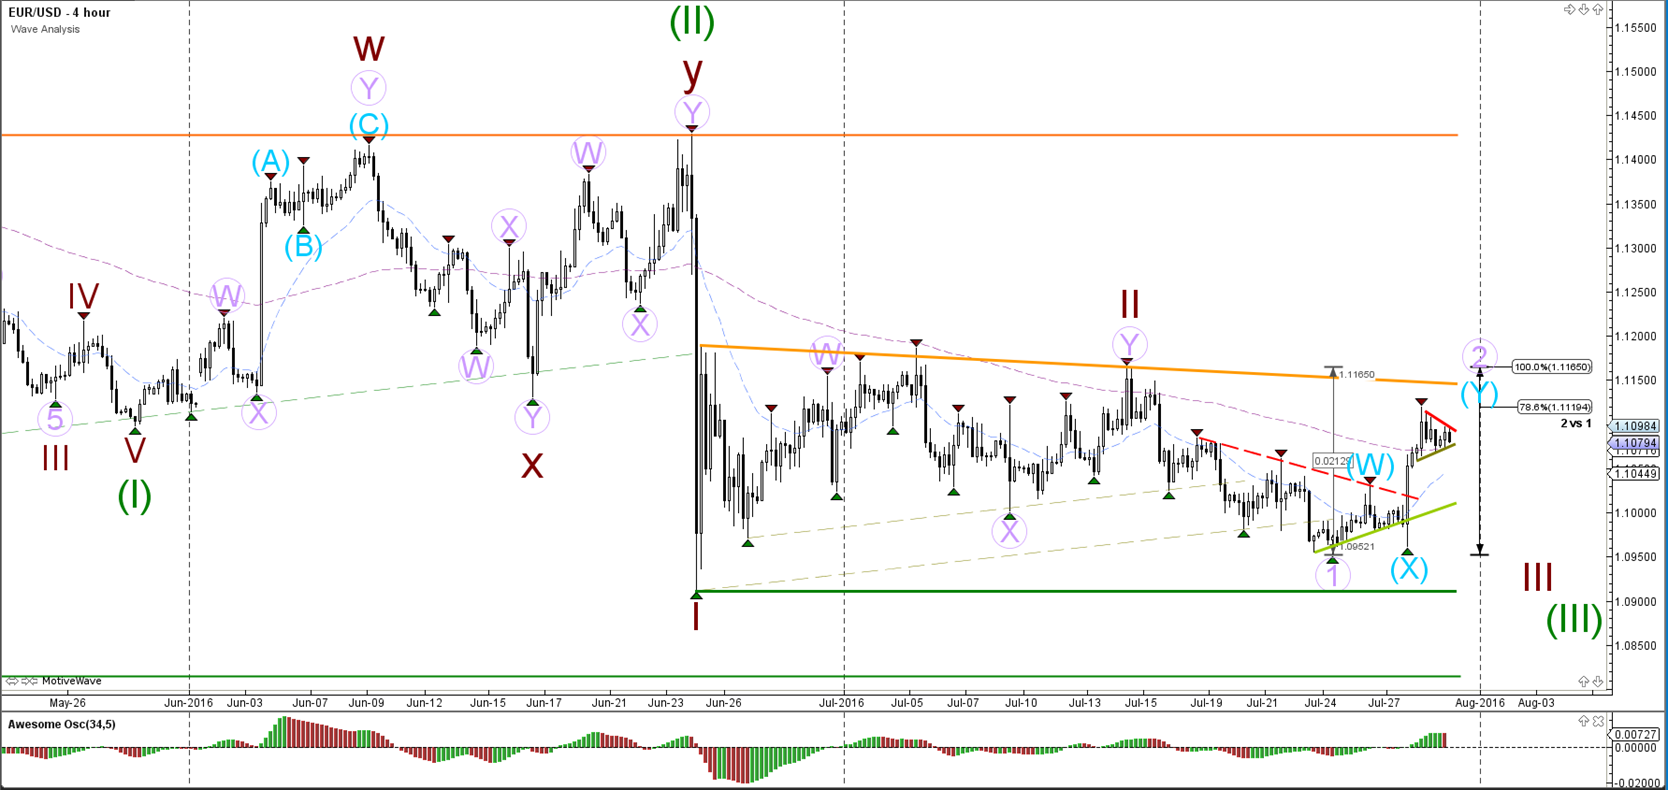
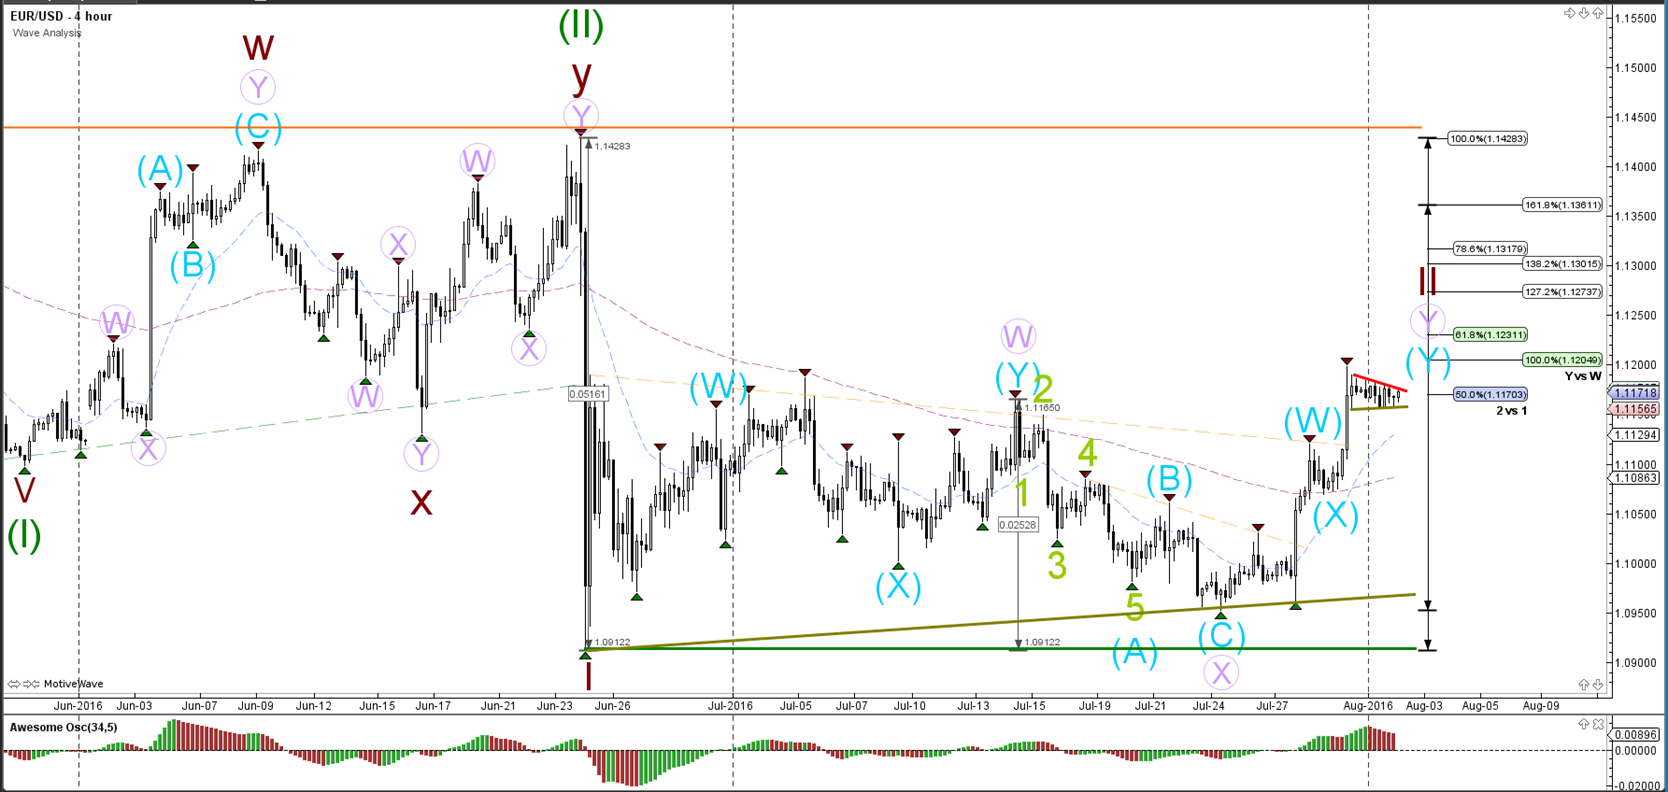
EUR/USD
4 hour
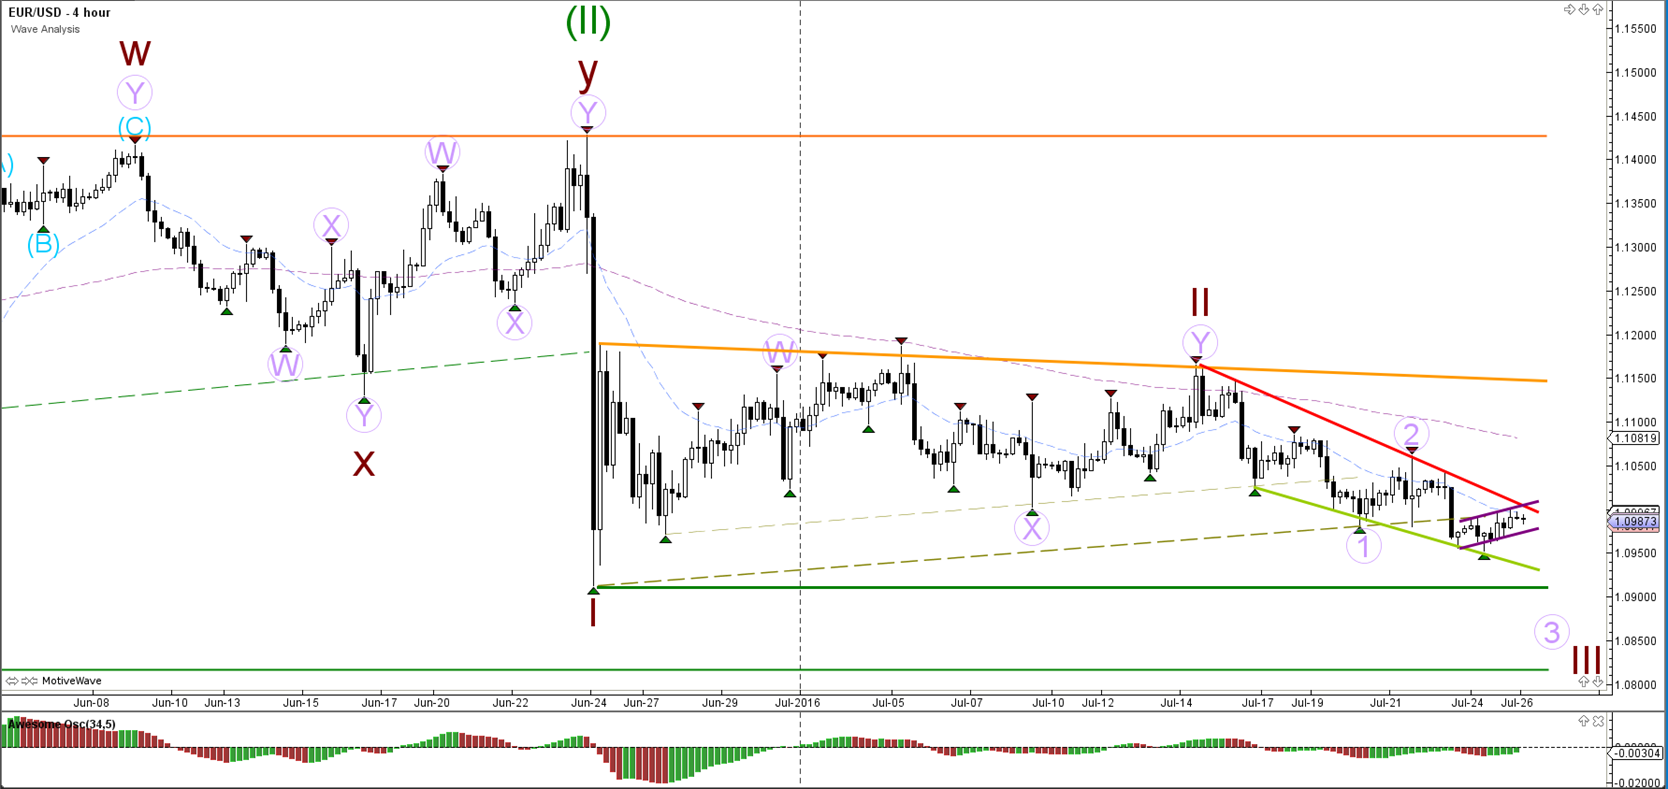
The EUR/USD is building a downtrend with lower lows and lower highs but price has not been able to break the bottom of wave 1 (brown) as yet. Price needs to break below the wave 1 bottom support (green) before a wave 3 becomes likely.
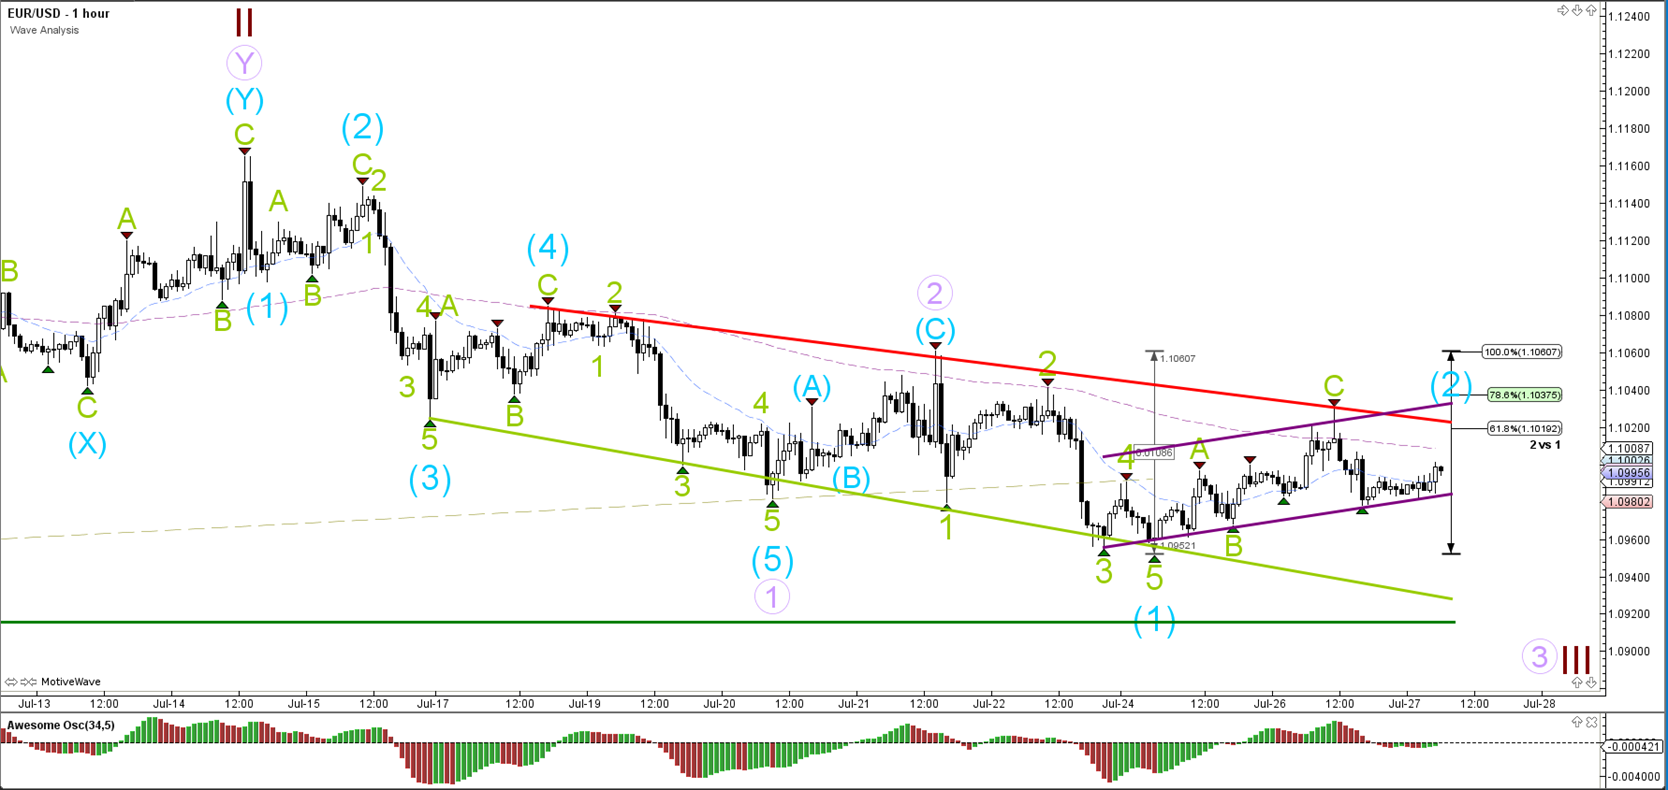
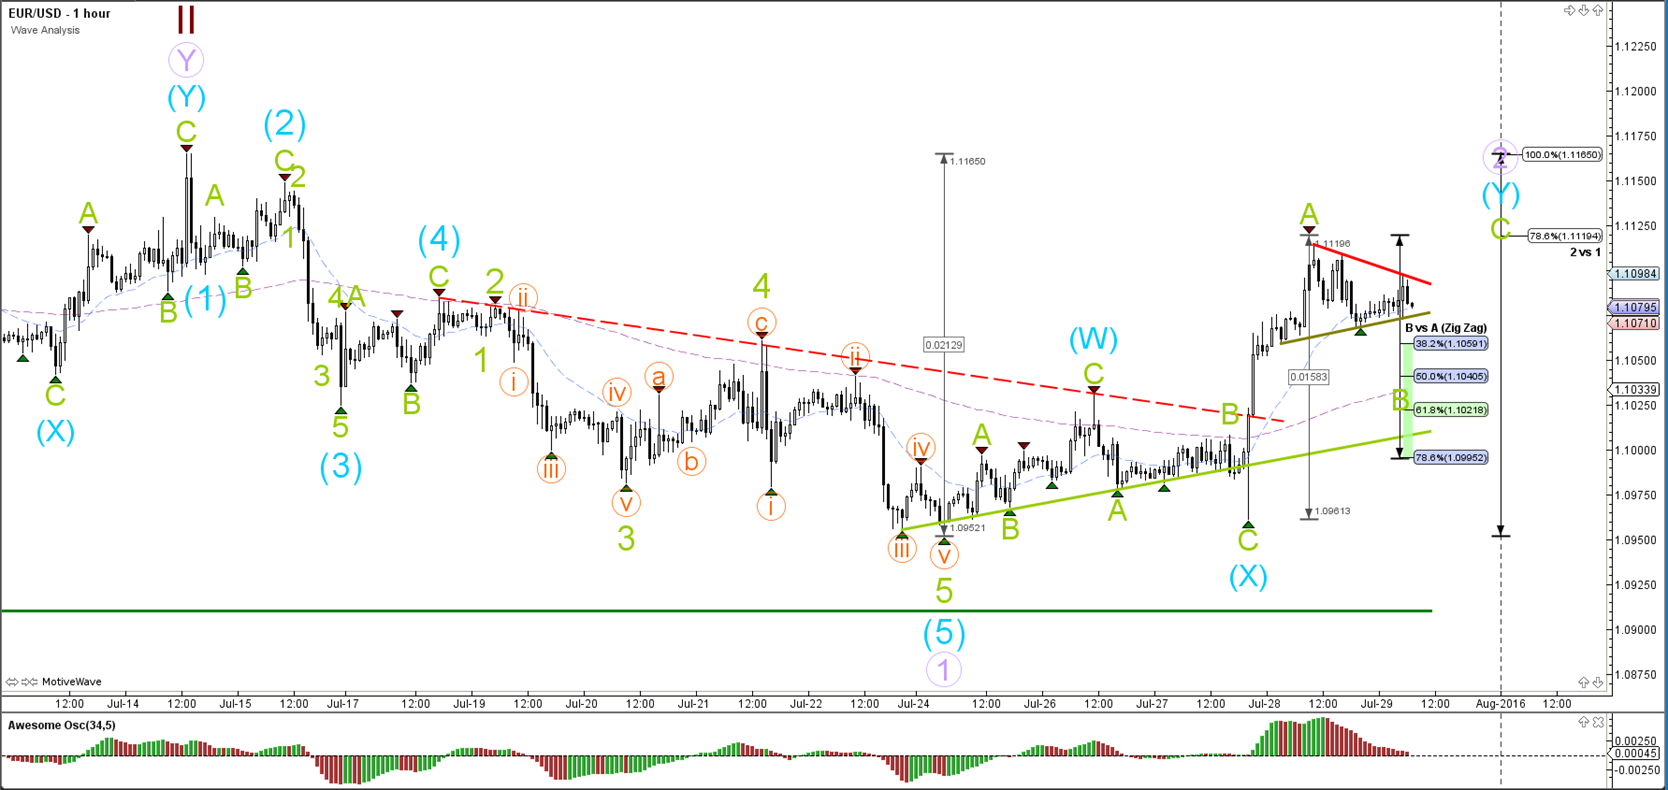
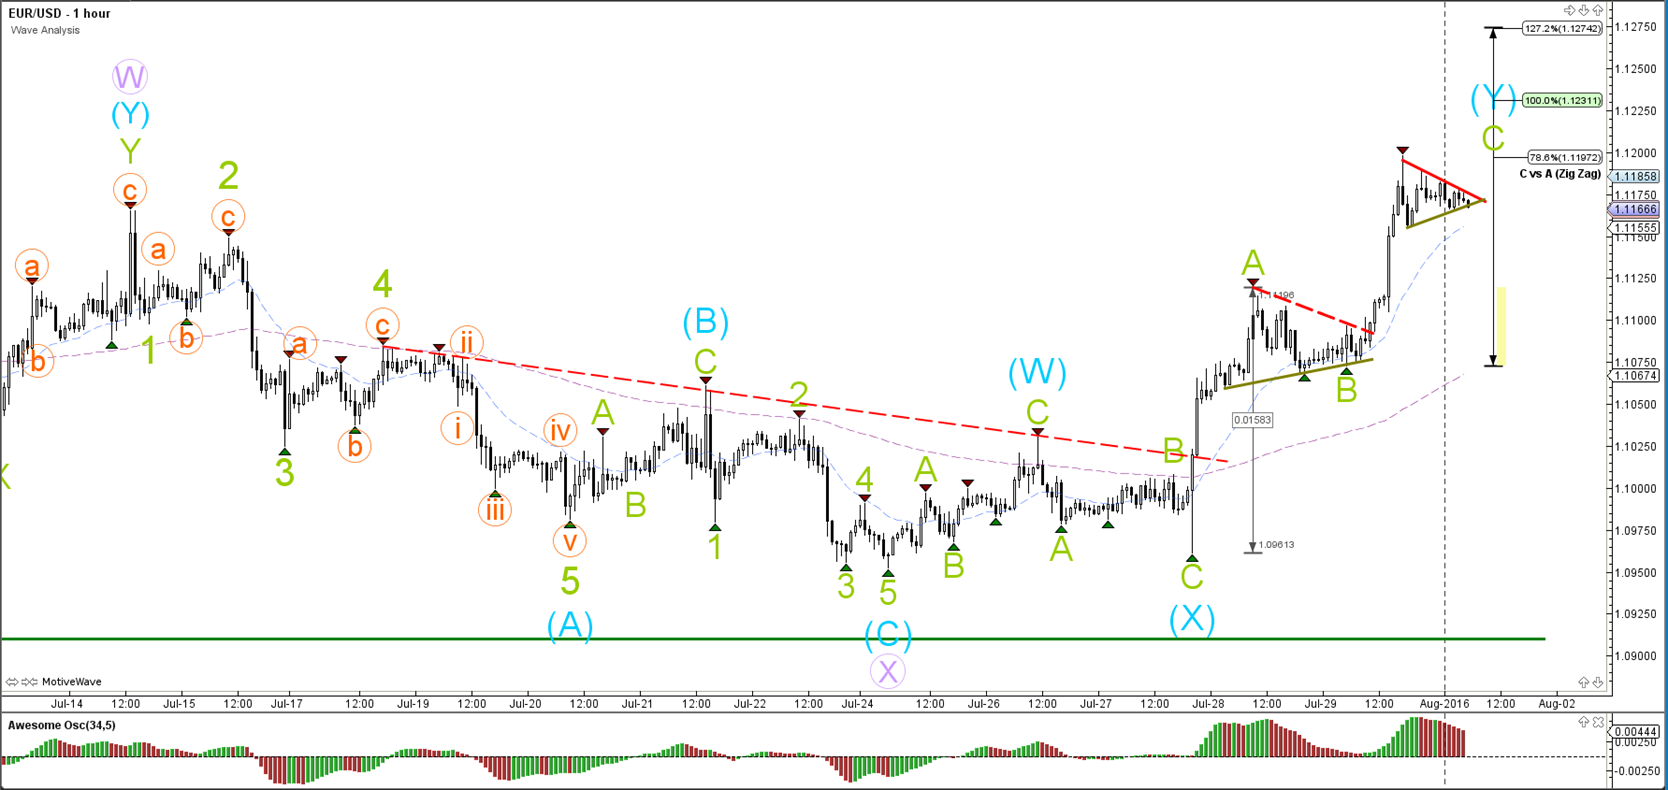
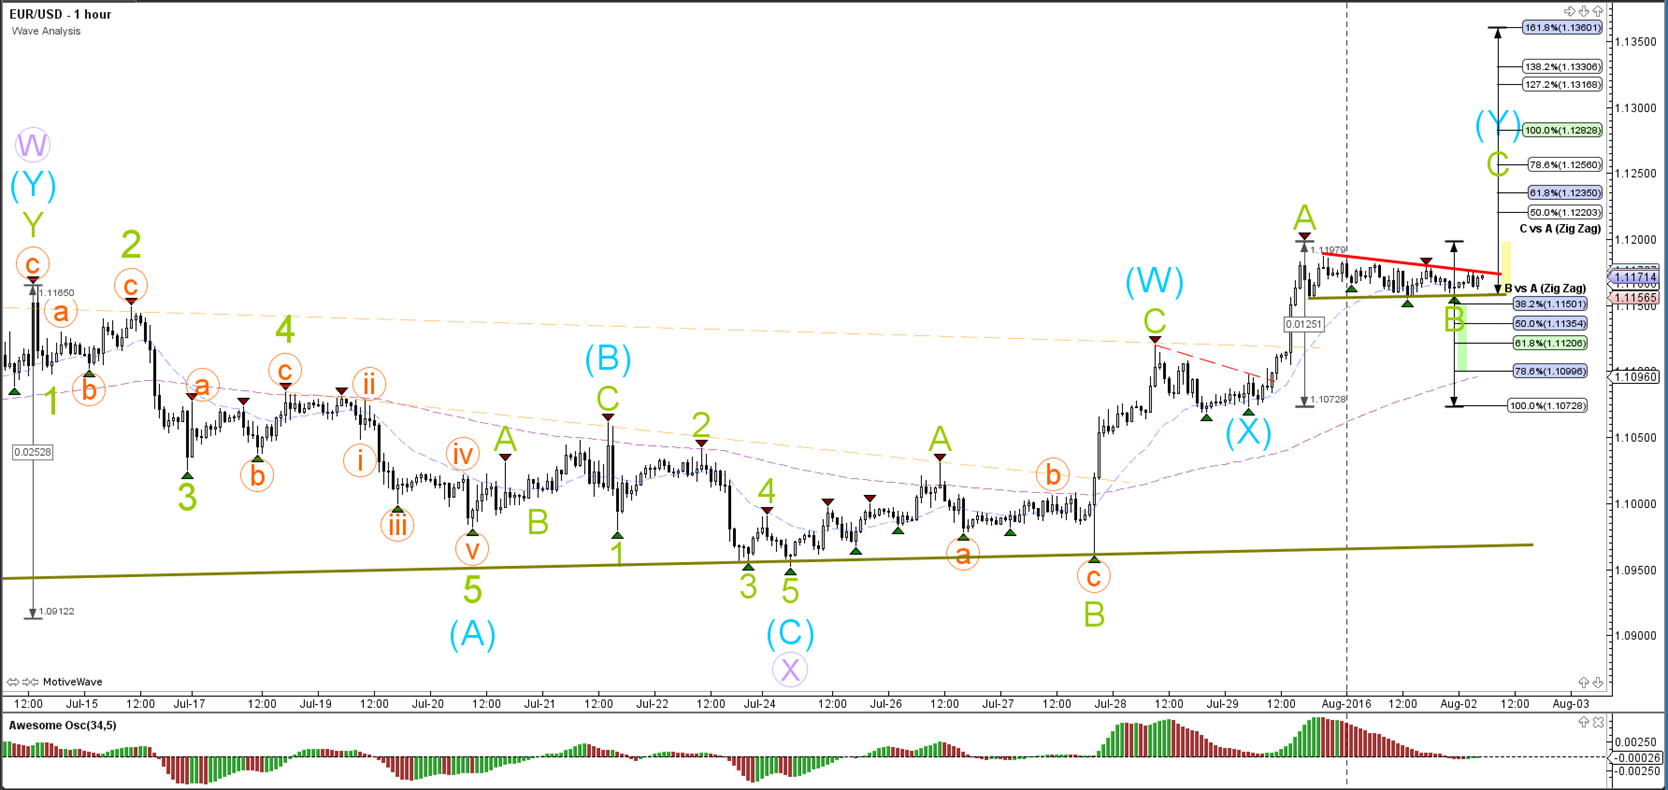
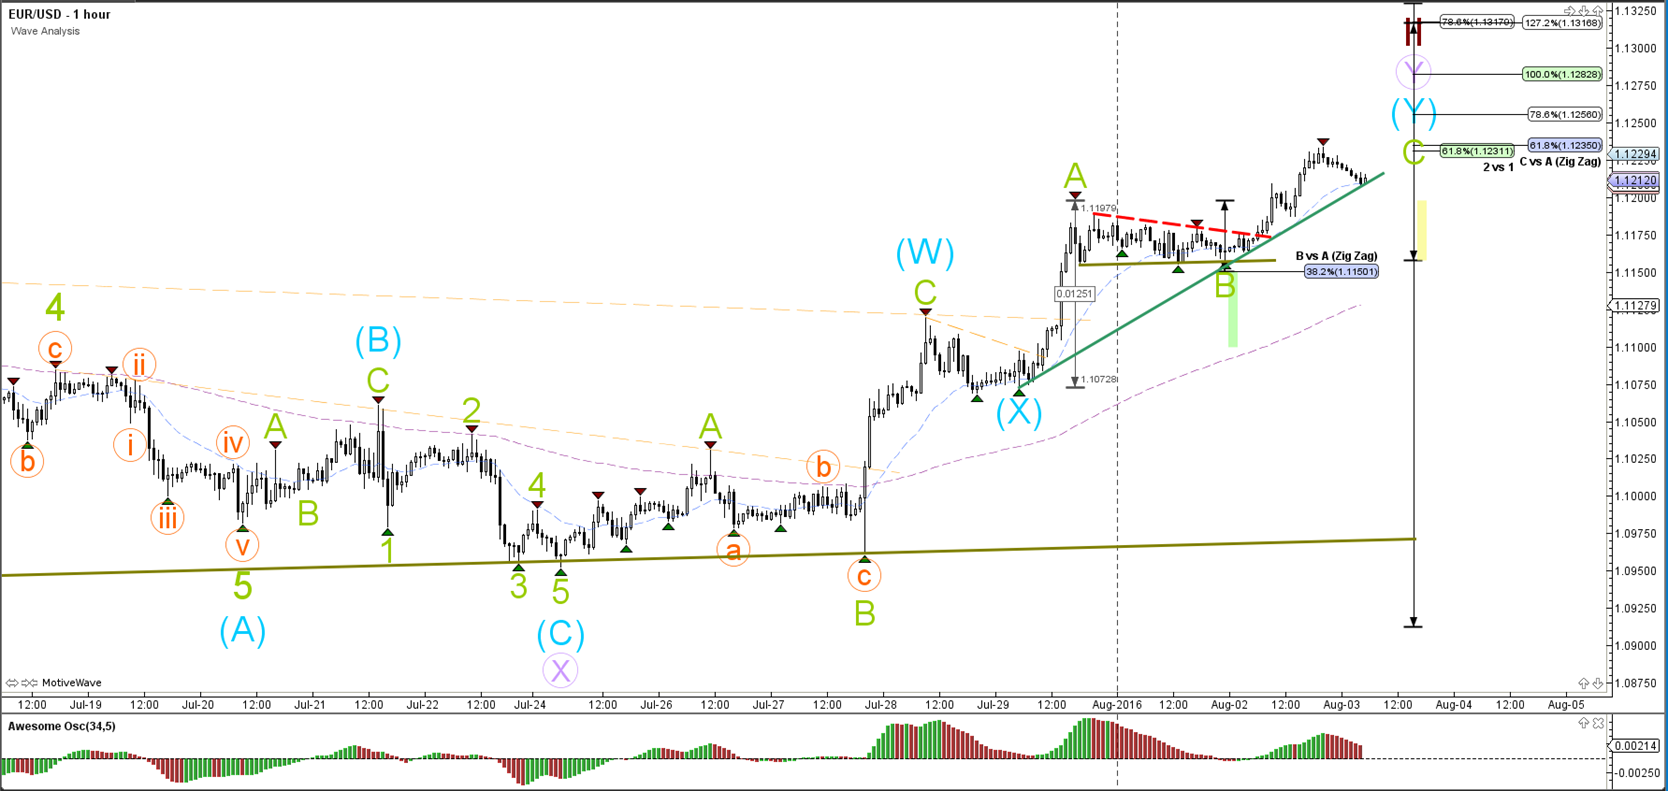
1 hour

The EUR/USD is building a bear flag chat pattern (purple). A bearish breakout could indicate the completion of wave 2 (blue). A bullish break above resistance (red) could be limited in its movement due to the Fibonacci levels of wave 2 (blue).
GBP/USD
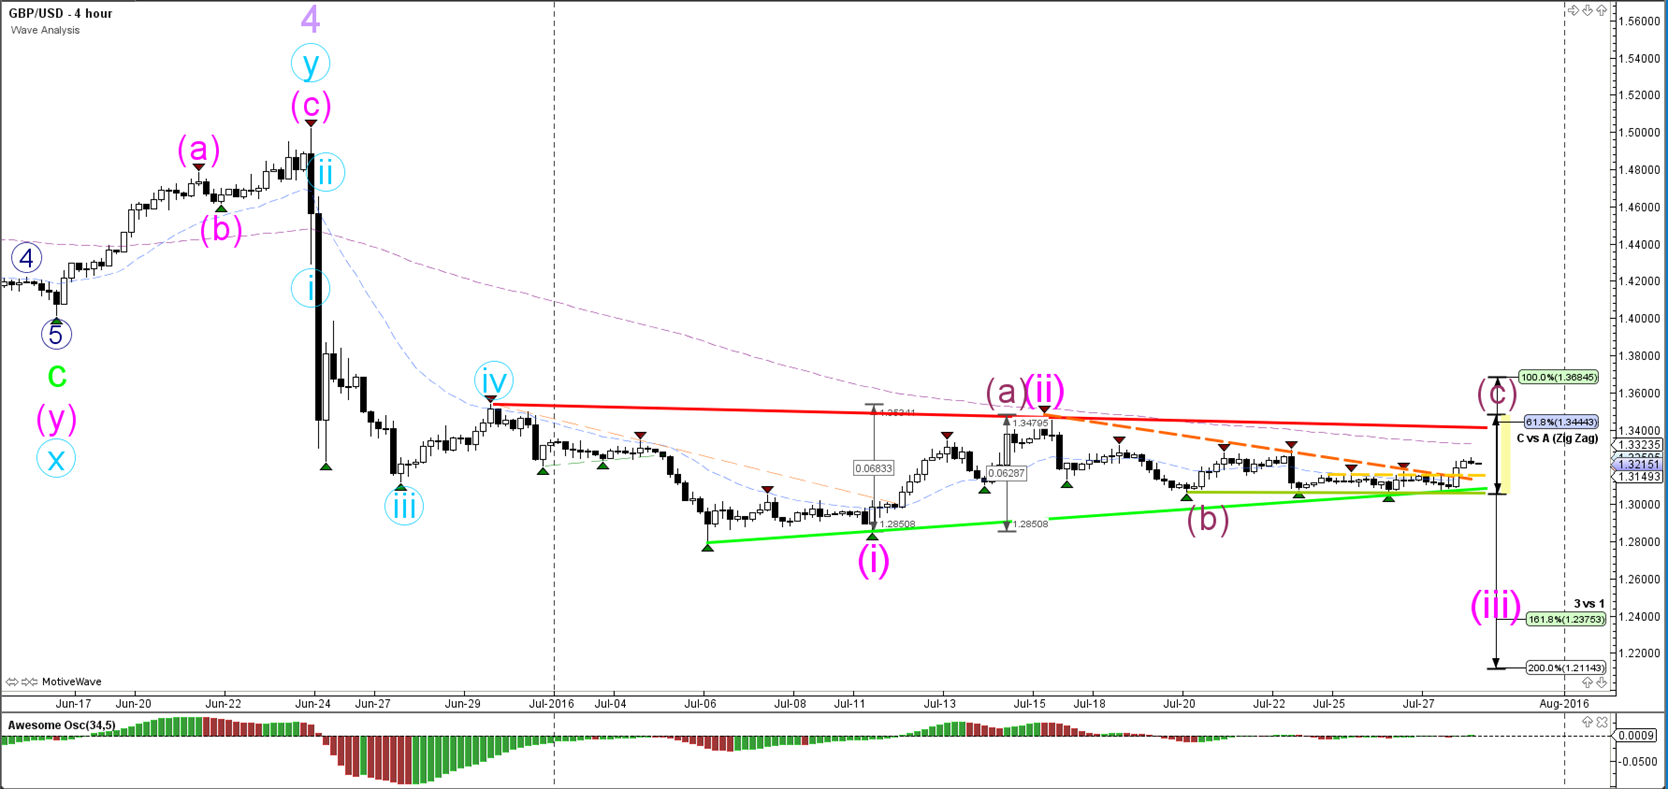
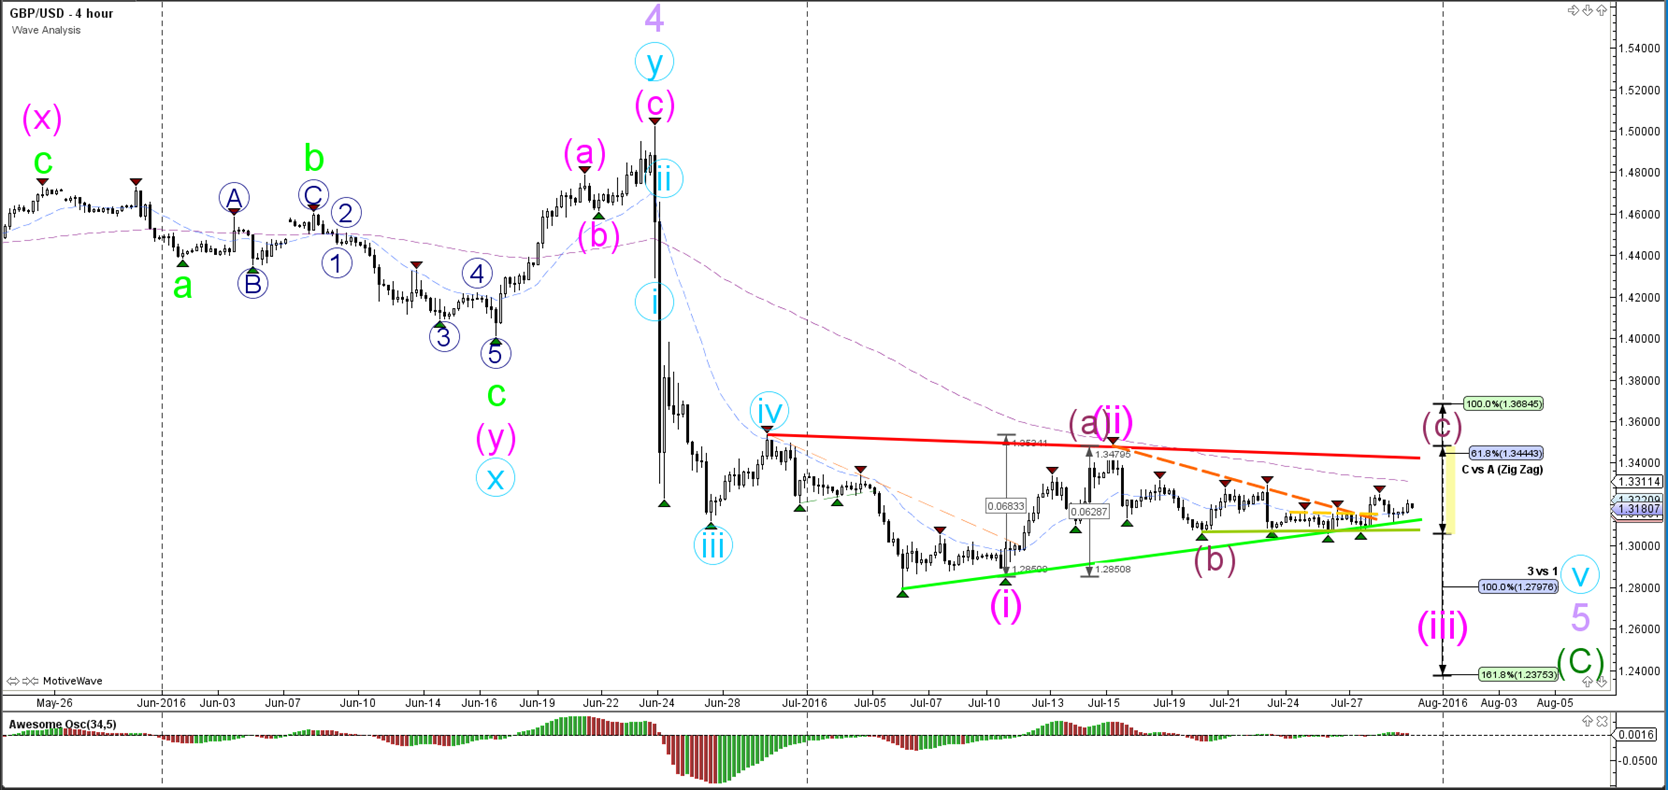
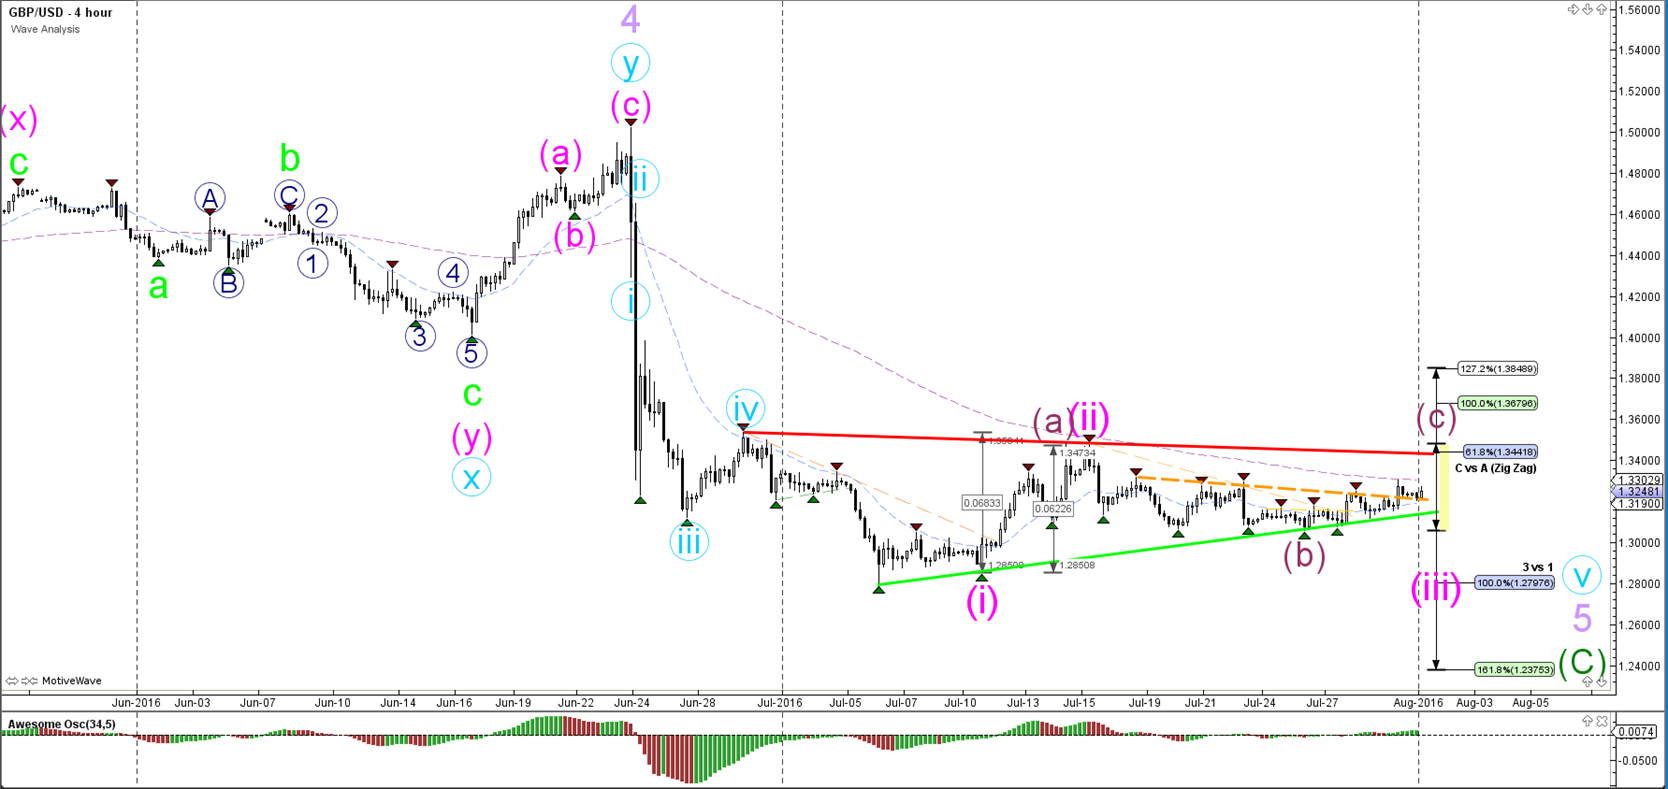
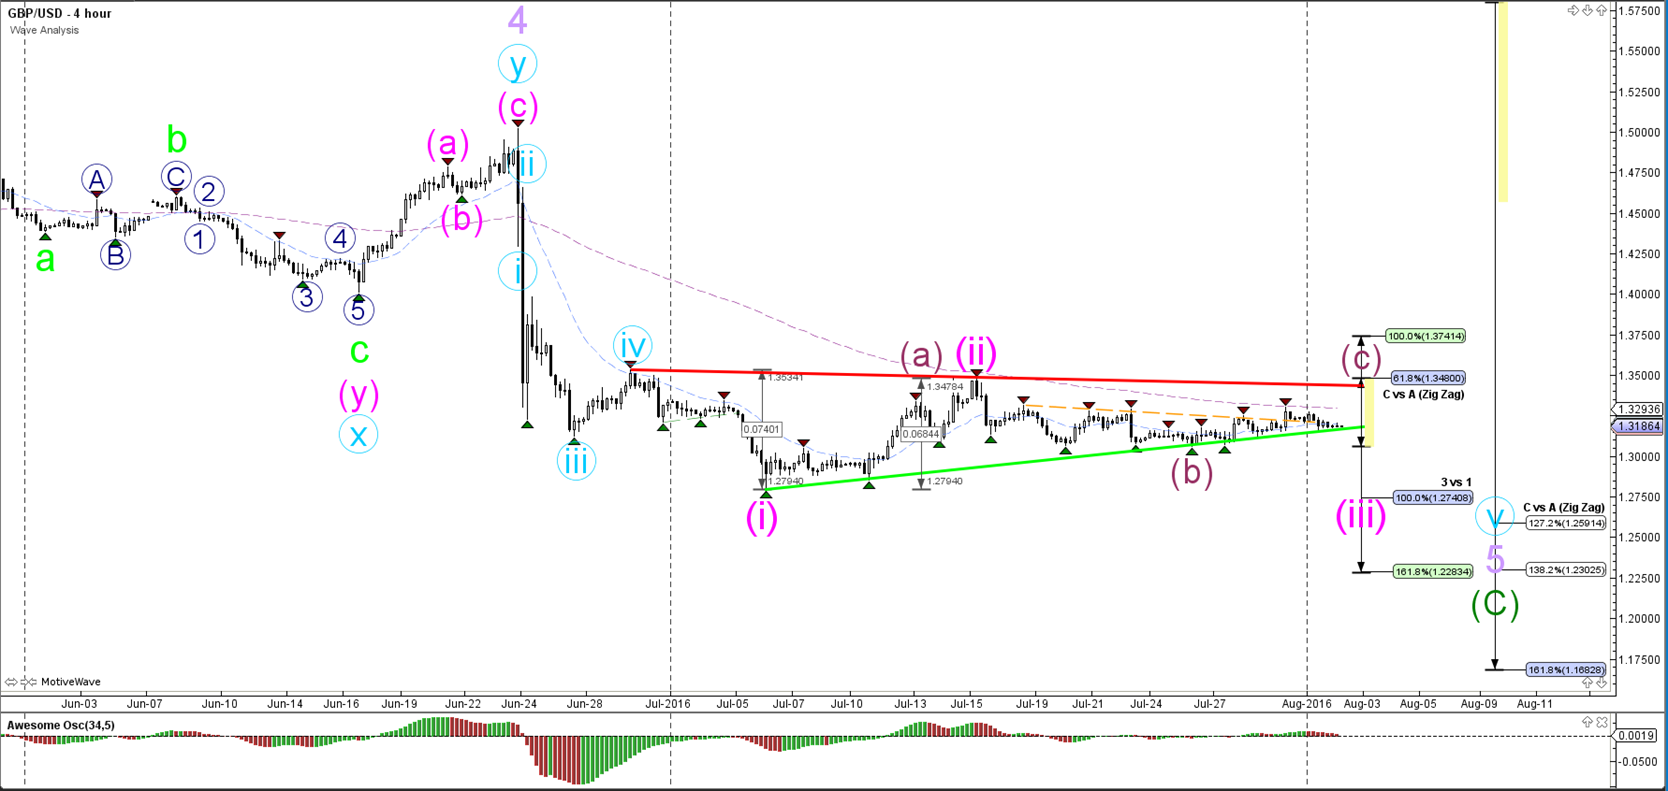
4 hour
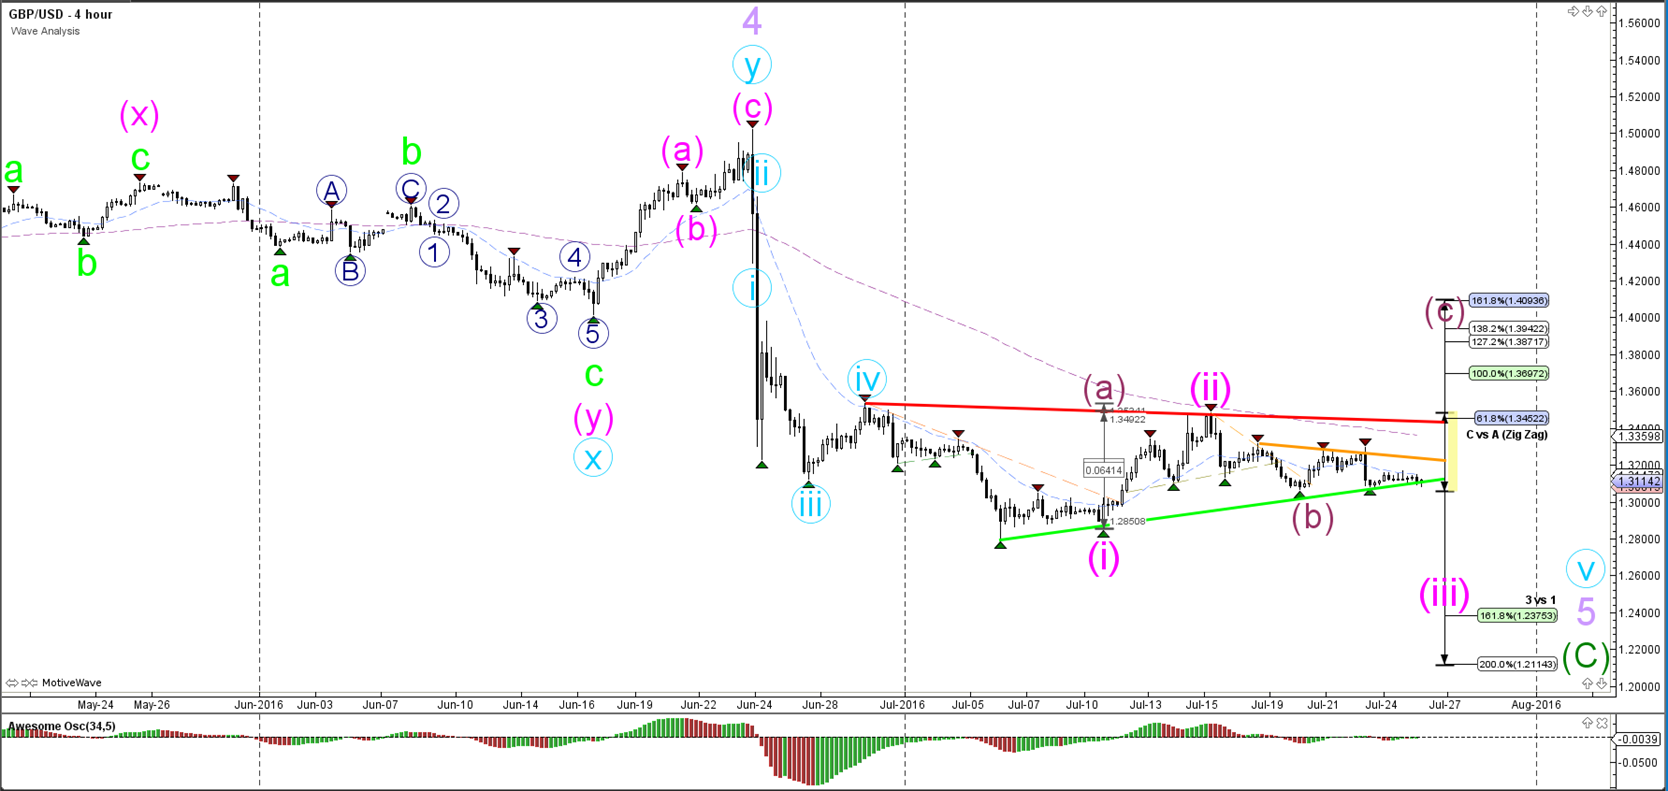
The GBP/USD is still in a triangle chart pattern (green/red). Whether the Cable is bullish or bearish will depend on the direction of the breakout. Price is either in a bearish 123 (pink) or in a bigger ABC retracement (purple).
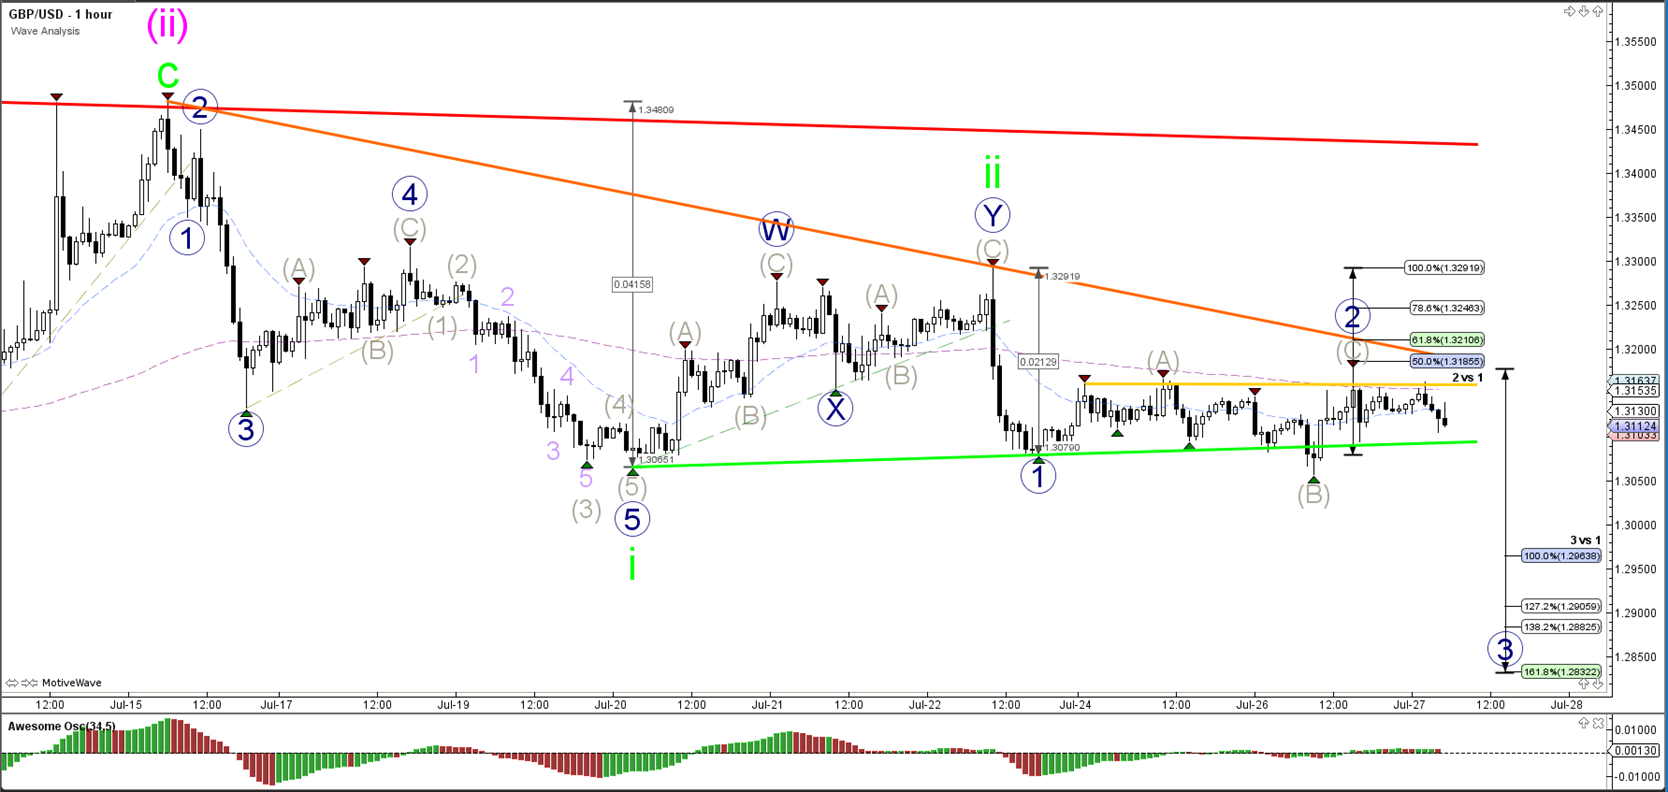
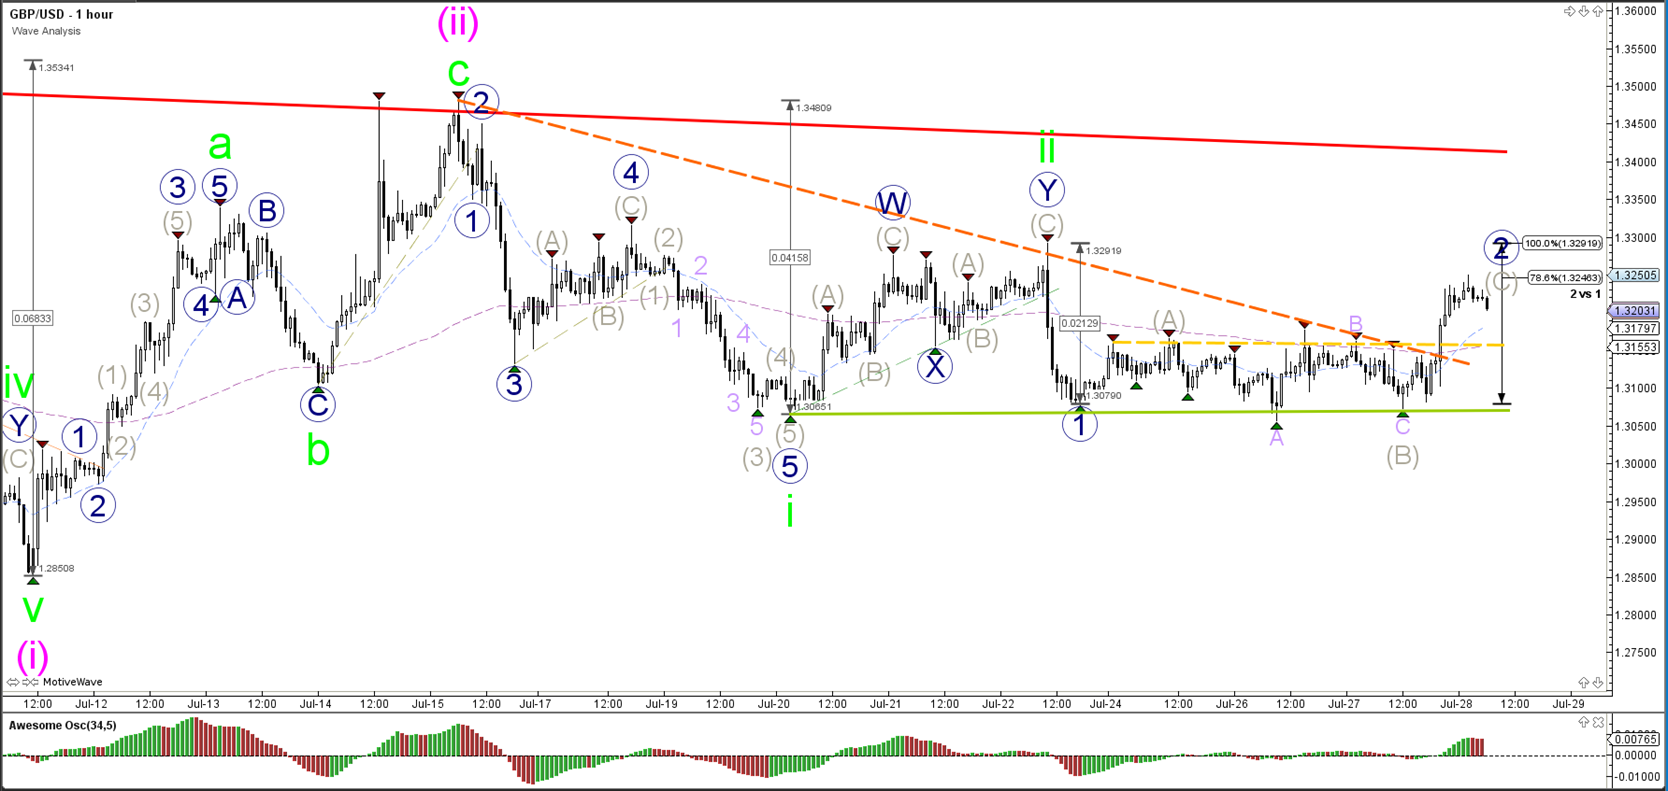
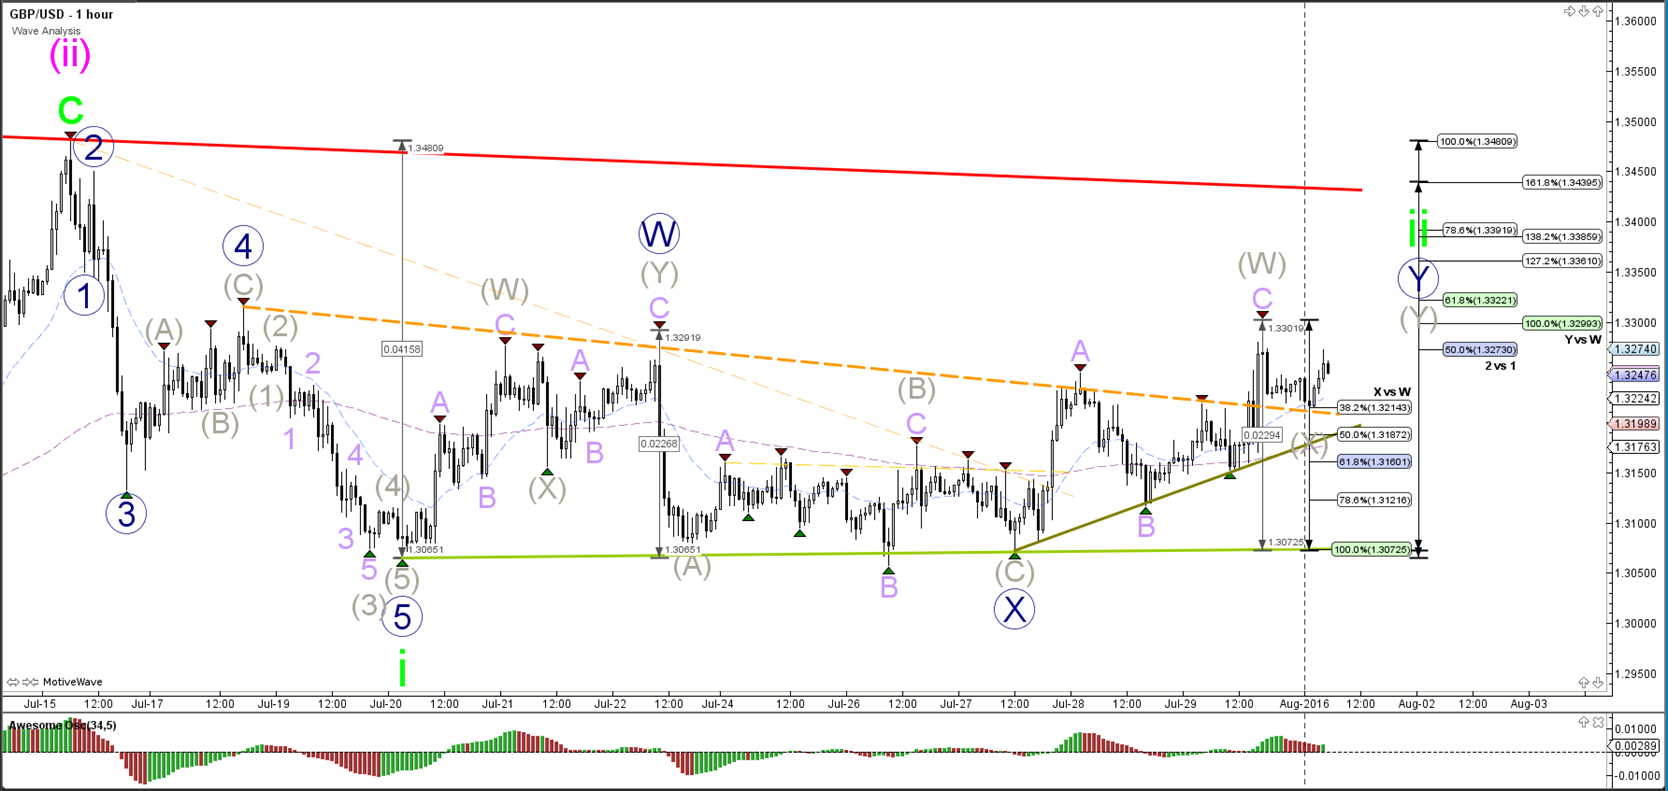
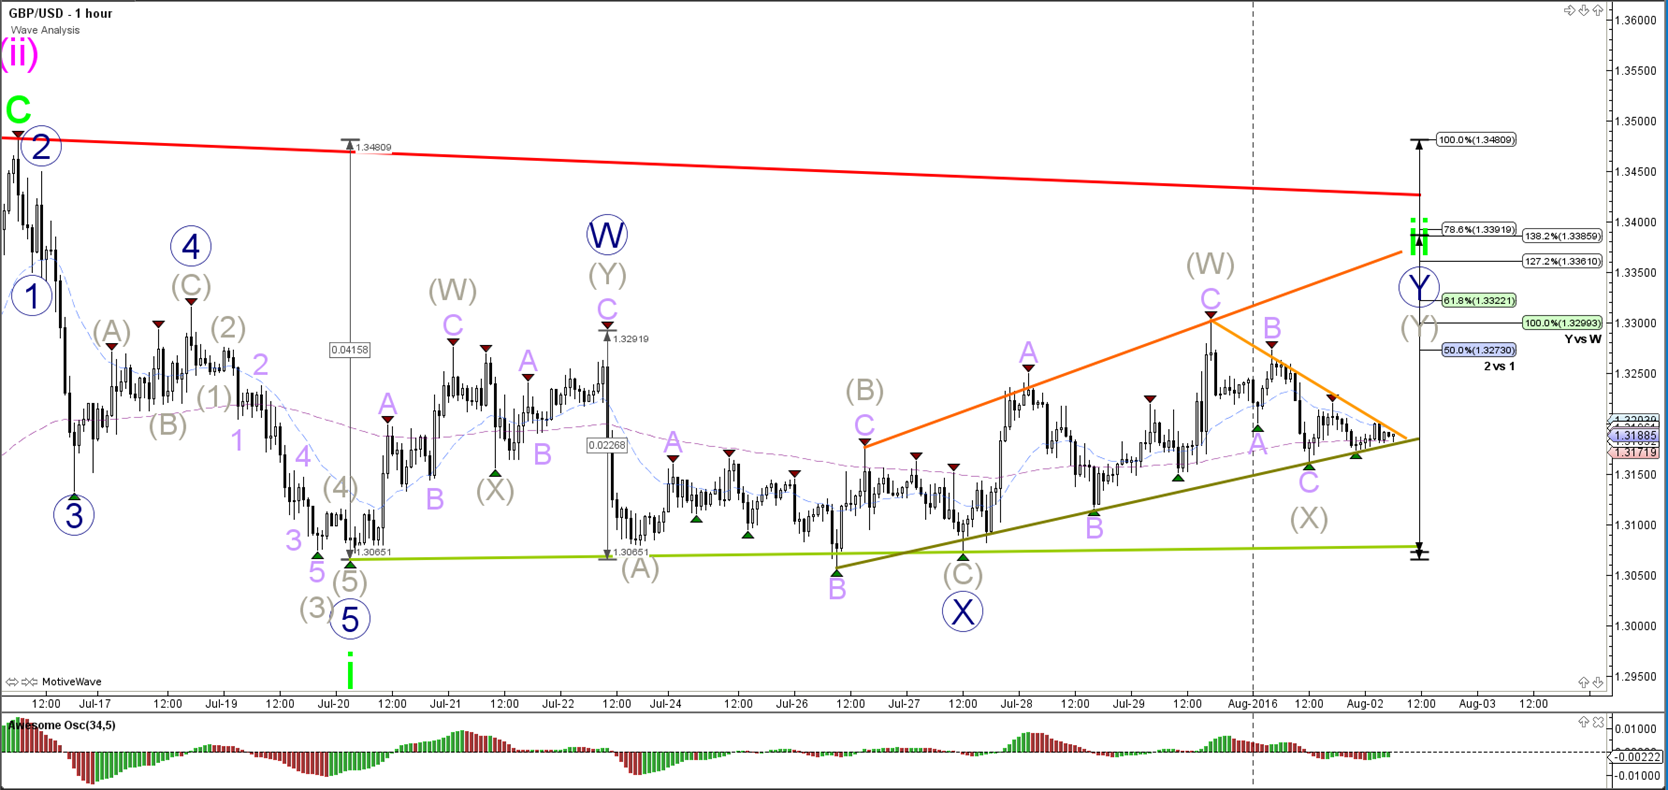
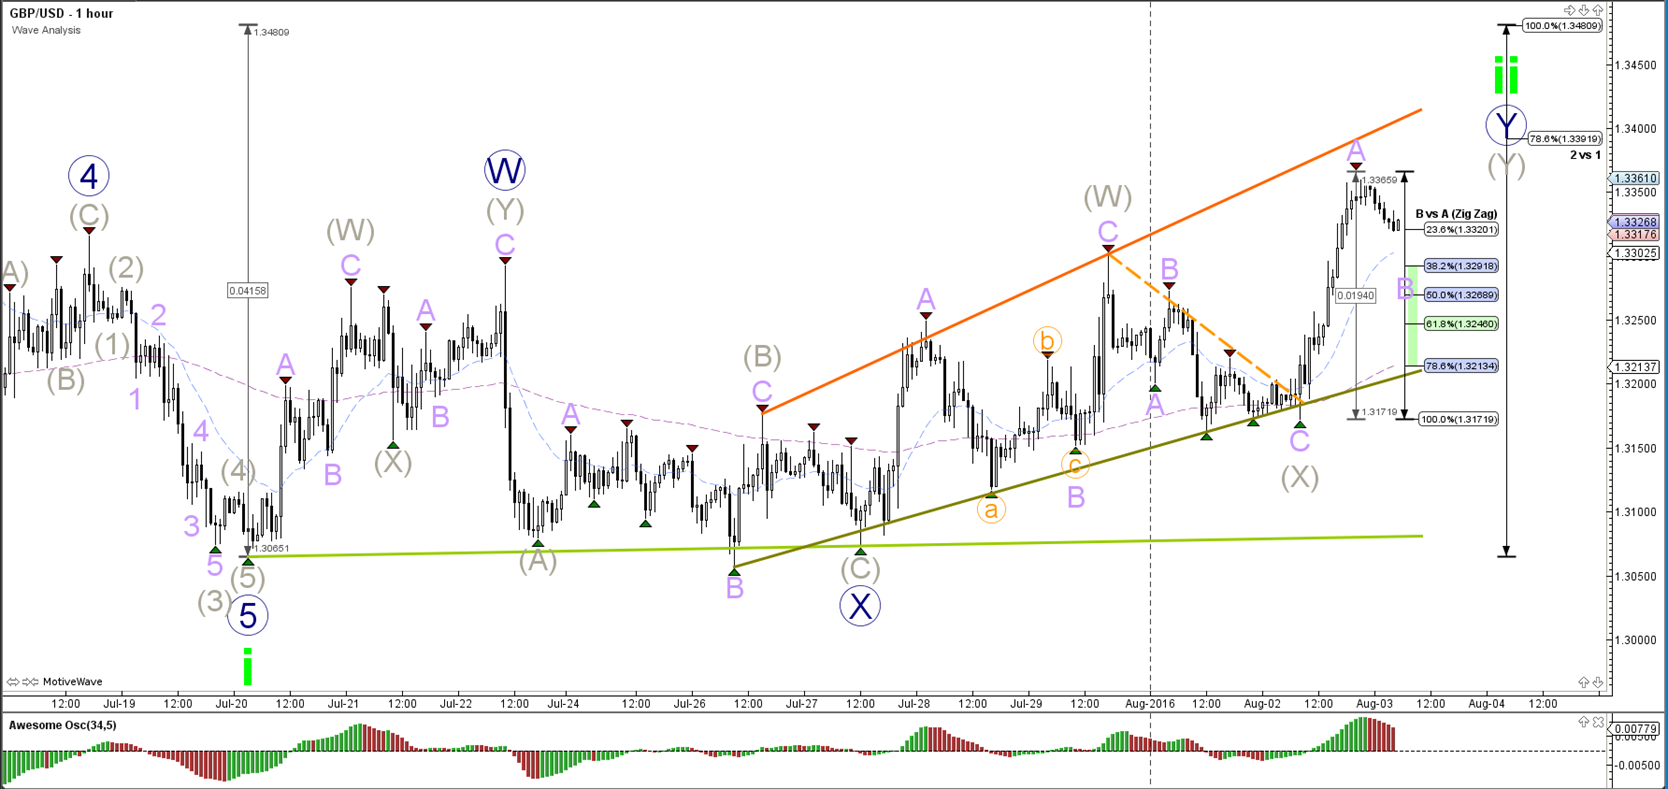
1 hour

The GBP/USD is building a triangle (orange / green lines). A break below the support trend line is needed before a wave 3 (blue) could be expected. A break above the 100% Fibonacci level invalidates wave 2 (blue). The Fibonacci levels should act as resistance.
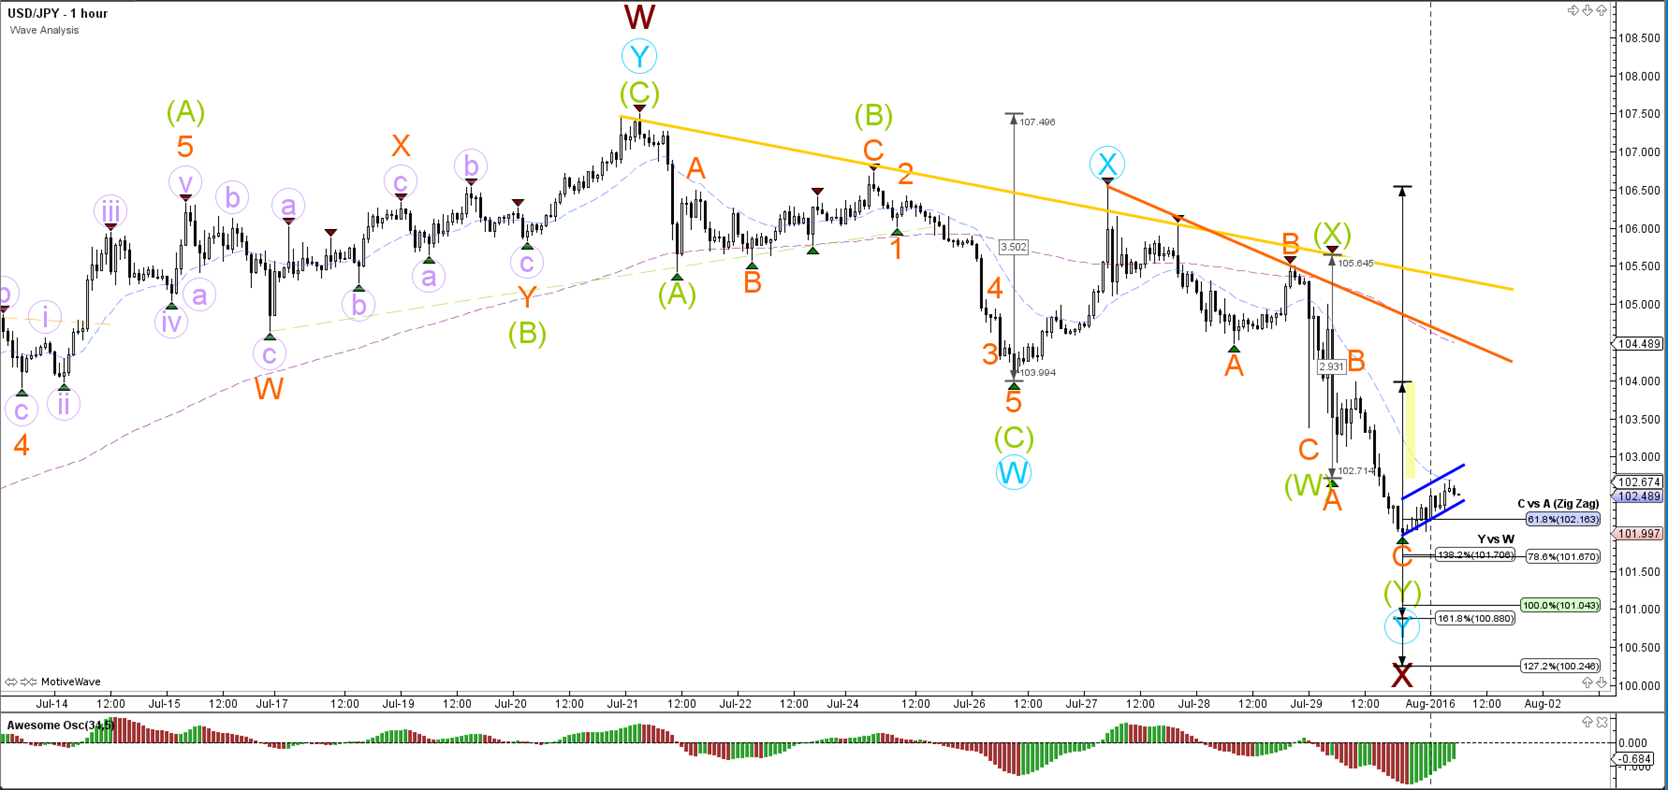
USD/JPY
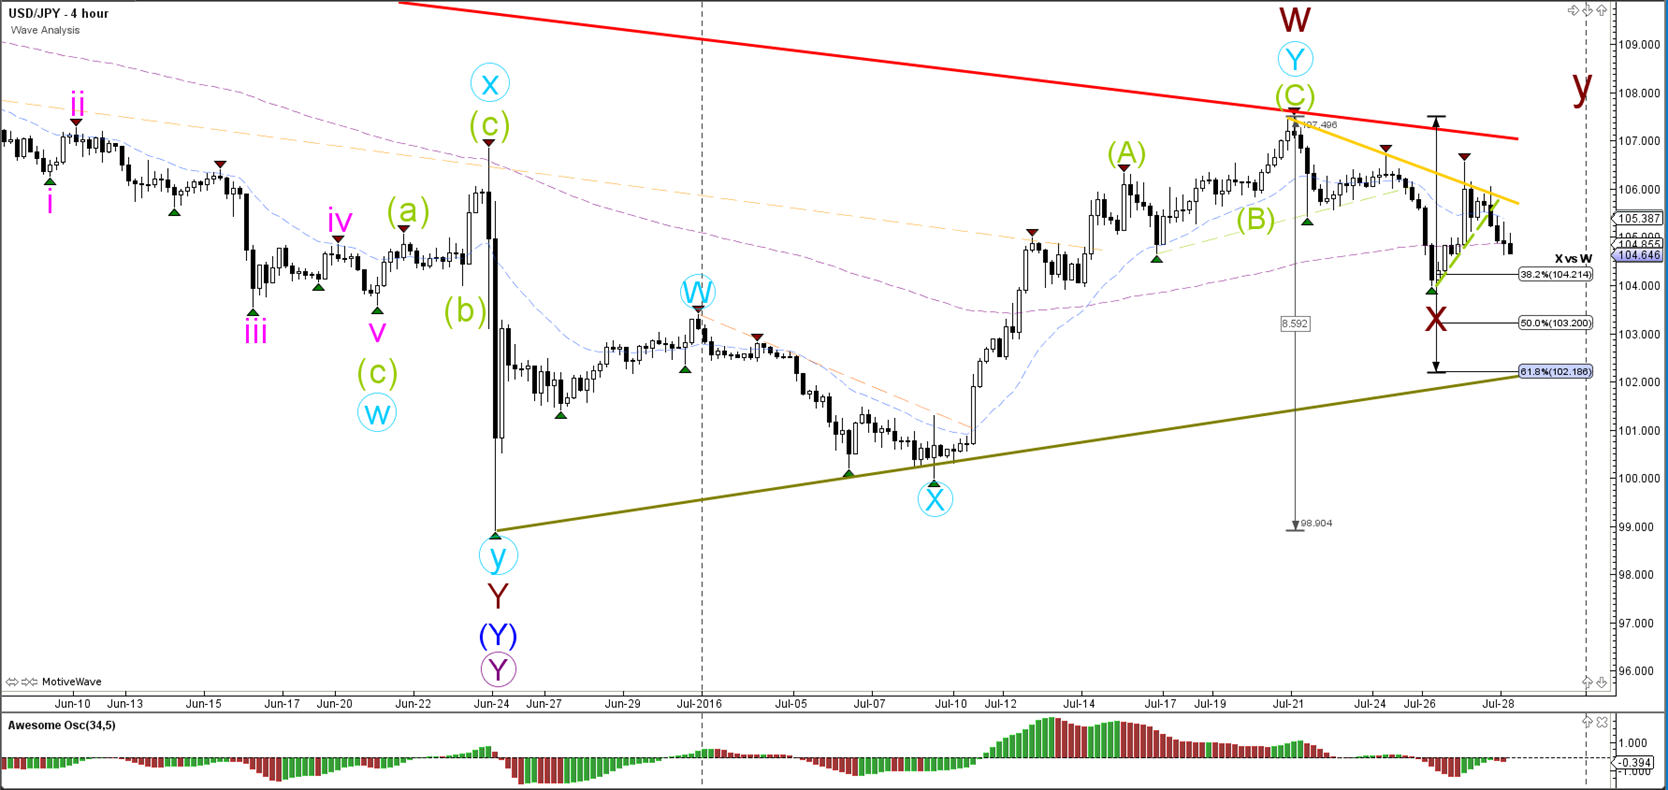
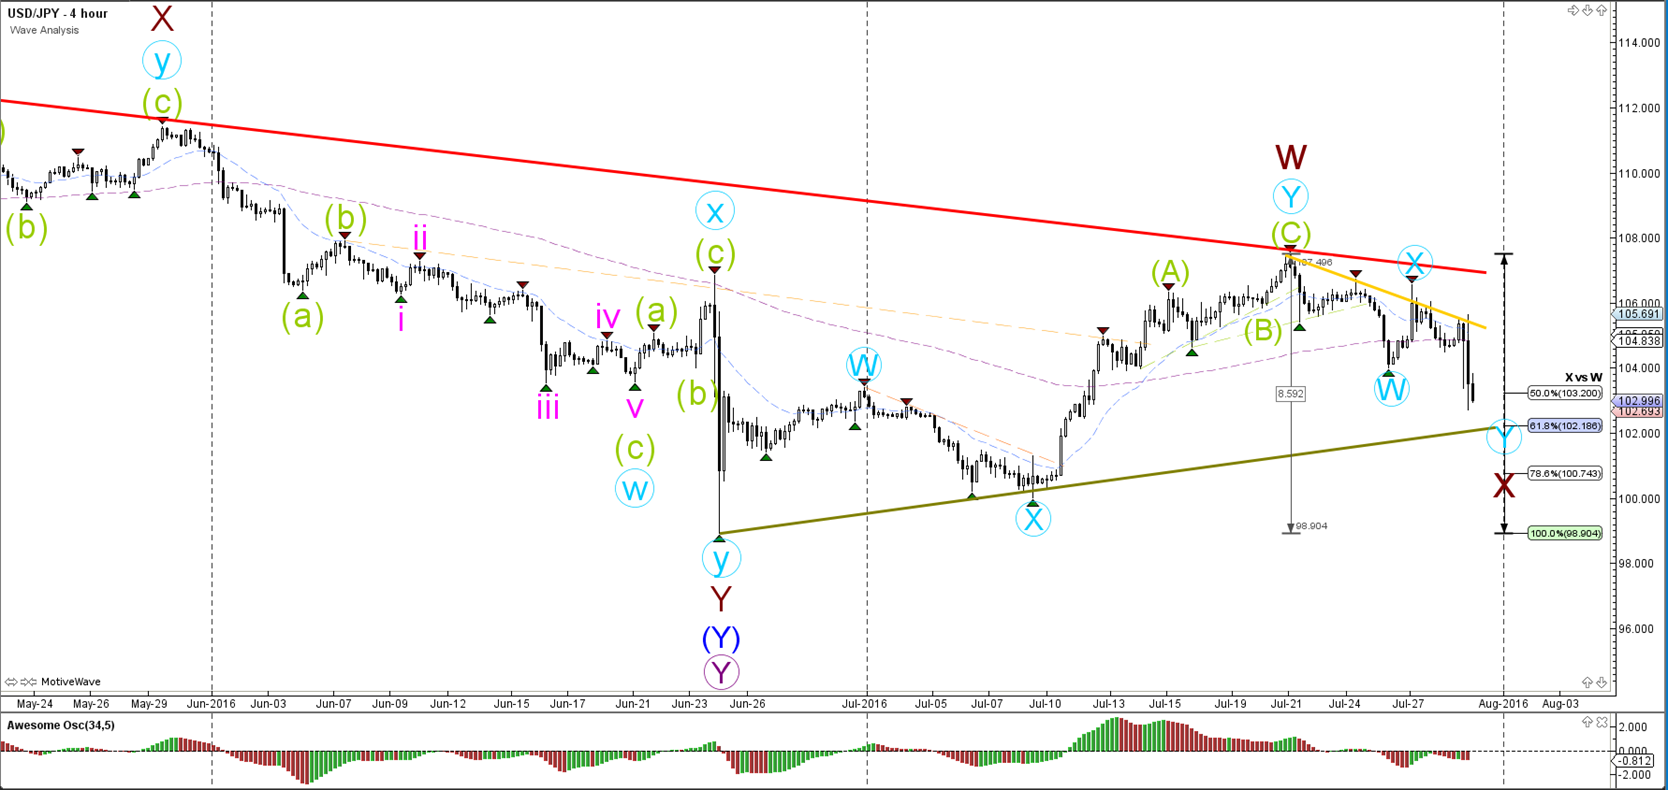
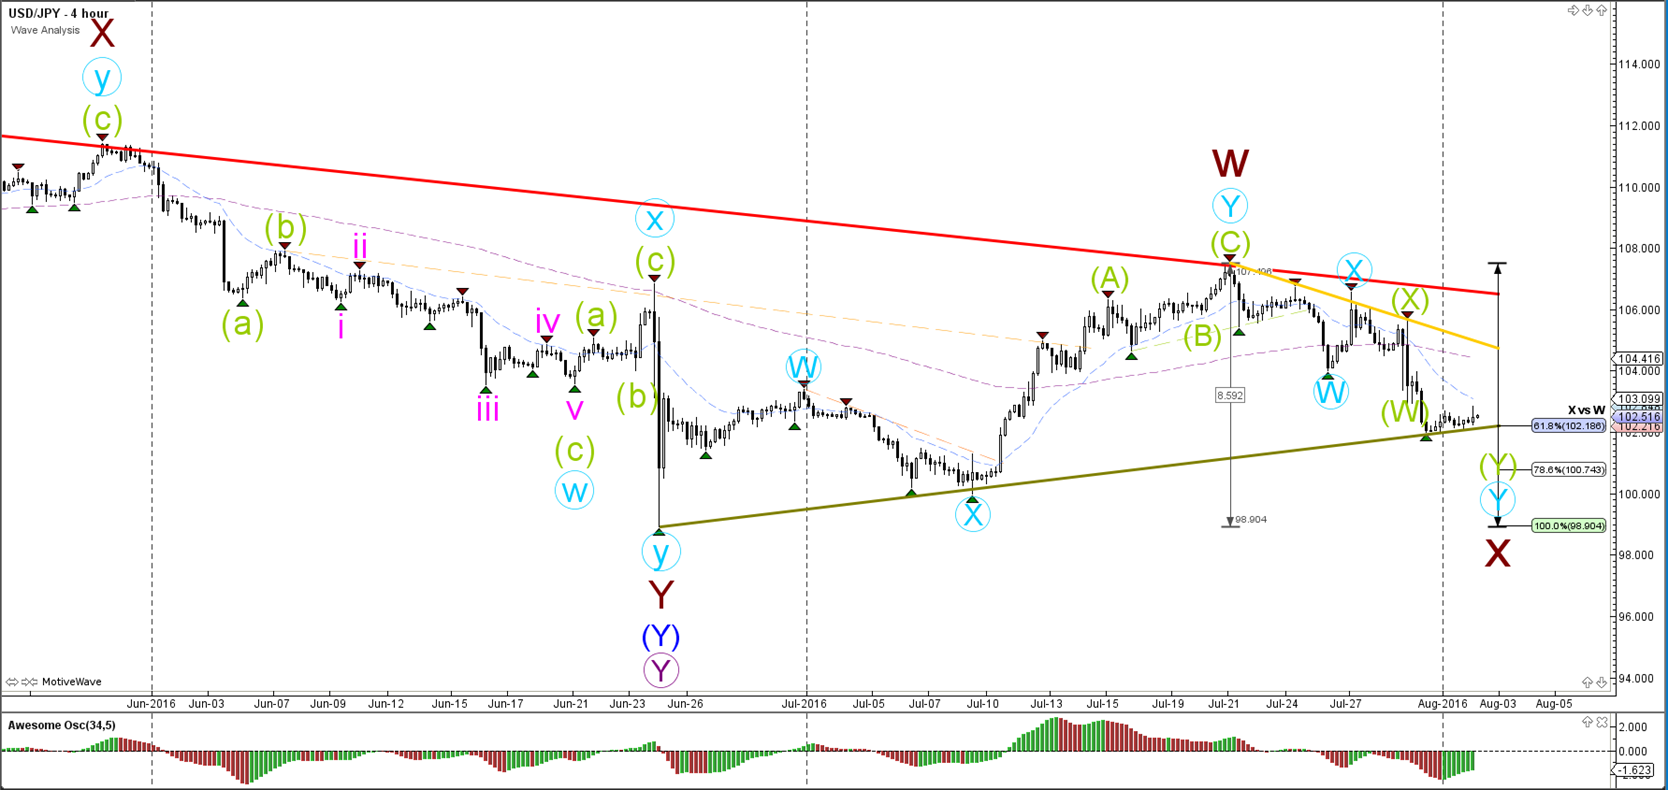
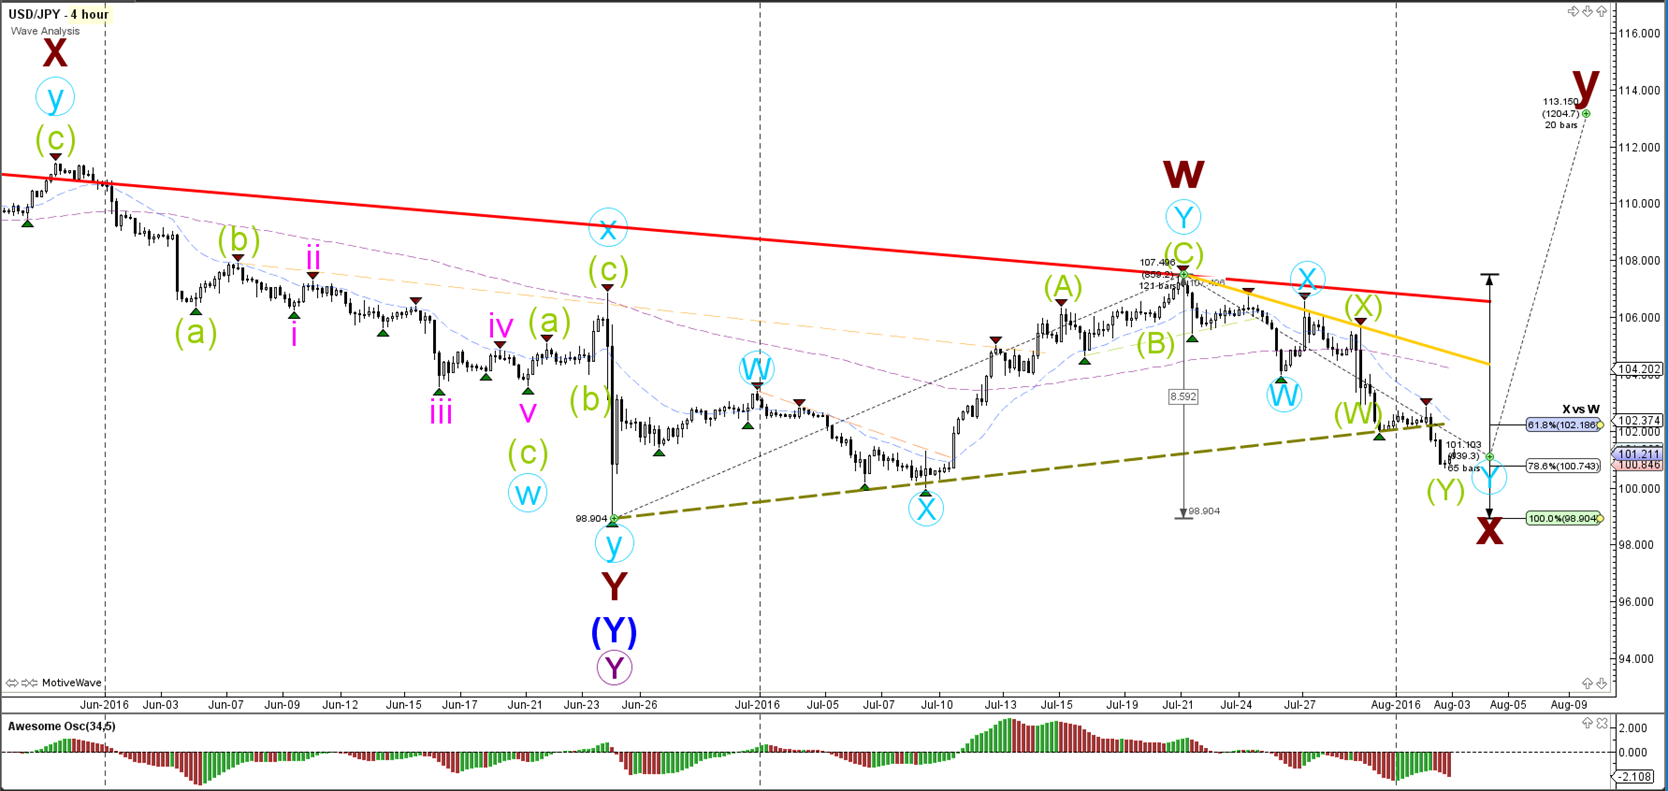
4 hour
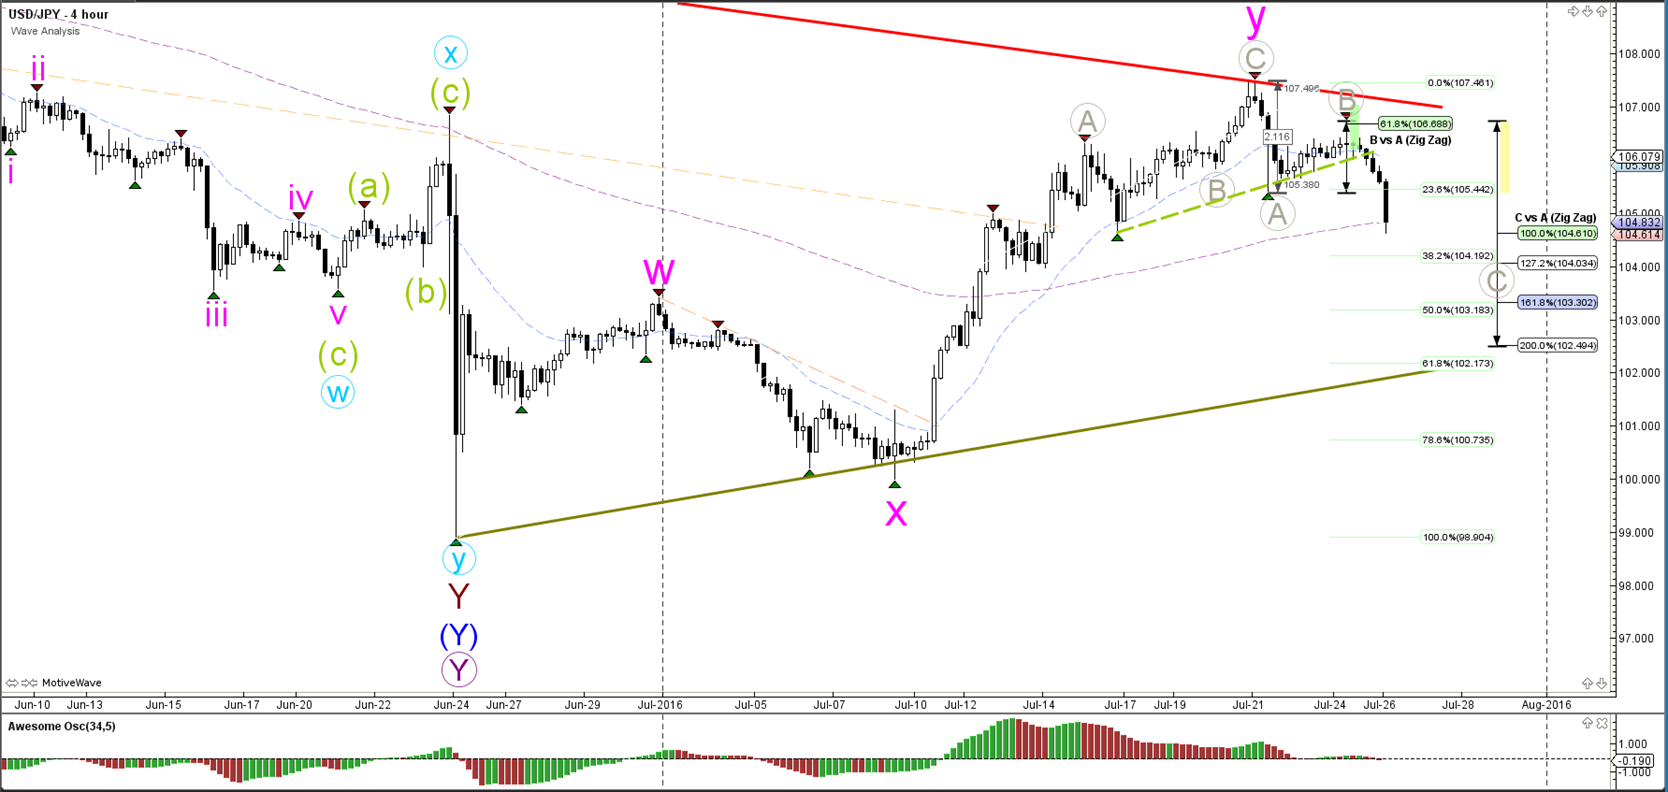
The USD/JPY is respected the resistance trend line (red) from the daily chart and broke the smaller support trend line (green). Price is now showing bearish momentum and heading towards the Fibonacci levels of wave C (grey) and the next support trend line (green).
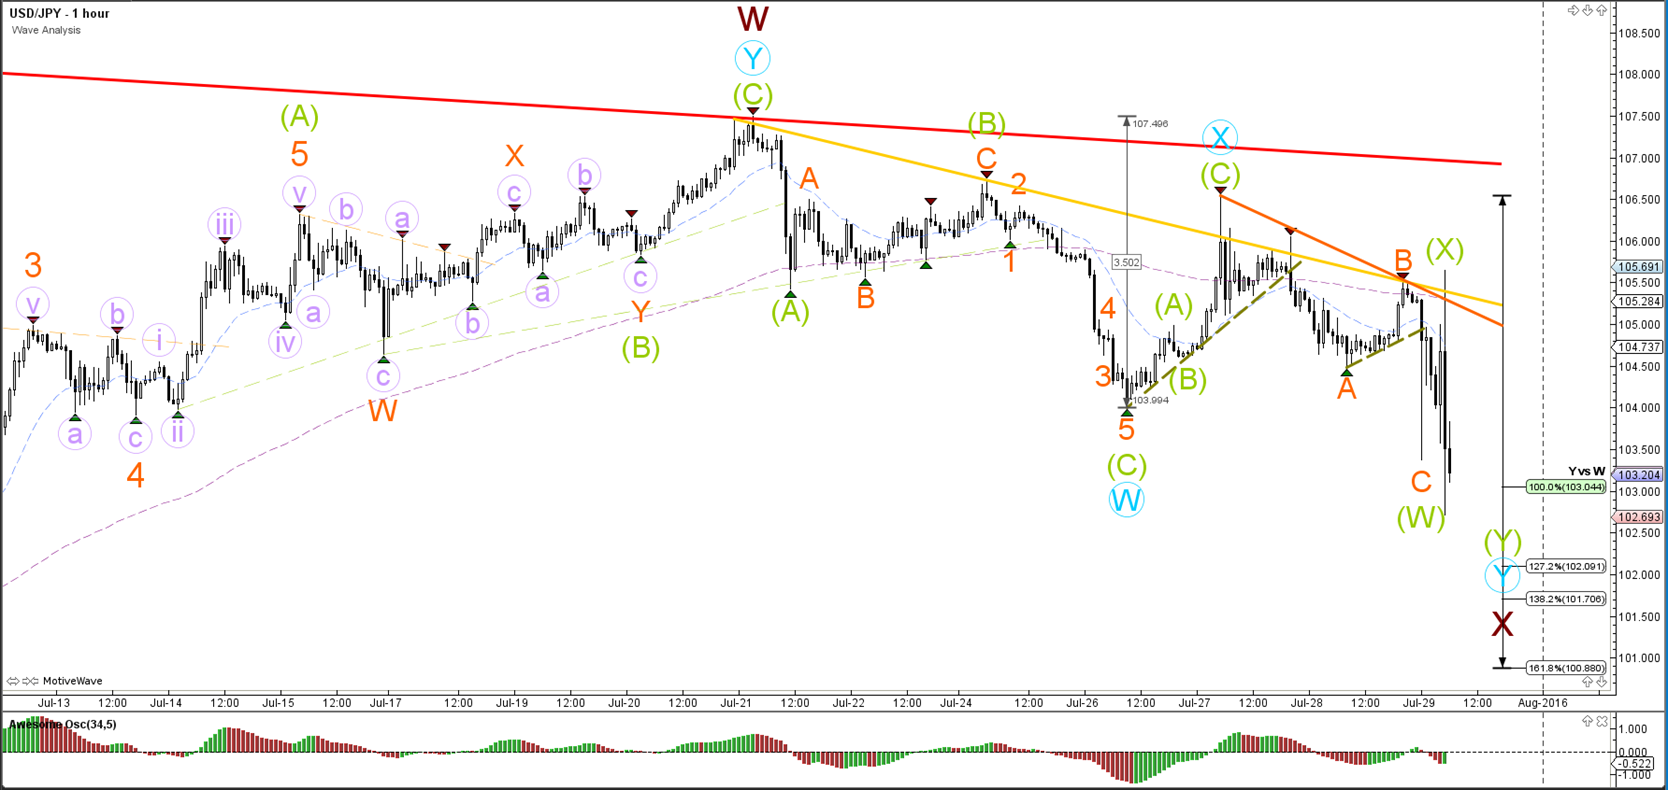
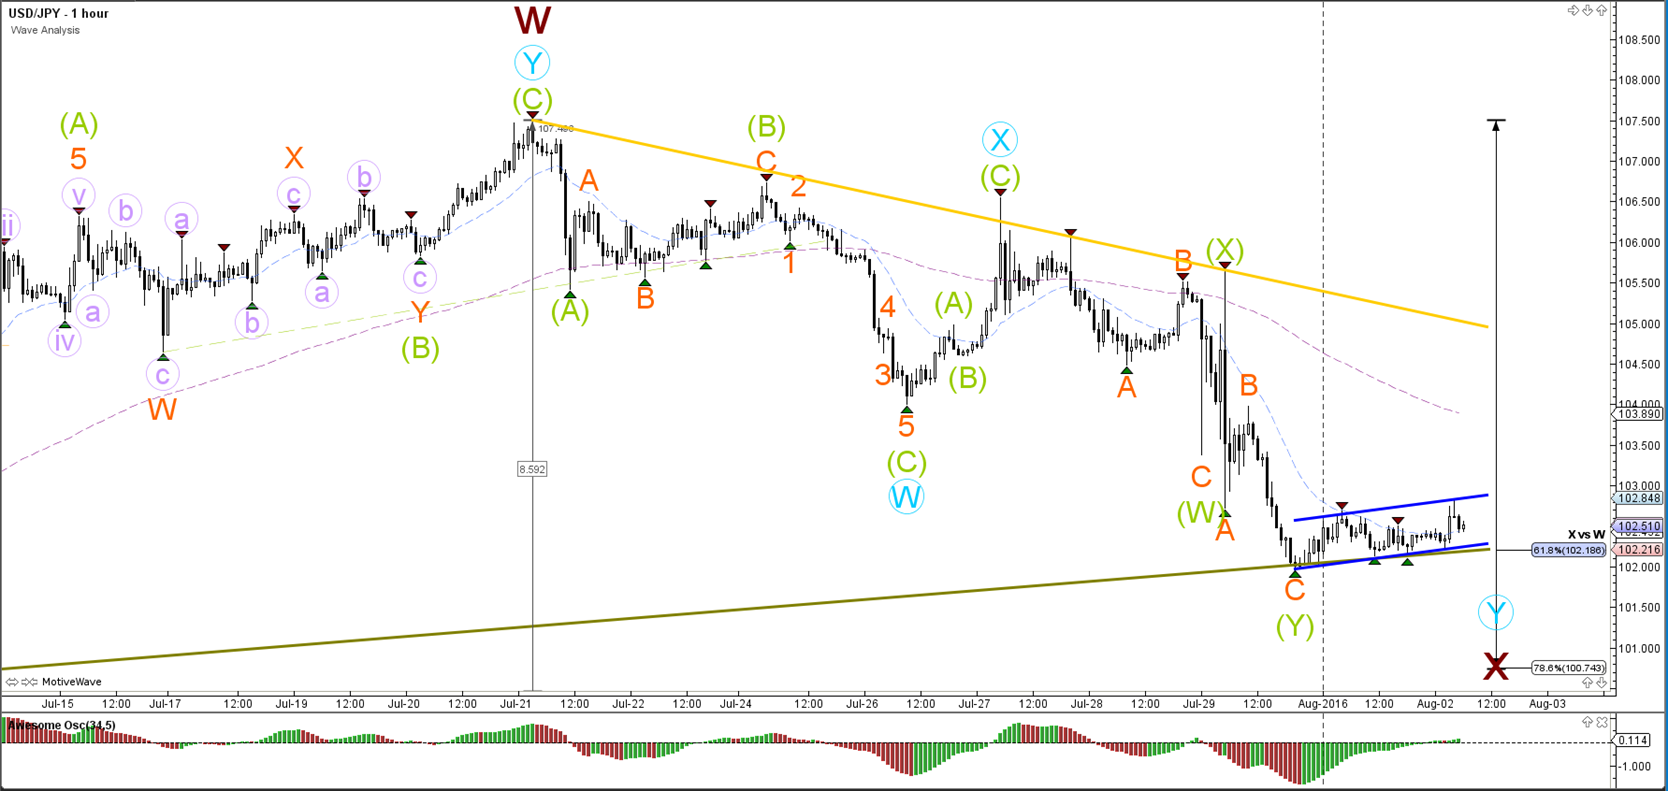
1 hour

The USD/JPY is showing impulse of a wave 3 (orange).
“Original analysis is provided by Admiral Markets”
EUR/USD
4 hour

The EUR/USD is building a downtrend with lower lows and lower highs but price has not been able to break the bottom of wave 1 (brown) as yet. Price needs to break below the wave 1 bottom support (green) before a wave 3 becomes likely.
1 hour
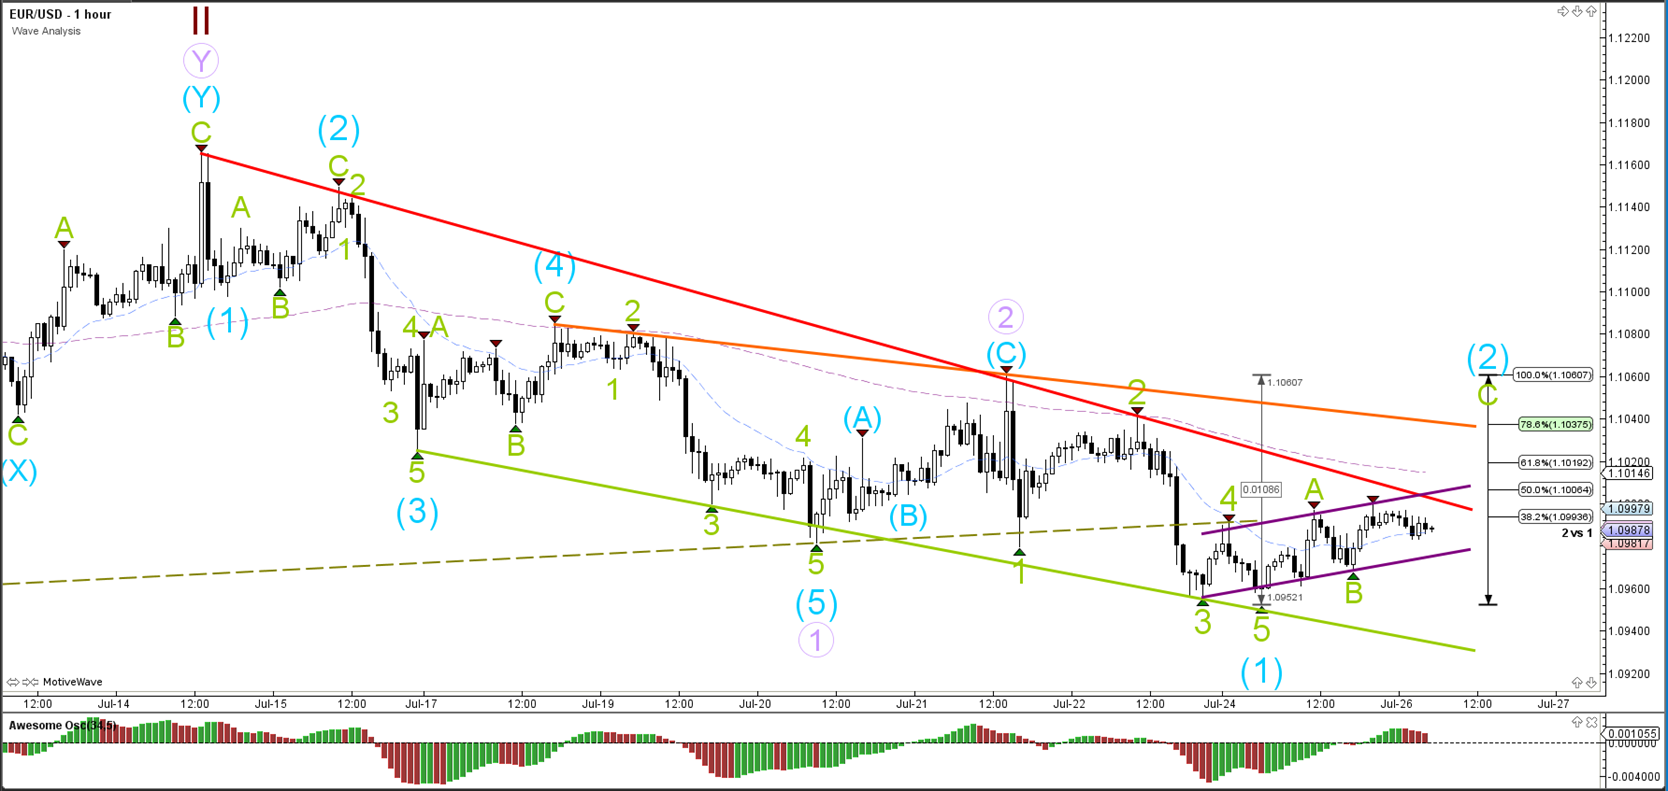
The EUR/USD is building a bear flag chat pattern (purple). A bearish breakout could indicate the completion of wave 2 (blue). A bullish break above resistance (red) could be limited in its movement due to the Fibonacci levels of wave 2 (blue).
GBP/USD
4 hour

The GBP/USD is still in a triangle chart pattern (green/red). Whether the Cable is bullish or bearish will depend on the direction of the breakout. Price is either in a bearish 123 (pink) or in a bigger ABC retracement (purple).
1 hour
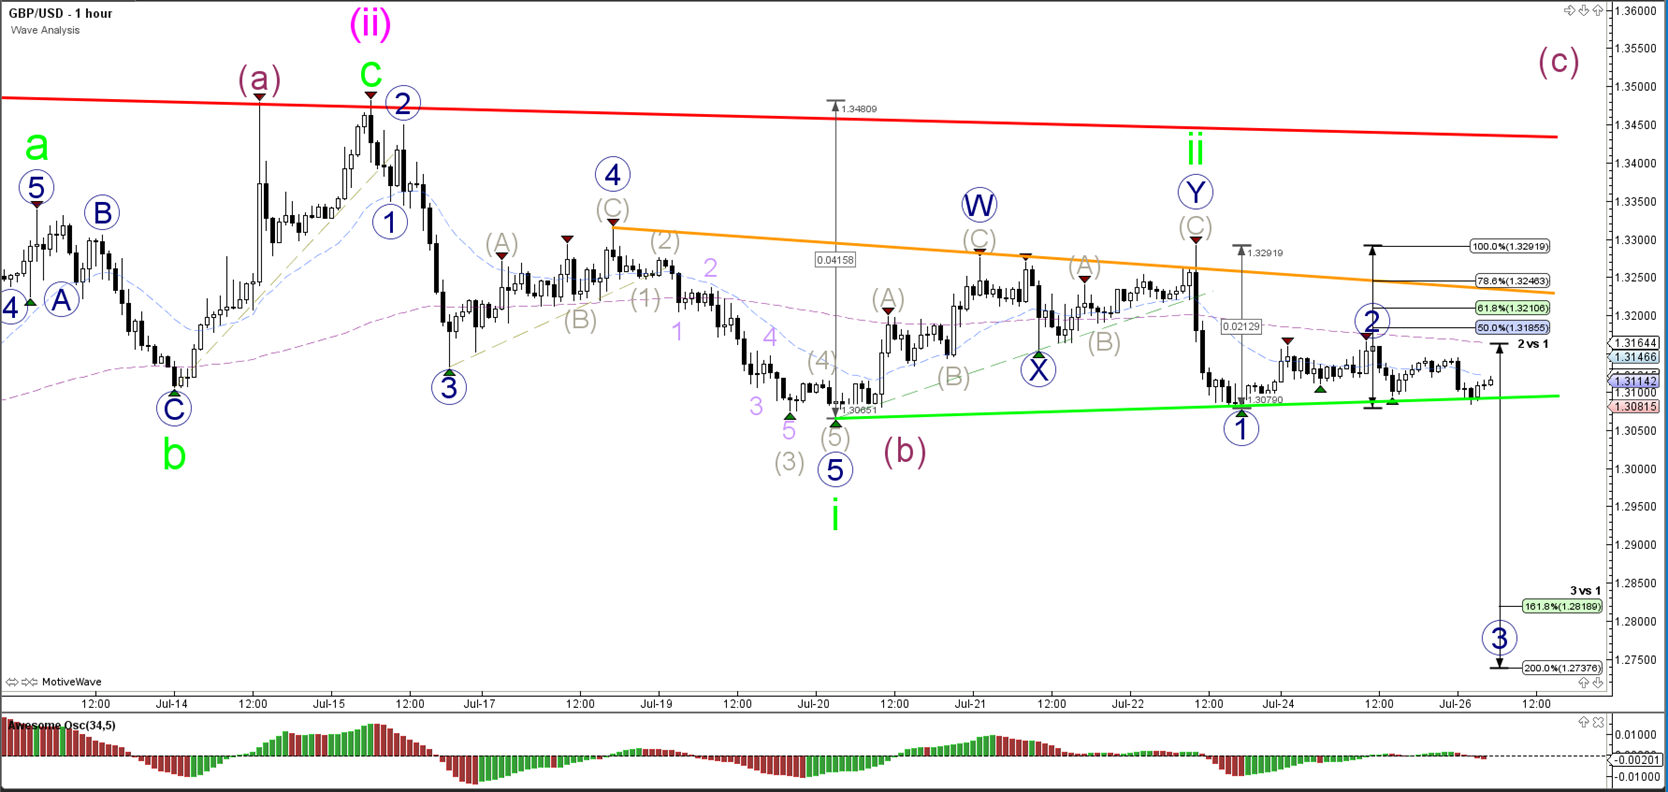
The GBP/USD is building a triangle (orange / green lines). A break below the support trend line is needed before a wave 3 (blue) could be expected. A break above the 100% Fibonacci level invalidates wave 2 (blue). The Fibonacci levels should act as resistance.
USD/JPY
4 hour

The USD/JPY is respected the resistance trend line (red) from the daily chart and broke the smaller support trend line (green). Price is now showing bearish momentum and heading towards the Fibonacci levels of wave C (grey) and the next support trend line (green).
1 hour
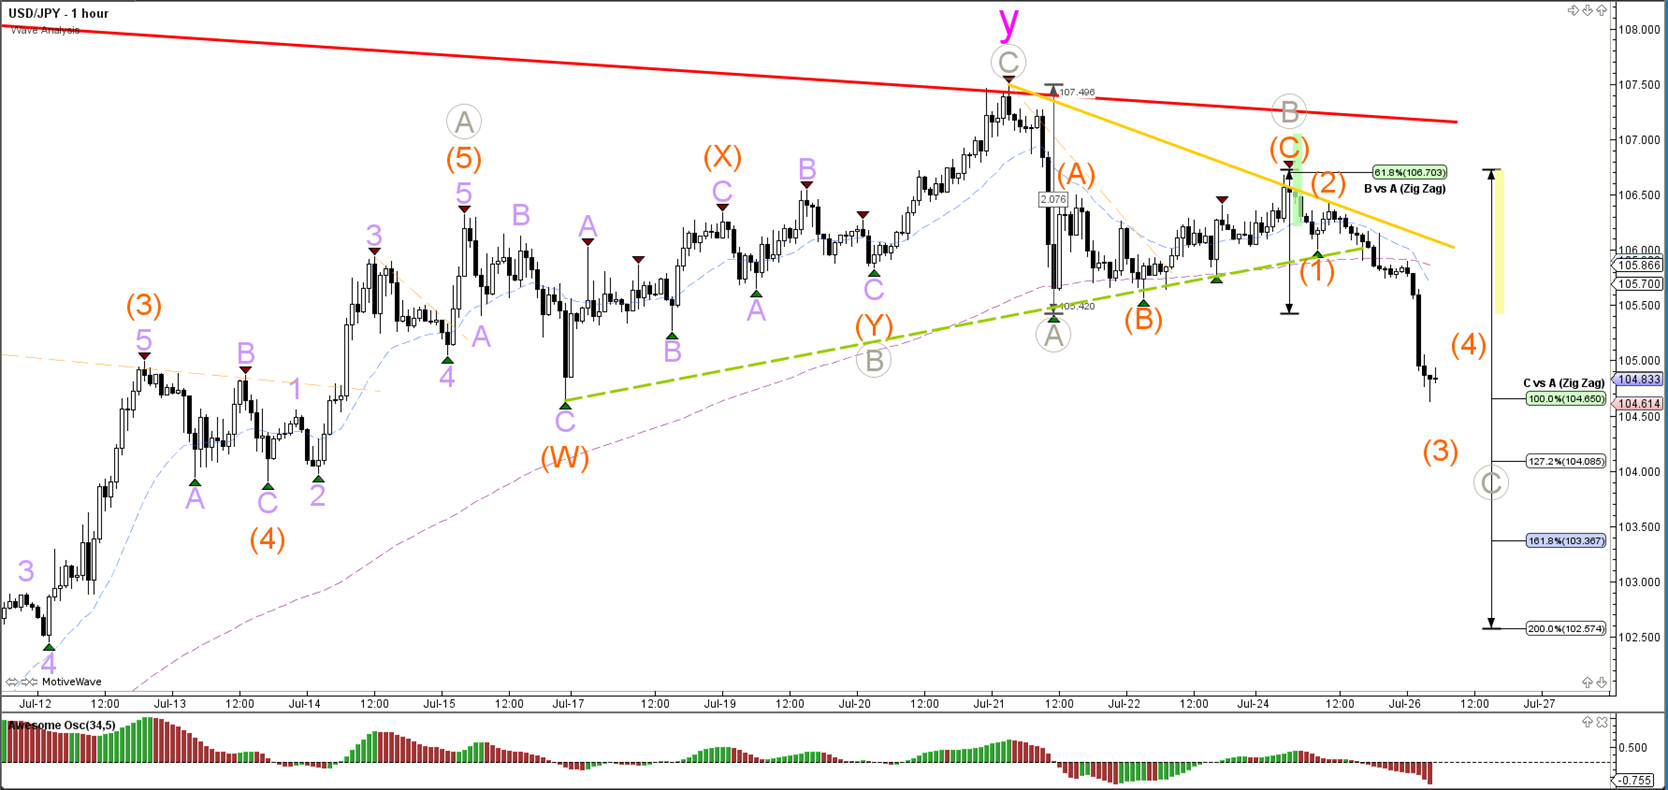
The USD/JPY is showing impulse of a wave 3 (orange).
“Original analysis is provided by Admiral Markets”