Elliott Wave Analysis by Admiral Markets

US Dollar cautiously developing bullish first wave

EUR/USD

4 hour

09_08_2016eu4.png


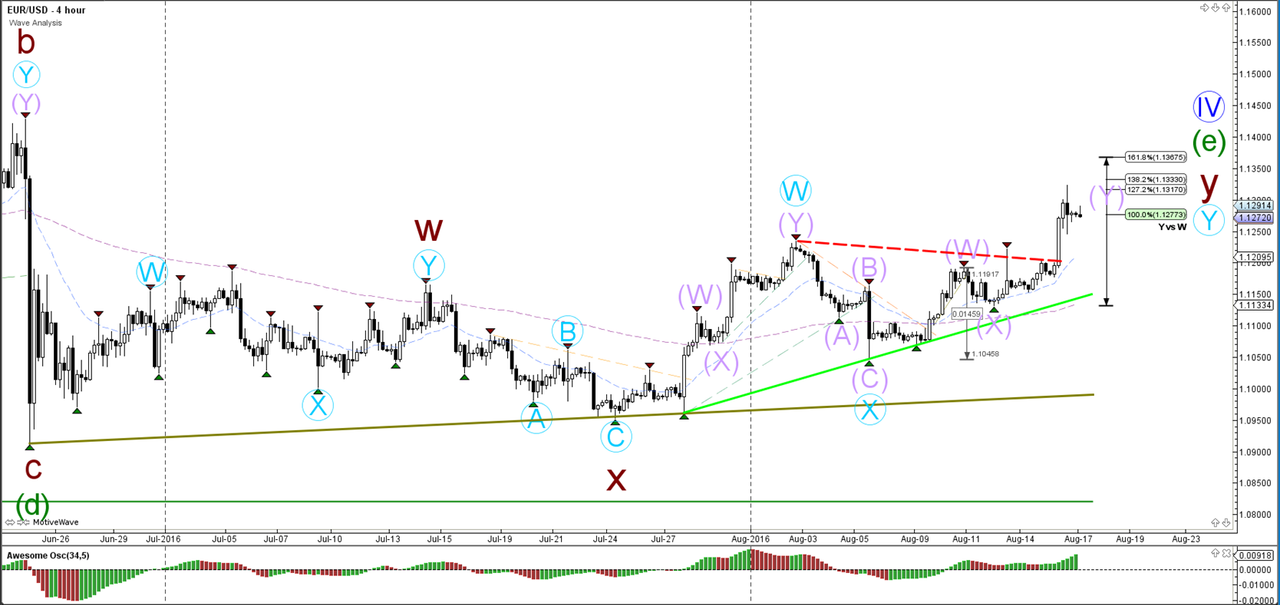
The EUR/USD is building a downtrend with lower lows and lower highs, which would be invalidated if price manages to break above the resistance trend line (red). A break below the support levels (greens) should see a continuation of the bearish momentum.

1 hour

09_08_2016eu1.png


The EUR/USD is building an ABC (green) correction within wave 4 (blue). A break below the support level (green) could spark the start of the 5th wave (blue) whereas a break above the 50% Fibonacci level makes the development of a wave 4 (blue) less likely.

GBP/USD

4 hour

09_08_2016gu4.png


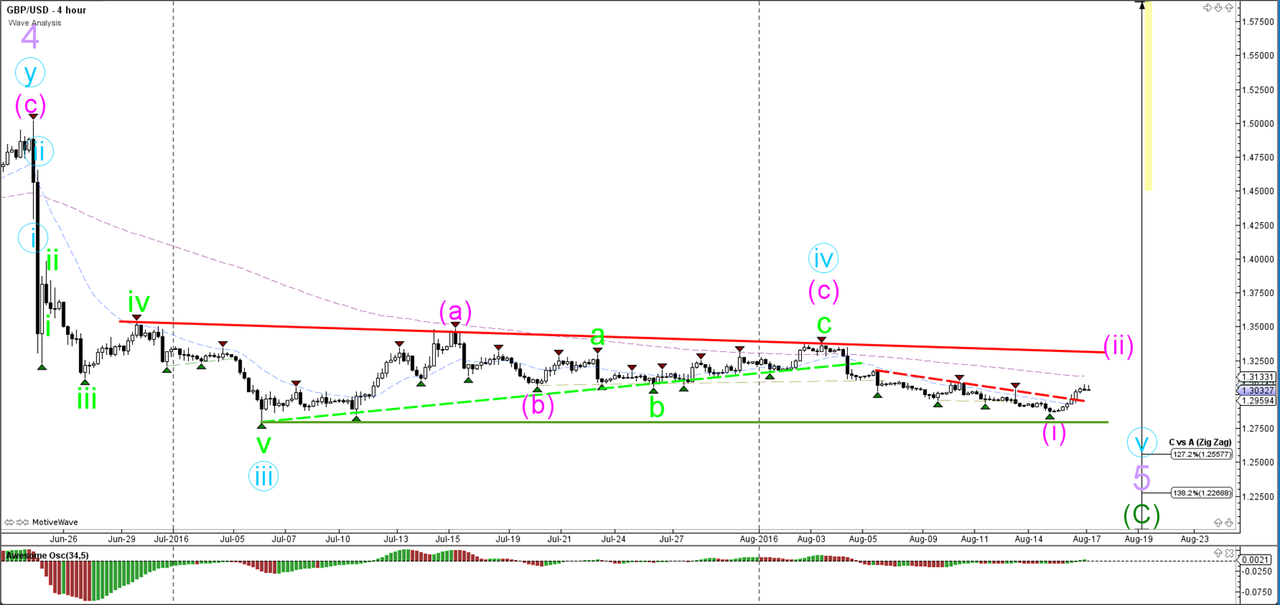
The GBP/USD would need to reach at least the 100% Fibonacci level before a wave 3 (pink) is confirmed but for the moment a bearish breakout is pushing with lower with lower lows and lower highs.

1 hour

09_08_2016gu1.png


The GBP/USD completed a wave 4 (blue) pullback as expected and then broke support levels (dotted green) to continue with the bearish momentum of wave 5 (blue). Price could now be heading towards the Fibonacci targets of wave 5 (blue).

USD/JPY

4 hour

09_08_2016uj4.png


The USD/JPY broke above the smaller resistance (dotted pink), which is confirming the larger bullish bounce at the support trend line (green). Price is slowing developing a trend reversal but a break above resistance (orange/red) is needed before larger bullish moves could be expected.

1 hour

09_08_2016uj1.png


The USD/JPY seems to be building a bull flag chart pattern (green/red lines) within an impulsive wave 3 (pink or green).

Follow @ChrisSvorcik on twitter for latest market updates
 
EUR/USD, GBP/USD switch momentum direction after bullish breakout

EUR/USD

4 hour

10_08_2016eu4.png


The EUR/USD managed to break above the resistance trend line (dotted red), which has indicated has lead to a change in wave structure where wave 1 (purple) has been completed at the recent bottom. Wave 2 (purple) is invalidated if price manages to break above the 100% Fibonacci level.

1 hour

10_08_2016eu1.png


The EUR/USD broke the resistance with strong momentum which indicates a potential wave C (blue).

GBP/USD

4 hour

10_08_2016gu4.png


The GBP/USD bearish breakout below the support trend line (dotted green) has not shown the momentum which a wave typically has. Therefore, the wave count now shows a wave 4 (blue) completed at the recent top. Price is either completing a 5th wave (blue) or more likely expanding it via an internal 5 waves (pink) as shown in the image.

1 hour

10_08_2016gu1.png


The GBP/USD broke the resistance trend line (dotted red) and is building a bullish ABC zigzag (green).

USD/JPY

4 hour

10_08_2016uj4.png


The USD/JPY seems to be building a hook back to the support tend line (green). A bearish break would invalidate wave 1-2 (green) and revive the downtrend.

1 hour

10_08_2016uj1.png


The USD/JPY broke the support of bull flag chart pattern (dotted green) and is now at/near the Fibonacci levels of wave 2 (green).

Follow @ChrisSvorcik on twitter for latest market updates
 
US Dollar is close to completing wave 2 correction

EUR/USD

4 hour

11_08_2016eu4.png


The EUR/USD is now testing and challenging the 78.6% Fibonacci retracement level of wave 2 (purple). A break above the 100% level invalidates wave 2 (purple) and means that a larger wave 2 (brown) is still ongoing and active.

1 hour

11_08_2016eu1.png


The EUR/USD seems to be losing momentum at the Fibonacci resistance and has broken the steeply angled support trend line (green dotted). Price needs to break below the support trend line (green) before the completion of a wave 2 (purple) can be confirmed.

GBP/USD

4 hour

11_08_2016gu4.png


The GBP/USD remains in a downtrend with resistance indicated by the Fibonacci retracements of wave 2 (purple) and with targets indicated by the Fibonacci levels of wave 5 (blue).

1 hour

11_08_2016gu1.png


The GBP/USD completed the expected bullish ABC (green) zigzag. It could now be at a bullish bounce or bearish break spot. A bullish rally would enlarge the correction with a WXY (green). A break below the Fibonacci levels of wave X (green) could spark a wave 3 bearish momentum (pink).

USD/JPY

4 hour

11_08_2016uj4.png


The USD/JPY seems to be building a hook back to the support tend line (green). A bearish break would invalidate wave 1-2 (green) and revive the downtrend. A bullish bounce could see price rally to the Fibonacci targets of wave 3 (green) and the resistance trend lines (orange/red).

1 hour

11_08_2016uj1.png


The USD/JPY seems to be respecting the 78.6% Fibonacci level of wave 2 (green) and has broken the resistance trend line (dotted red).

Follow@ChrisSvorcik on twitter for latest market updates
 
Breakout direction to decide wave structure in Forex

EUR/USD

4 hour

12_08_2016eu4.png


The EUR/USD bounced at the deep Fibonacci retracement level of 78.6% within a wave 2 (purple). A break above the 100% level invalidates wave 2 (purple) and indicates a large and complex correction. In that case the wave count will be changed to reflect the corrective zone. A break below support could still confirm the potential waves 3 (purple/brown) but sufficient momentum must be visible in the breakouts.

1 hour

12_08_2016eu1.png


The EUR/USD has clear resistance (red/Fib) and support levels above and below price. A bearish break could start the impulsive waves (purple/blue) whereas a bullish breakout would indicate an ABC correction (purple).

GBP/USD

4 hour

12_08_2016gu4.png


The GBP/USD is either completing a wave 5 (blue) or extending the wave 5 (blue) with a wave 1-2 (pink).

1 hour

12_08_2016gu1.png


The GBP/USD seems to have completed an ABC correction (blue) at the previous bottom, which has been labelled a wave X (green). A break below the support (green) and Fibonacci levels of wave X vs W invalidate the current wave count and indicate a downtrend continuation. A break above resistance (red) would most likely confirm a bullish rally for wave C (blue).

USD/JPY

4 hour
12_08_2016uj4.png


The USD/JPY indeed bounced at the support tend line (green). A bullish break above resistance (oranges) would confirm potential for a wave 3 rally (green).

1 hour

12_08_2016uj1.png


The USD/JPY has completed deep wave 2 pullbacks and might be starting with bullish momentum. A strong resistance level (red) however is nearby and a breakout is needed before the wave rally can develop.

Follow@ChrisSvorcik on twitter for latest market updates
 
EUR/USD bullish breakout in wave E of contracting triangle

EUR/USD

4 hour

15_08_2016eu4.png


The EUR/USD is testing the resistance trend line (red). A breakout above resistance could see price move towards the wave E (green) of wave 4 (blue), which has been added due to the lack of a bearish breakout. The consolidation zone on the daily chart is lengthy and suggests a contracting triangle chart pattern (ABCDE brown).

1 hour

15_08_2016eu1.png


The EUR/USD showed bullish momentum above the broken trend line (dotted red). Price is building an ABC bullish zigzag (blue) unless price breaks below the 100% Fibonacci level of wave B.

GBP/USD

4 hour

15_08_2016gu4.png


The GBP/USD is either completing a wave 5 (blue) or extending the wave 5 (blue) with a wave 1-2 (pink).

1 hour

15_08_2016gu1.png


The GBP/USD seems to have completed an ABC correction (blue) within wave Y (green) of wave 2 (pink). A break above the 100% Fibonacci level invalidates wave 2 (green).

USD/JPY

4 hour

15_08_2016uj4.png


The USD/JPY bounced at the support tend line (green) but has not managed to move away from it and is challenging the same trend line again. A bullish break above resistance (oranges) would confirm potential for a wave 3 rally (green). A bearish break below the 100% Fibonacci level indicates a potential for a renewed bearish trend.

1 hour

15_08_2016uj1.png


The USD/JPY has to break above the resistance trend line (orange) before a wave 2 (green) can be considered completed. The 100% Fibonacci level is the invalidation point of the wave 2 (green).

Follow@ChrisSvorcik on twitter for latest market updates
 
USD/JPY bearish breakout expands wave B correction to 61.8% Fib

EUR/USD

4 hour

16_08_2016eu4.png


The EUR/USD is testing the resistance trend line (red) of a larger contracting triangle chart pattern (ABCDE brown). A bullish breakout could see price move towards the wave E (green) of wave 4 (blue).

1 hour

16_08_2016eu1.png


The EUR/USD needs to break support (green) or resistance (red) trend lines before momentum can be expected.

GBP/USD

4 hour

16_08_2016gu4.png


The GBP/USD is either completing a wave 5 (blue) or extending the wave 5 (blue) with an internal 5 wave (pink).

1 hour

16_08_2016gu1.png


The GBP/USD is building a neat downtrend channel (trend lines). A break above the channel and 100% Fibonacci level invalidates wave 2 (green).

USD/JPY

4 hour

16_08_2016uj4.png


The USD/JPY broke below the support tend line (dotted greens), which confirms the bearish wave structure. Price seems to have space to fall towards the Fibonacci levels with main target at the 61.8% Fibonacci level of wave B vs A.

1 hour

16_08_2016uj1.png


The USD/JPY seems to be building a wave 3 breakout.

Follow@ChrisSvorcik on twitter for latest market updates
 
Major currency pairs boost sturdy momentum after breakout

EUR/USD

4 hour

The EUR/USD broke the resistance trend line (dotted) as expected in yesterday’s wave analysis. The bullish move is part of a larger contracting triangle chart pattern (ABCDE green).

17_08_2016eu4.png


1 hour

17_08_2016eu1.png


The EUR/USD broke the resistance (dotted) with strong momentum, which could indicate that it was a wave 3 (orange). In that case a wave 4 and 5 (orange) could unfold soon. The wave 4 (orange) structure is invalidated if price moves below the 78.6% Fibonacci level of wave 4 vs 3.

GBP/USD

4 hour

17_08_2016gu4.png


The GBP/USD is either completing a wave 5 (blue) or extending the wave 5 (blue) with an internal 5 wave indicated by wave 1-2 (pink). A break below the previous bottom (green) is needed before an extension of the downtrend is confirmed.

1 hour

17_08_2016gu1.png


The GBP/USD broke the resistance (dotted ) trend line of the bearish channel with strong bullish momentum, which makes it likely that a bullish ABC zigzag (green) is taking place. If the wave A (green) has completed, then price could use the Fibonacci levels of wave B (green) as a potential support.

USD/JPY

4 hour

17_08_2016uj4.png


The USD/JPY has broken the support tend lines (dotted greens), but still needs to break below the previous bottom before a larger bearish continuation can be expected towards the 61.8% Fibonacci retracement level of wave B vs A.

1 hour

17_08_2016uj1.png


The USD/JPY has shown a strong bearish breakout as part of a wave 3 (pink) but the bullish correction has retraced all the way to the 61.8% Fibonacci level of wave 4 vs 3. A break above the 78.6% Fibonacci level invalidates the current wave structure. A break below the support trend line could start wave 3 (green).

Follow @ChrisSvorcik on twitter for latest market updates
 
EUR/USD, GBP/USD move impulsively towards Fibonacci targets

EUR/USD

4 hour

18_08_2016eu4.png


The EUR/USD is in a bullish momentum which is part of a larger contracting triangle chart pattern (ABCDE green).

1 hour

18_08_2016eu1.png


The EUR/USD showed a retracement back towards the 50% and 61.8% Fibonacci retracement level which completed wave 4 (orange). The wave 5 (orange) is heading towards the Fibonacci targets.

GBP/USD

4 hour

18_08_2016gu4.png


The GBP/USD is either completing a wave 5 (blue) or extending the wave 5 (blue) with an internal 5 wave indicated by wave 1-2 (pink). A break below the previous bottom (green) is needed before an extension of the downtrend is confirmed.

1 hour

18_08_2016gu1.png


The GBP/USD indeed completed a wave B (green) correction and is moving higher as part of the wave C (green). A break of the resistance trend line (orange) or retest and bounce at the support trend line (green) could lead to bullish continuation towards the Fibonacci targets.

USD/JPY

4 hour

18_08_2016uj4.png


The USD/JPY is struggling to break the horizontal support of the previous bottom (green). Price will either break the support for a downtrend continuation or break above the resistance and potentially start a reversal.

1 hour

18_08_2016uj1.png


The USD/JPY needs to break below the Fibonacci levels of wave X vs W before a continuation of the bearish momentum is expected. At the moment a bullish ABC zigzag (green) seems the most likely scenario.

Follow @ChrisSvorcik on twitter for latest market updates
 
EUR/USD, GBP/USD continue with bullish momentum in wave 3

EUR/USD

4 hour

19_08_2016eu4.png


The EUR/USD continued its strong bullish momentum yesterday and throughout the week. This

seems to have completed an impulsive wave 3 (green) and one more push higher (wave 5 green)

could occur if a corrective wave 4 (green) pattern develops.

1 hour

19_08_2016eu1.png


The EUR/USD could bounce at the Fibonacci levels of wave 4 (green). A break below the 61.8%

Fibonacci level and trend line (green) invalidates the wave 4 (green).

GBP/USD

4 hour

19_08_2016gu4.png


The GBP/USD is either completing a wave 5 (blue) or extending the wave 5 (blue) with an internal 5

wave indicated by wave 1-2 (pink). Price has not reached the 61.8% Fibonacci level of wave 2 vs 1 but

a break above the 100% Fib level invalidates the pink 1-2. A break below the previous bottom (green)

is needed before an extension of the downtrend is confirmed.

1 hour

19_08_2016gu1.png


The GBP/USD broke the resistance trend line (orange) yesterday and showed bullish impulsiveness as

expected within the wave C (green) zigzag. Price could now bounce at the Fibonacci levels of wave 4

(blue) but a break below the 61.8% Fibonacci level, however, invalidates the wave 4 (green).

USD/JPY

4 hour

19_08_2016uj4.png


The USD/JPY will either break the support for a downtrend continuation or break above the

resistance and potentially start a reversal. Consider the struggle to break the horizontal support of

the previous bottom (green), a larger upside correction or reversal seems most likely.

1 hour

19_08_2016uj1.png


The USD/JPY indeed completed the wave A (green) and wave B (green) as shown yesterday. A break

above the resistance (red) should initiate wave C (green).

Follow @ChrisSvorcik on twitter for latest market updates
 
EUR/USD, GBP/USD in waves 4 marked by trend lines

EUR/USD

4 hour

22_08_2016eu4.png


The EUR/USD has made a bearish retracement back to the 38.2% Fibonacci retracement level as
expected. The Fibonacci levels could provide support as part of a wave 4 (green). A break below the
61.8% Fibonacci level would invalidate the wave 4 (green) structure.

1 hour

22_08_2016eu1.png


The EUR/USD has arrived at a spot where it could complete a bullish bounce at the Fib levels or
bearish break through the support trend line (green). A bullish break above resistance (red) could
indicate the start of wave 5 (green).

GBP/USD

4 hour

22_08_2016gu4.png


The GBP/USD is either completing a wave 5 (blue) or extending the wave 5 (blue) with an internal 5
wave indicated by wave 1-2 (pink). The Cable turned at the 61.8% Fibonacci level of wave 2 vs 1 and
broke below the support trend line (dotted green), which could mark the start of wave 3 (pink) if
price manages to break the previous bottom (green). A break above the 100% Fib level invalidates
the pink 1-2.

1 hour

22_08_2016gu4.png


The GBP/USD completed 5 waves (blue) within a wave C (green) zigzag. The Cable is now showing
bearish momentum (wave 3 blue) and a triangle (trend lines). A break below the support trend line
could start wave 5 (blue) whereas a break above the 61.8% Fibonacci level of wave 4 (blue)
invalidates it.

USD/JPY

4 hour

22_08_2016uj4.png


The USD/JPY will either break the support (green) for a downtrend continuation or break above the
resistance (red) and potentially start a reversal. Bullish momentum seems likely at the moment after
the break above the first resistance trend line (dotted orange).

1 hour

22_08_2016uj1.png


The USD/JPY is in a channel (orange/green). A break below the channel could indicate a downtrend
continuation and invalidate the current wave structure. A break above the channel could confirm the
development of a wave 3 (brown/blue).

Follow @ChrisSvorcik on twitter for latest market updates
 
Back
Top