Admiral Markets
AdmiralMarkets.com Representative
- Messages
- 95
Bullish ABC zigzag creates breakout above trend line
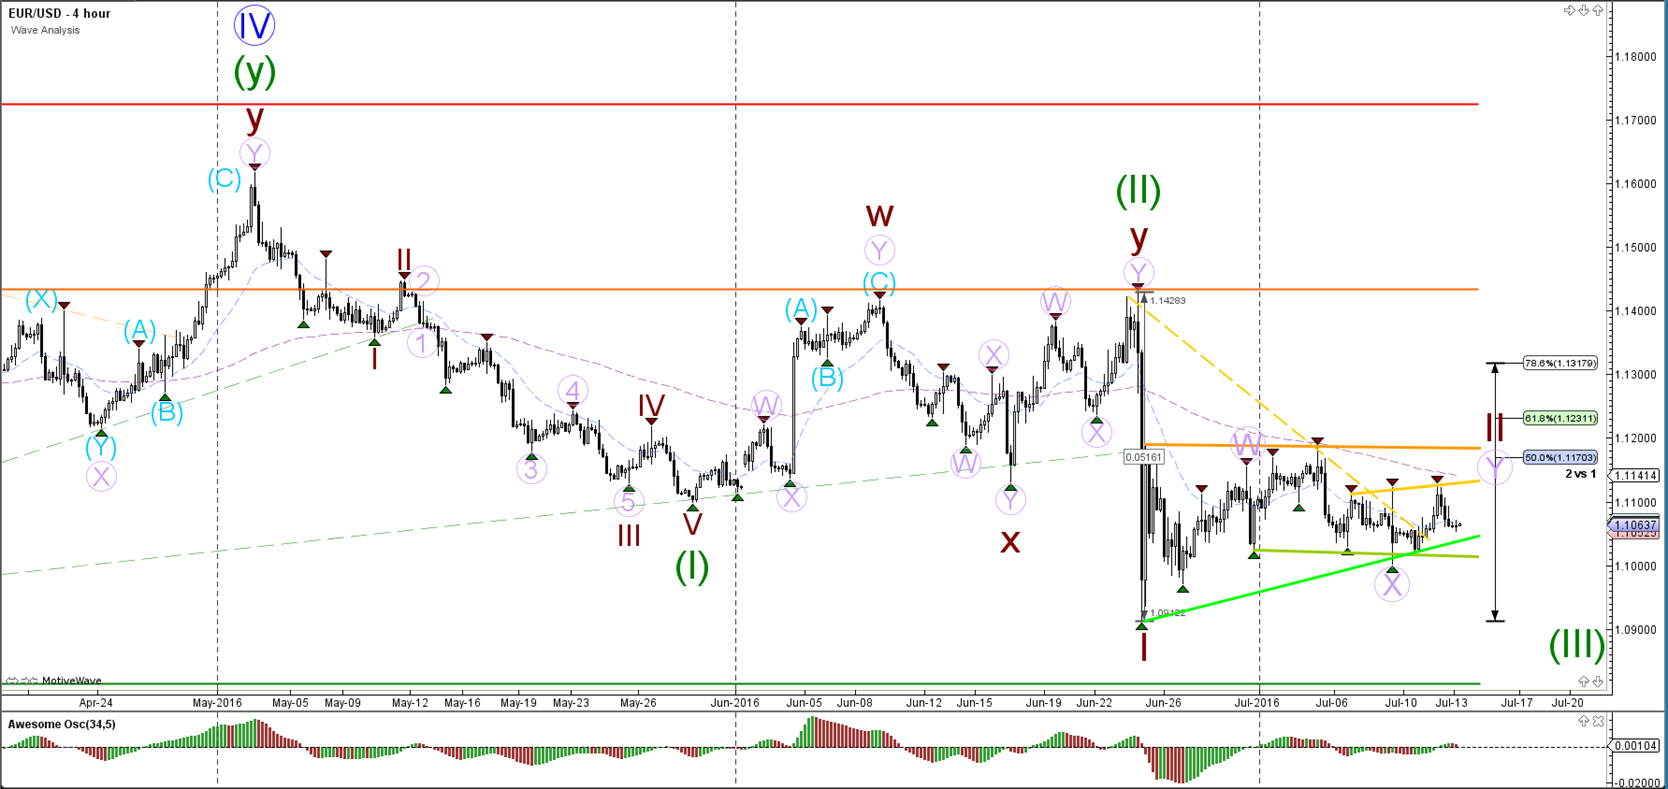
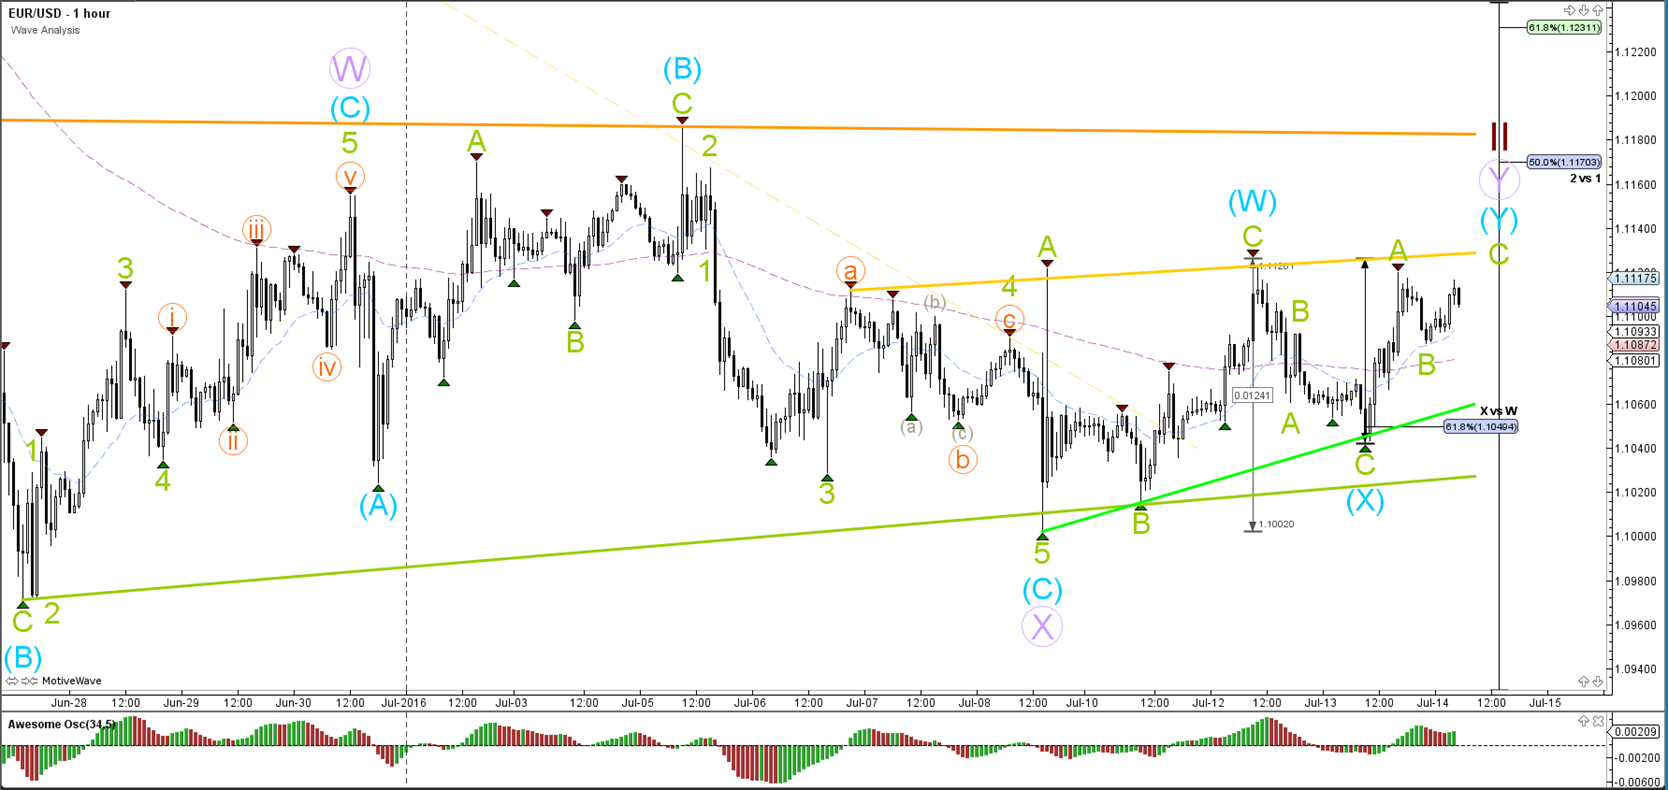
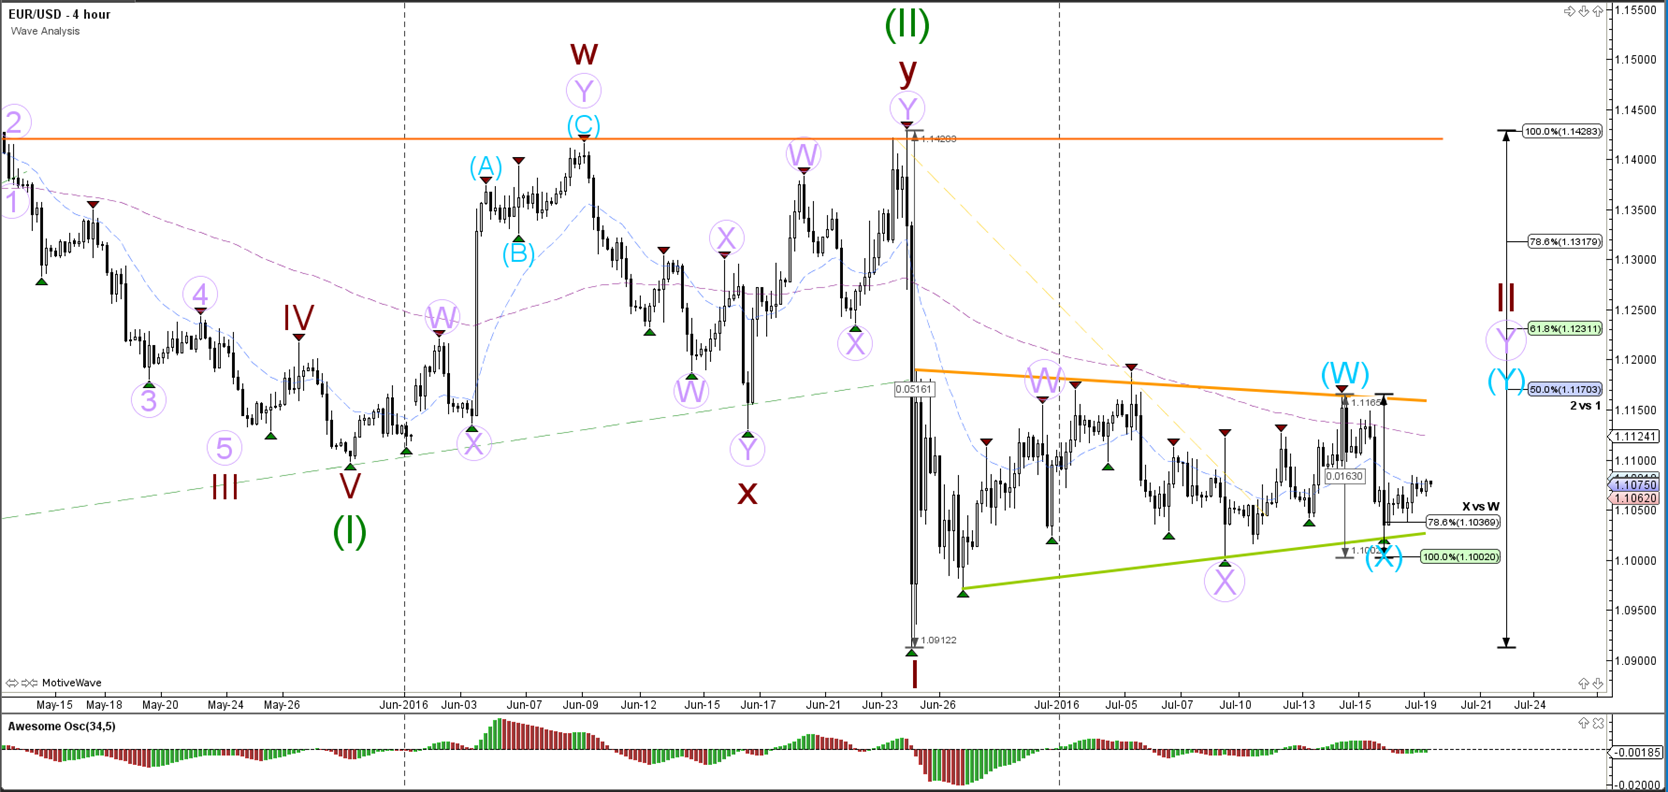
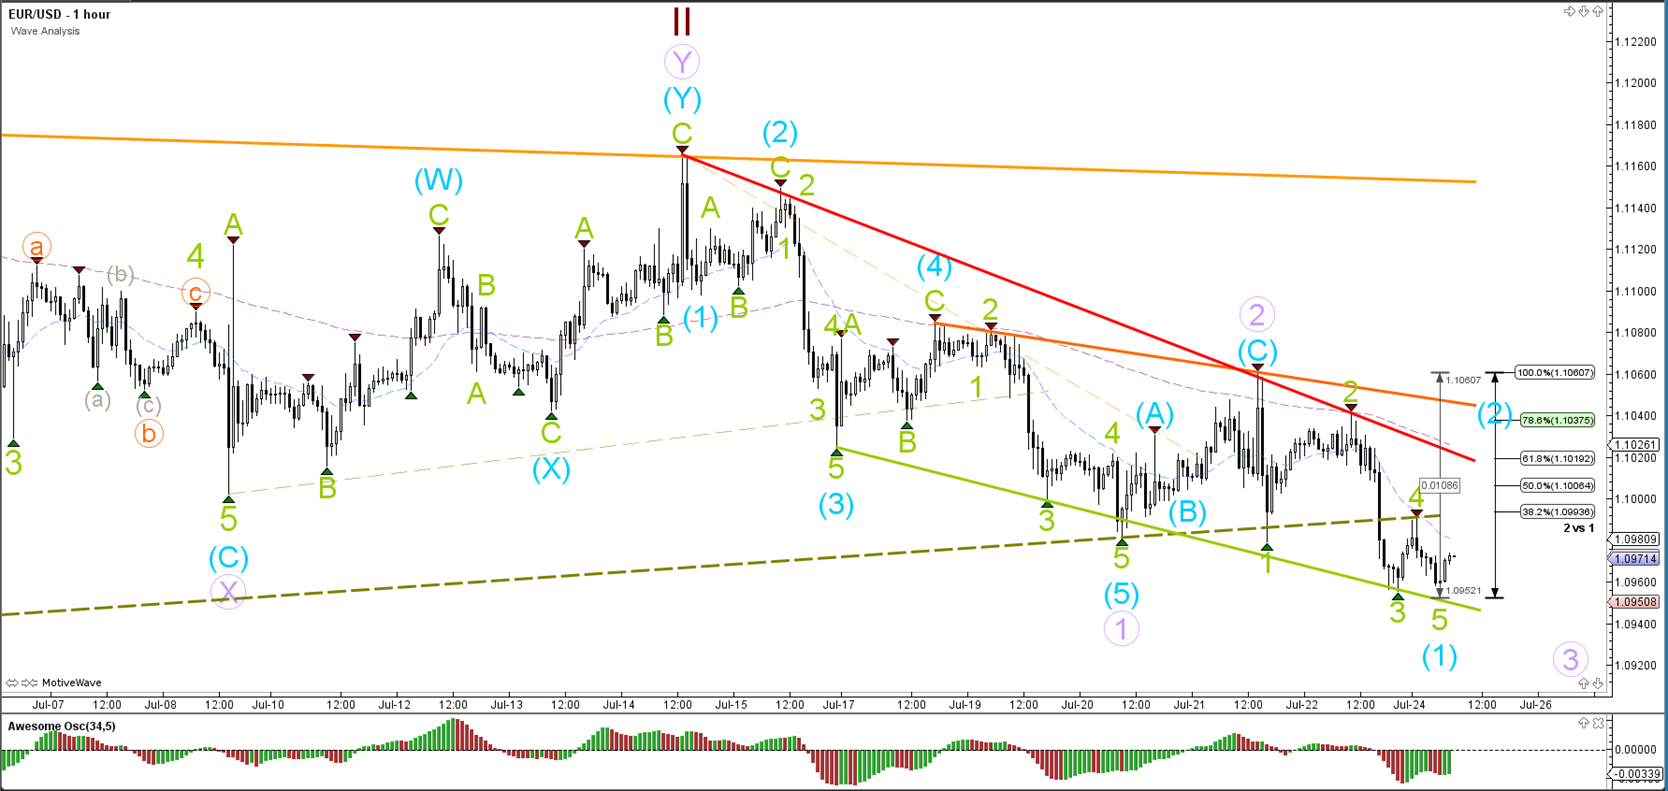
EUR/USD
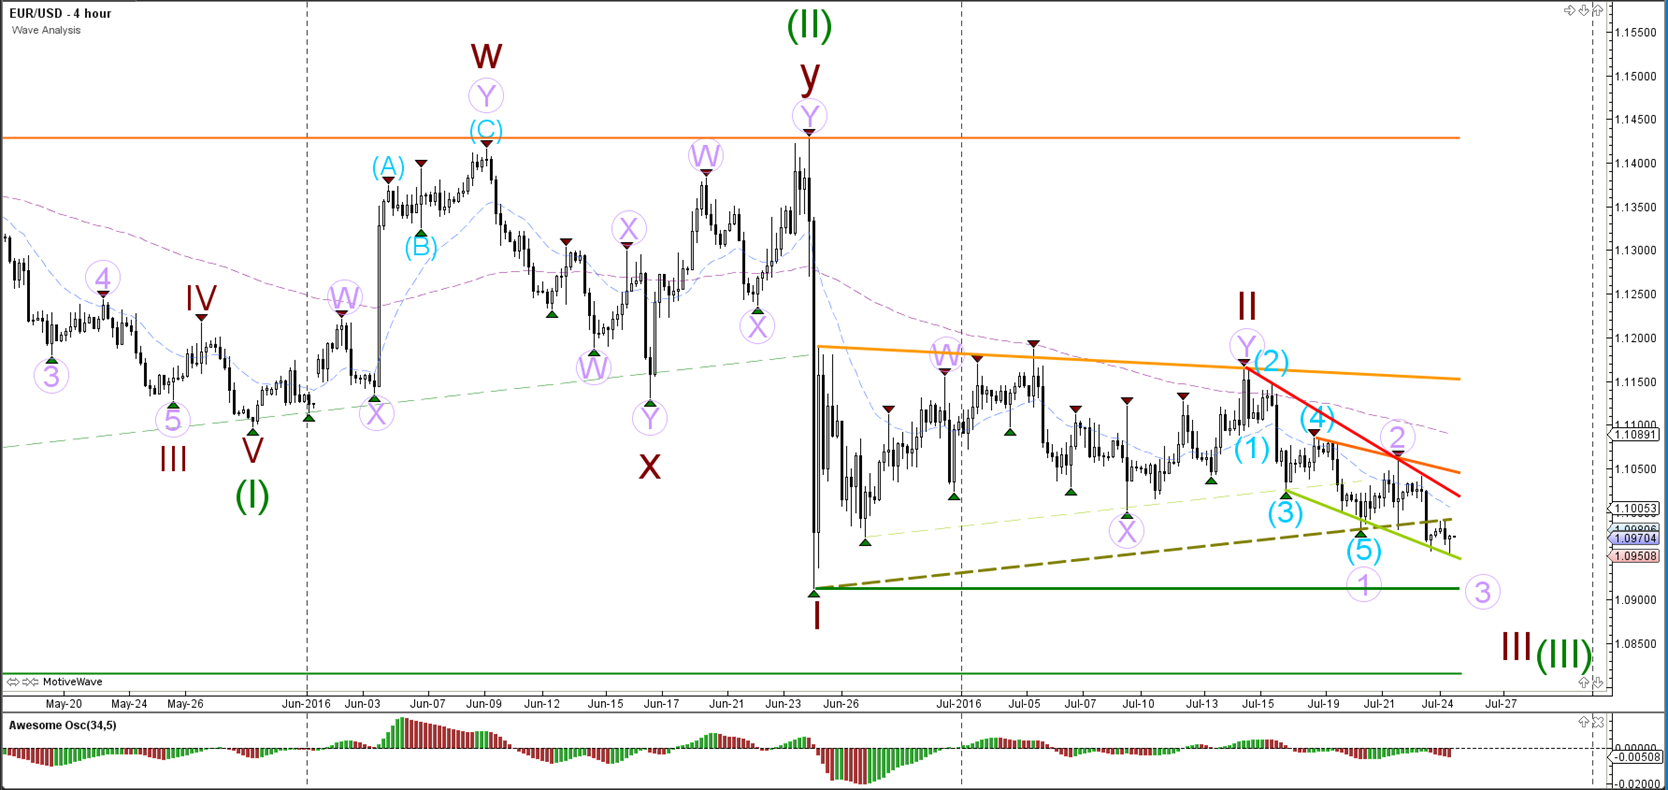
4 hour

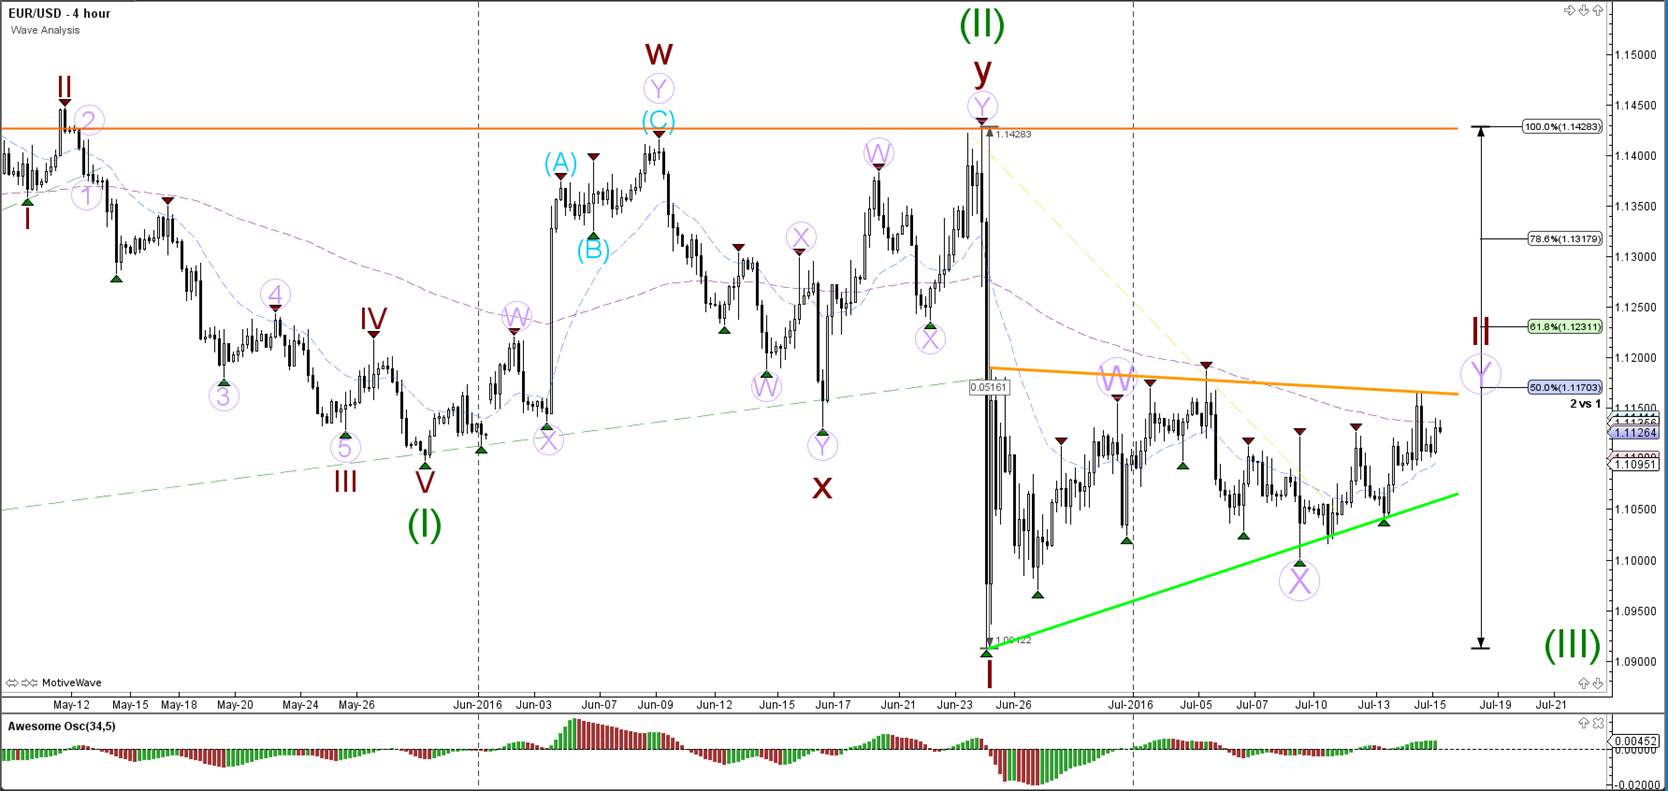
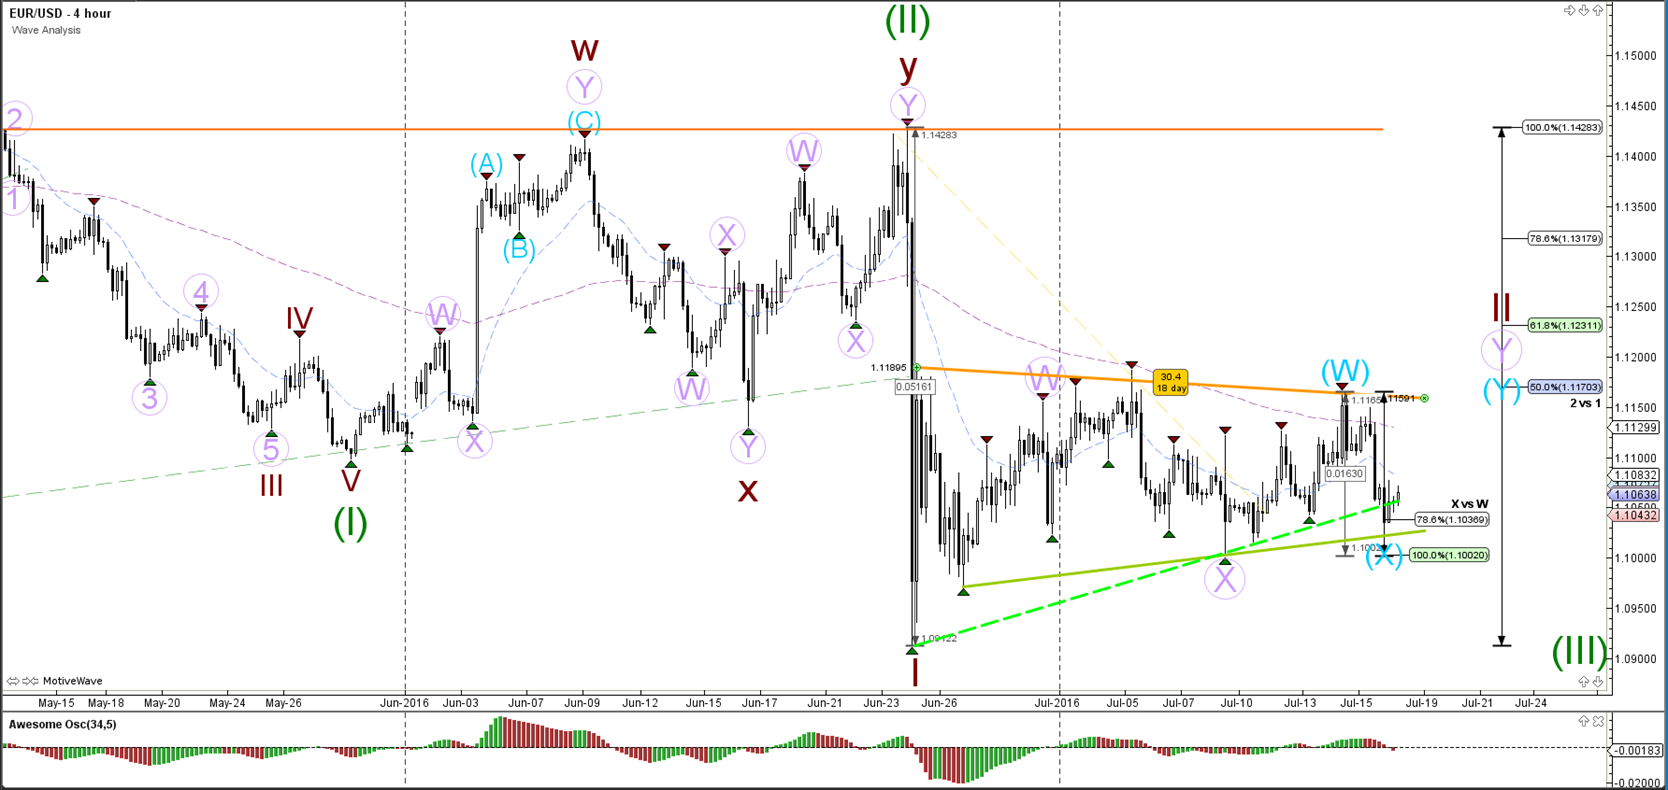
The EUR/USD is bouncing at the support levels (green) of the larger consolidation zone (orange/green). The correction is most likely part of a larger wave 2 (brown) via a WXY (purple). Price needs to break below the support (green lines) levels before a wave 3 (green) continuation is likely whereas a break above the 100% Fib at 1.1428 invalidates wave 2 (brown).
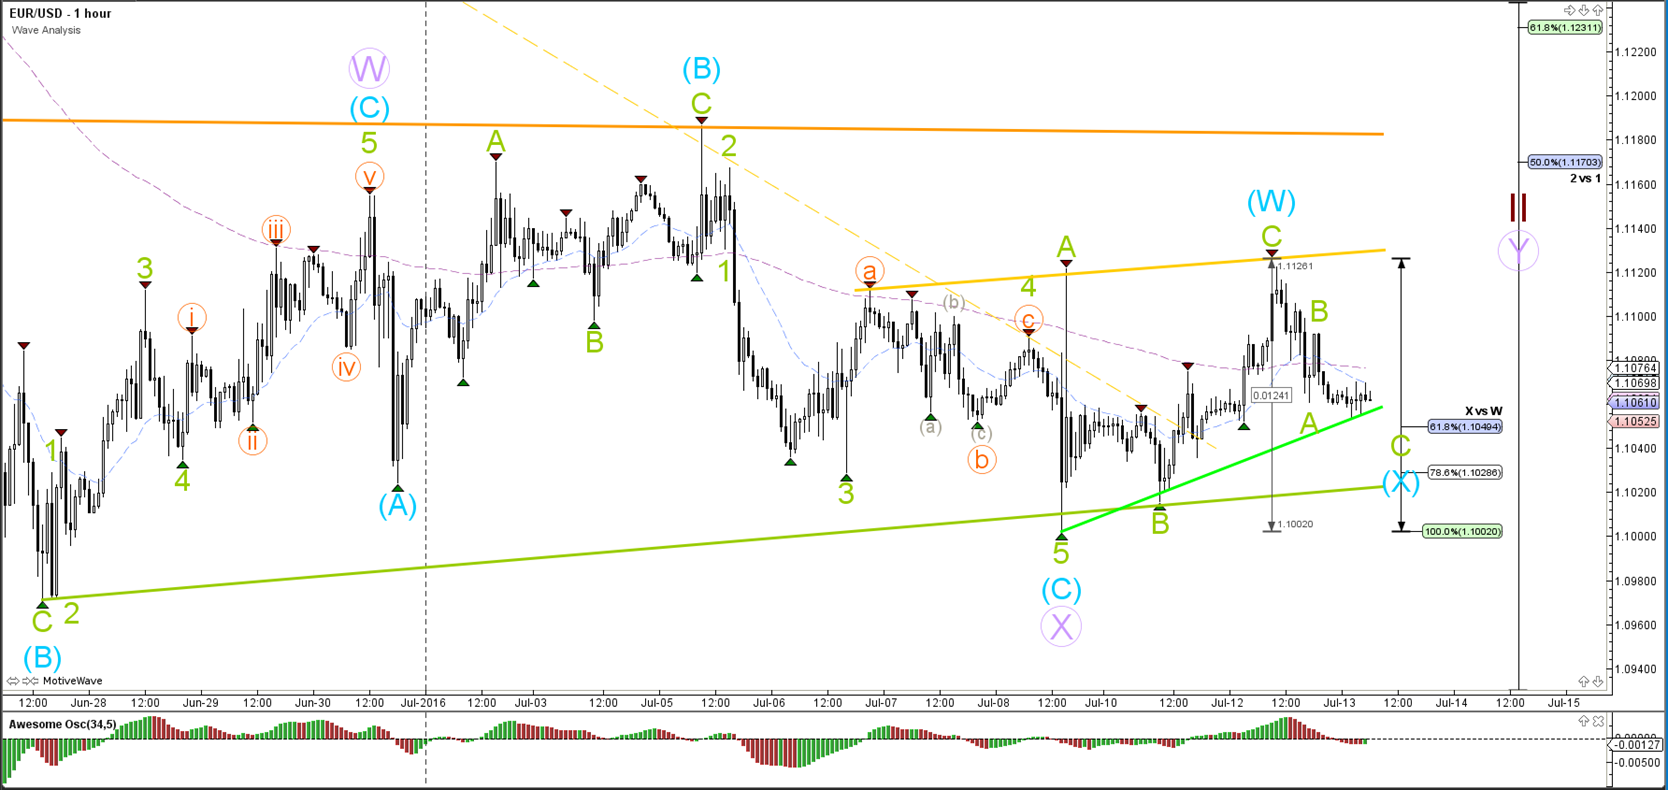
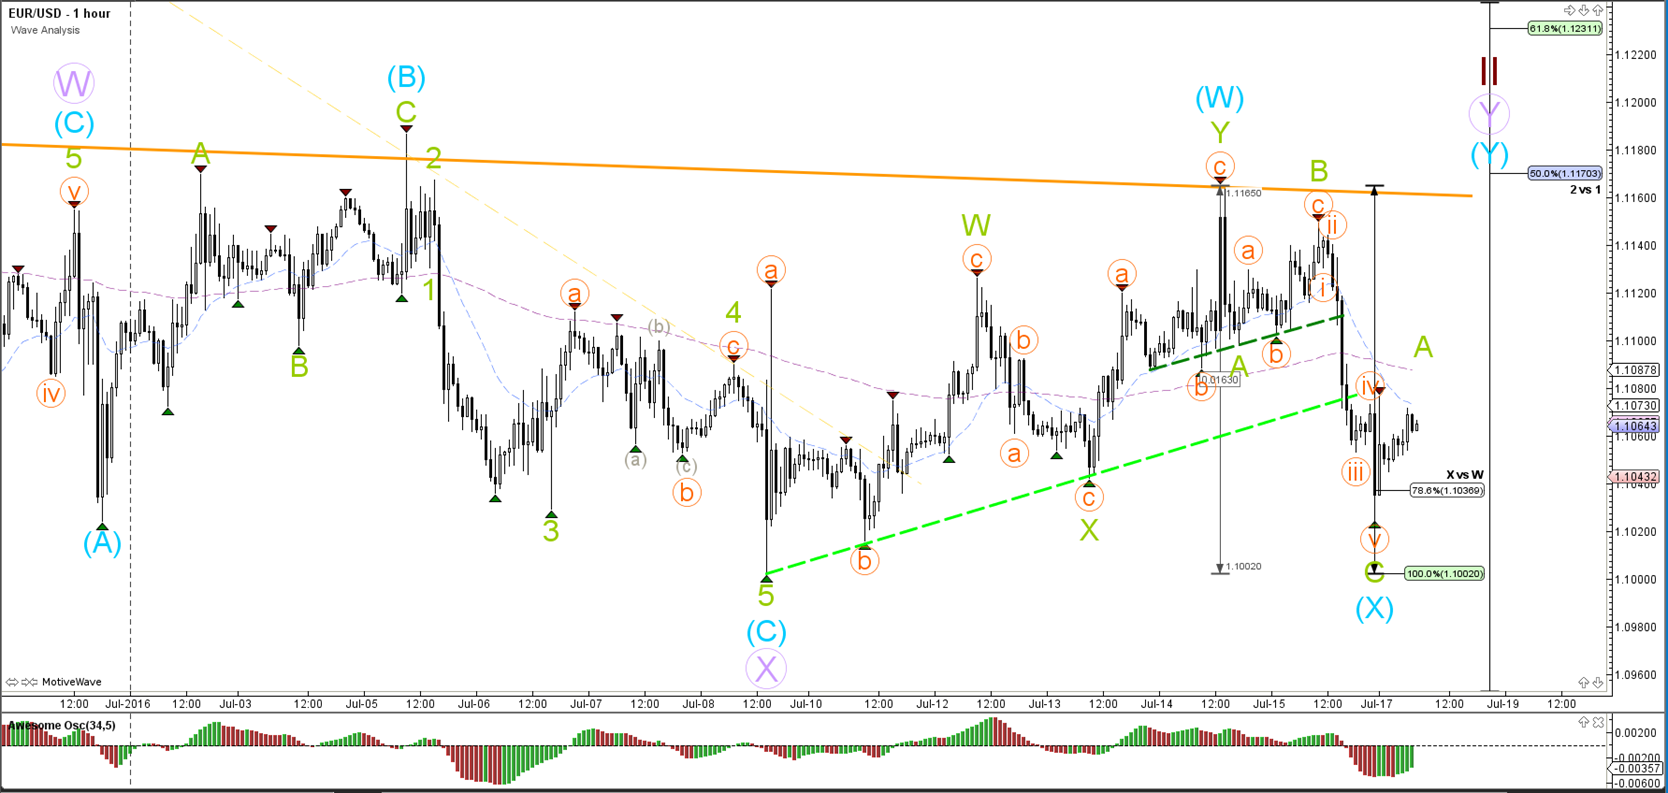
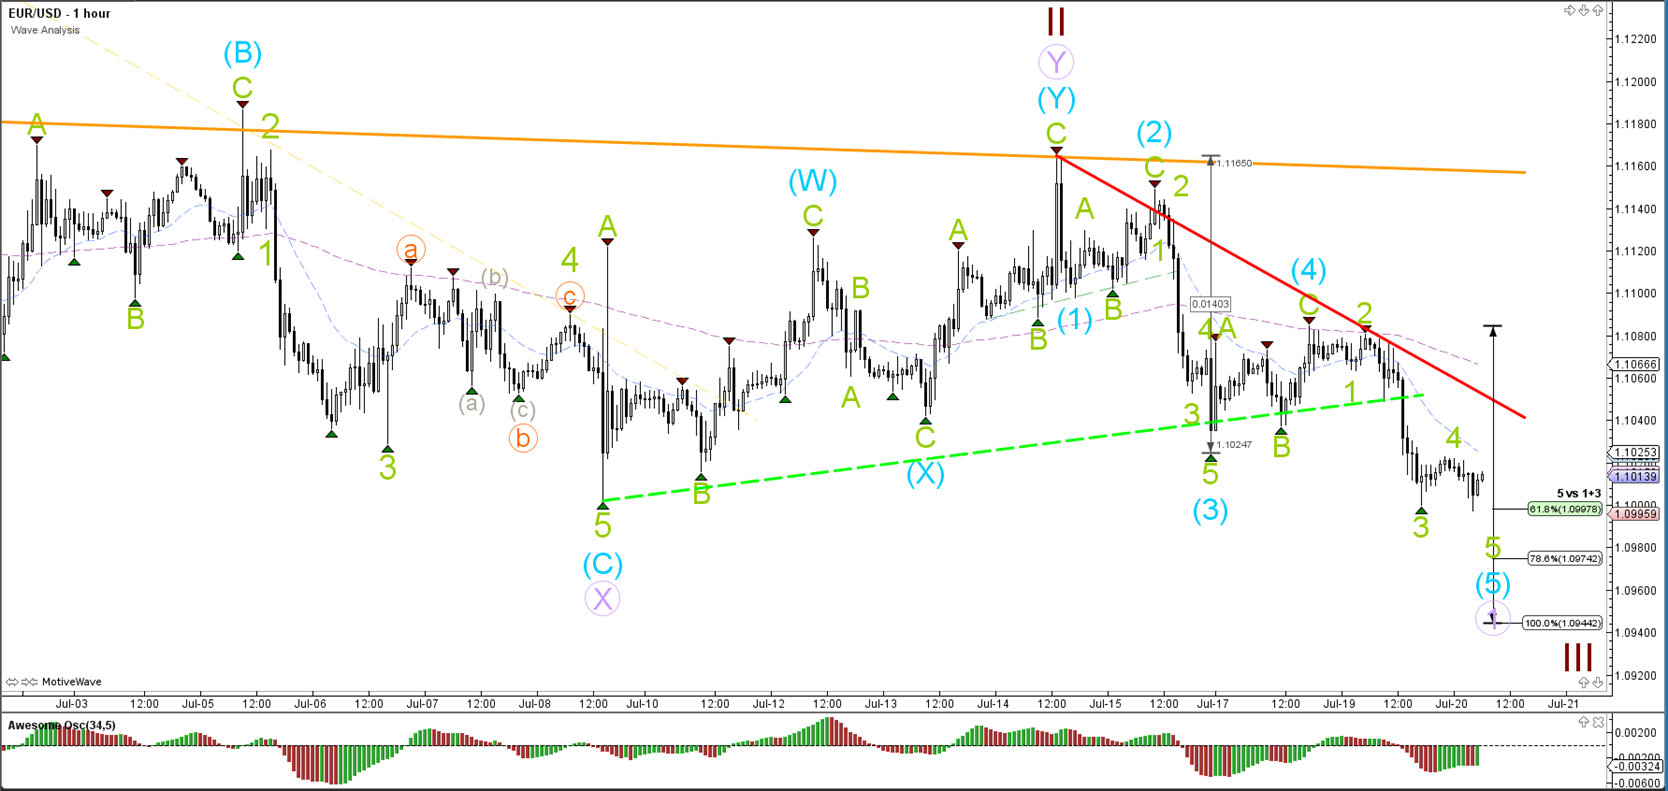
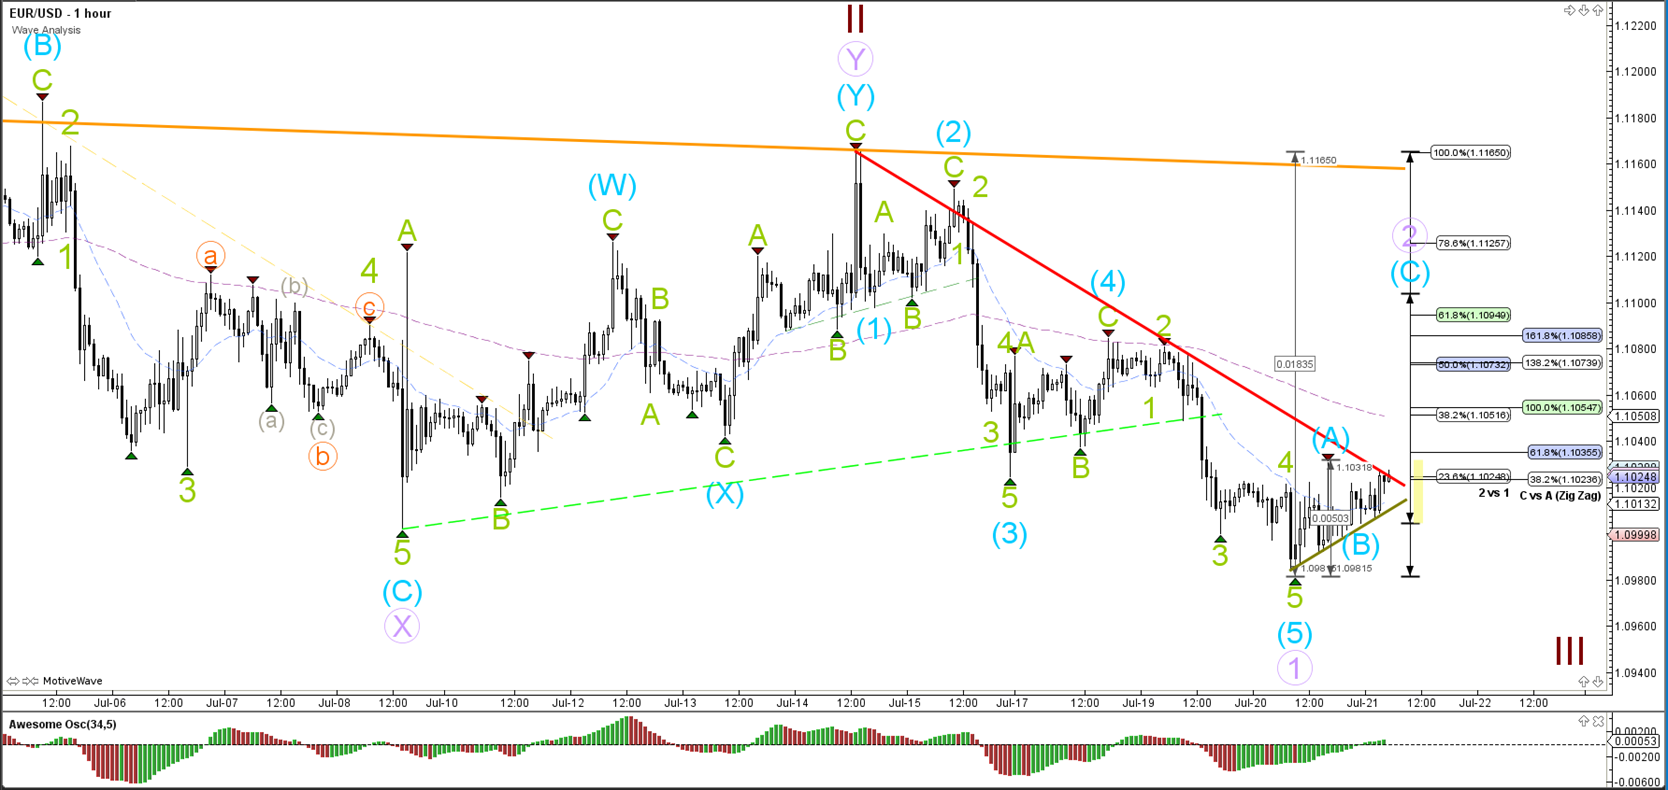
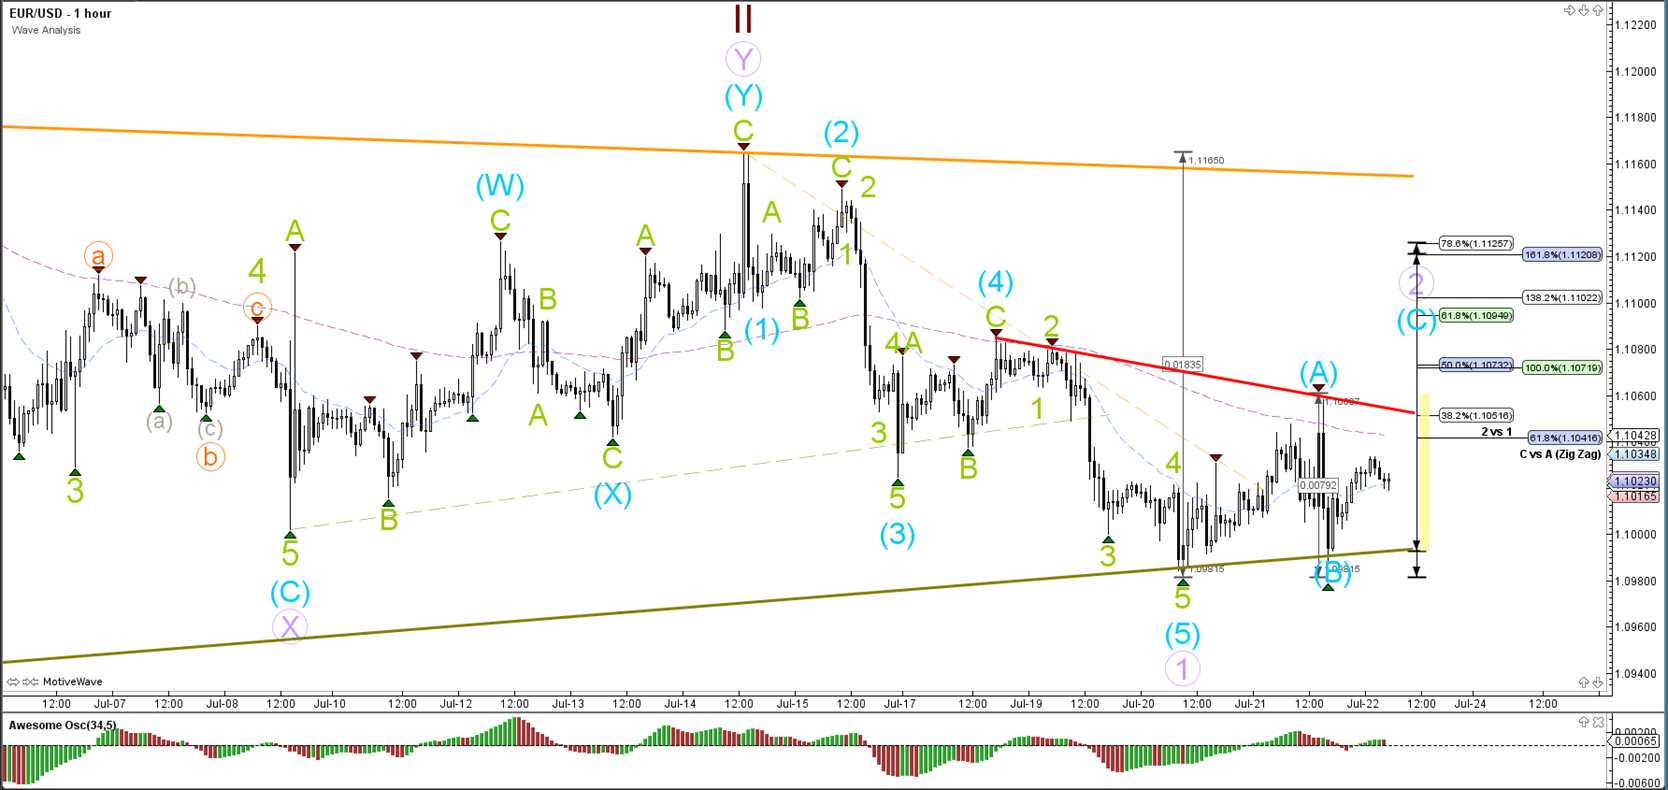
1 hour

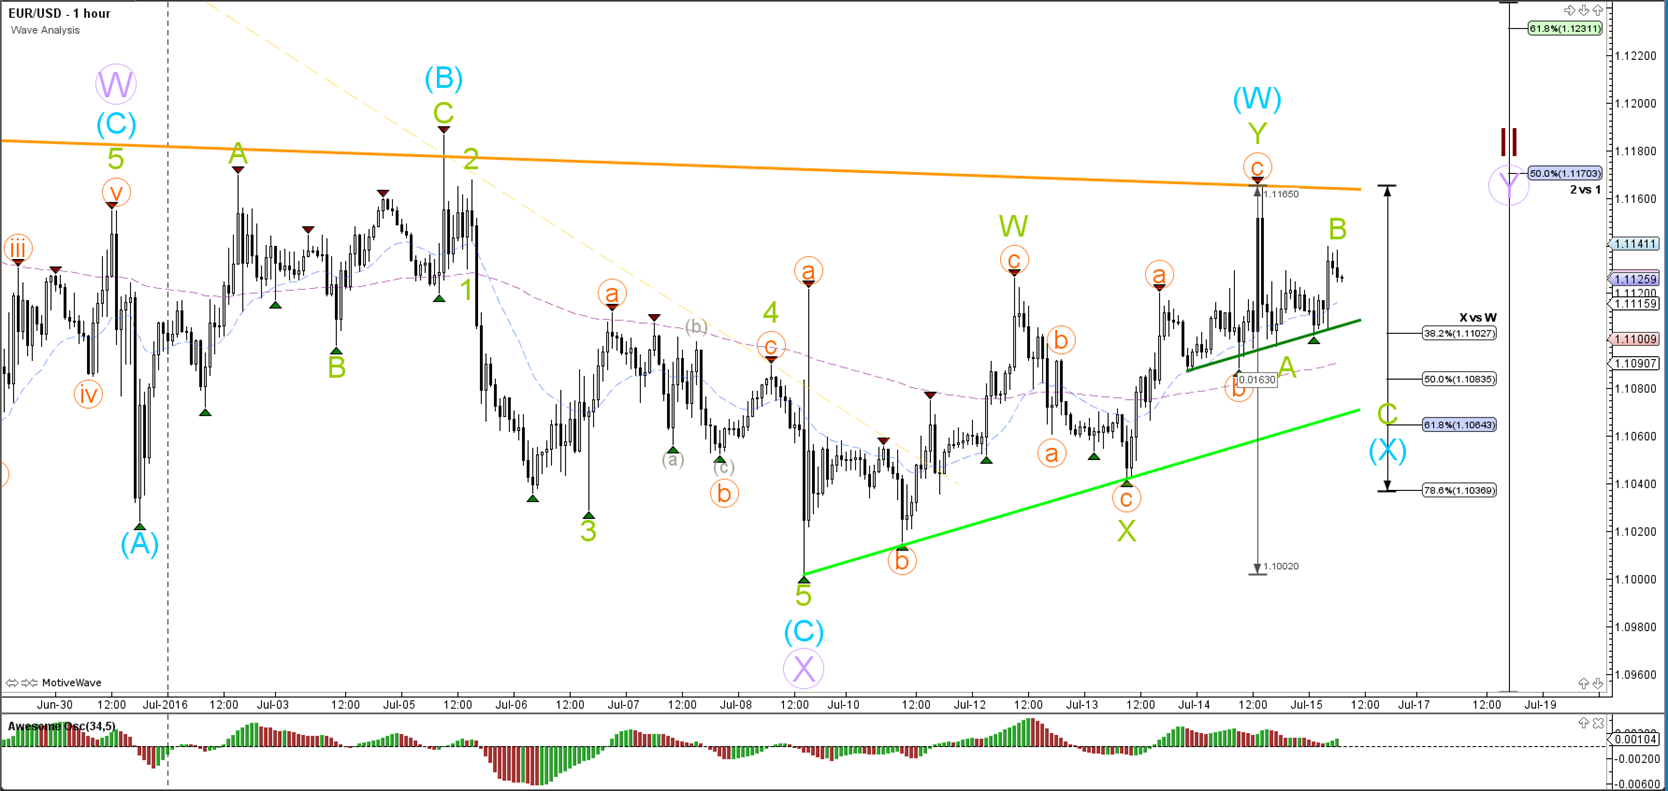
A bullish ABC (blue) zigzag is taking place within wave 2 (brown).
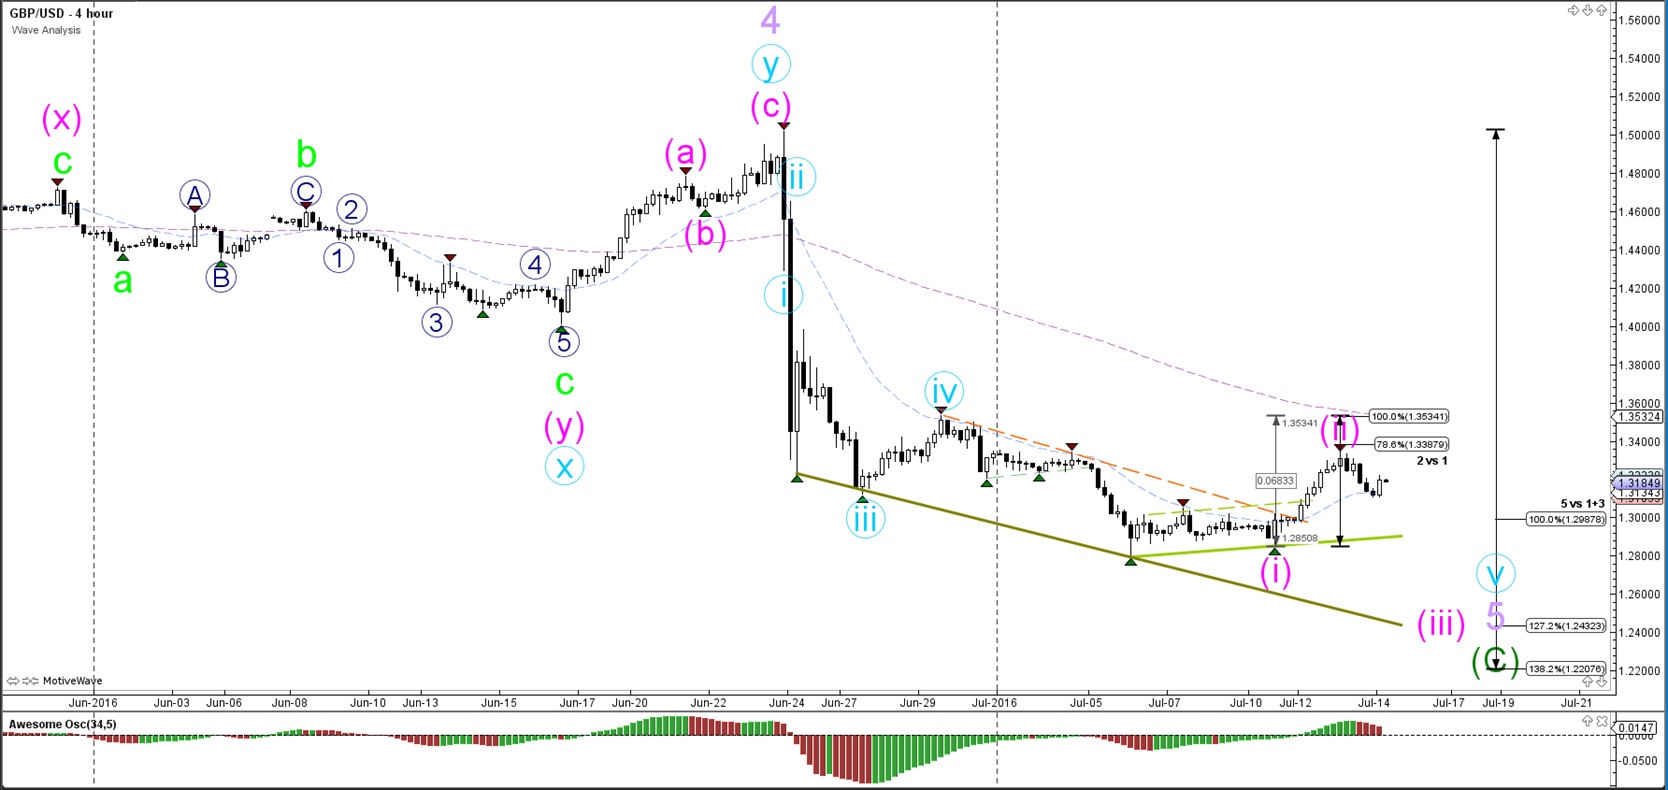
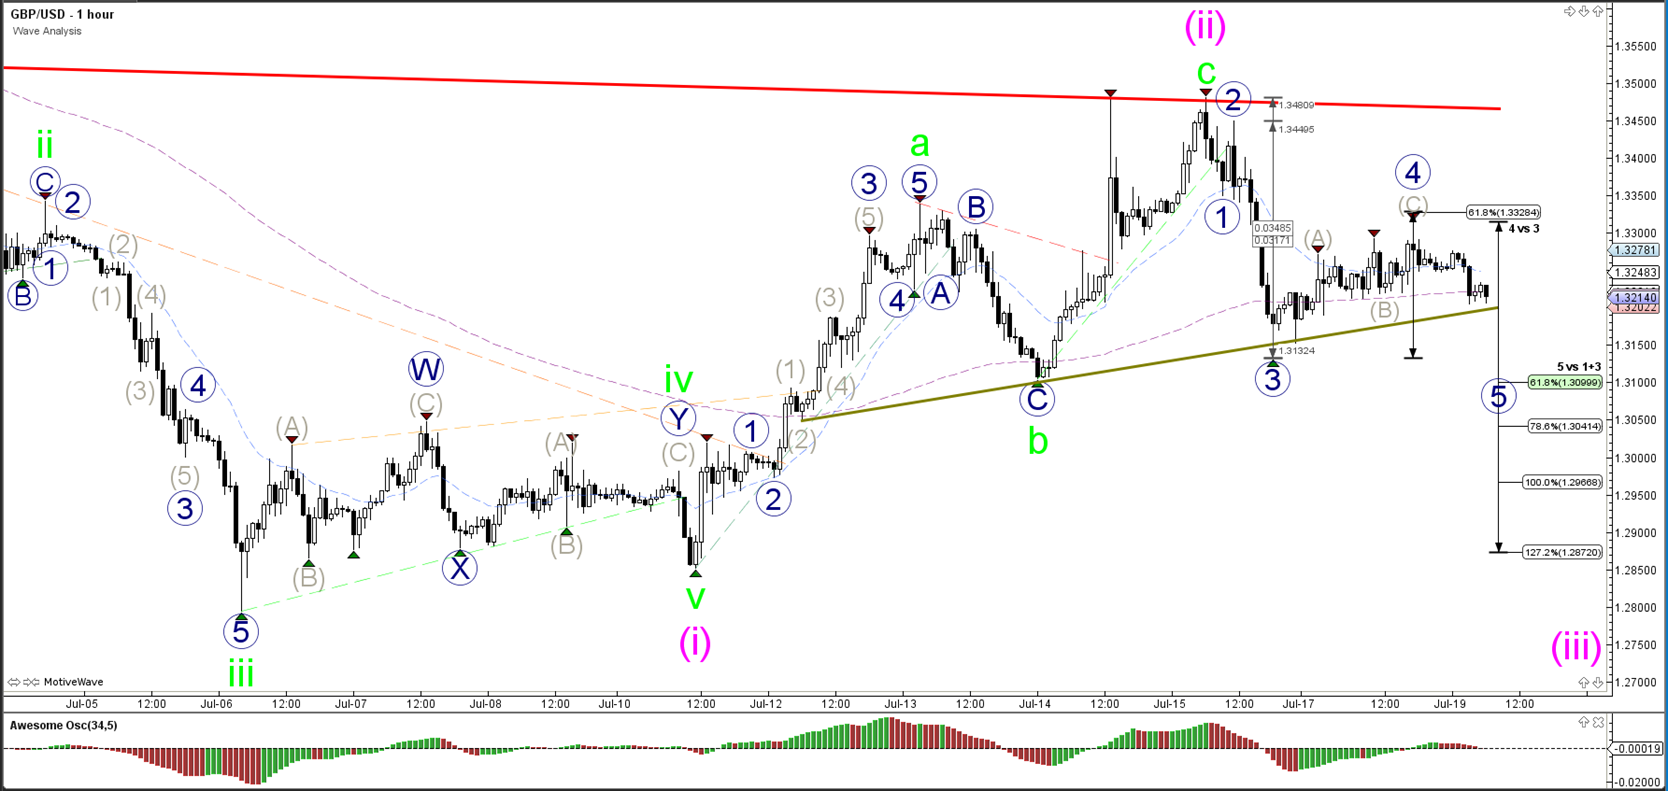
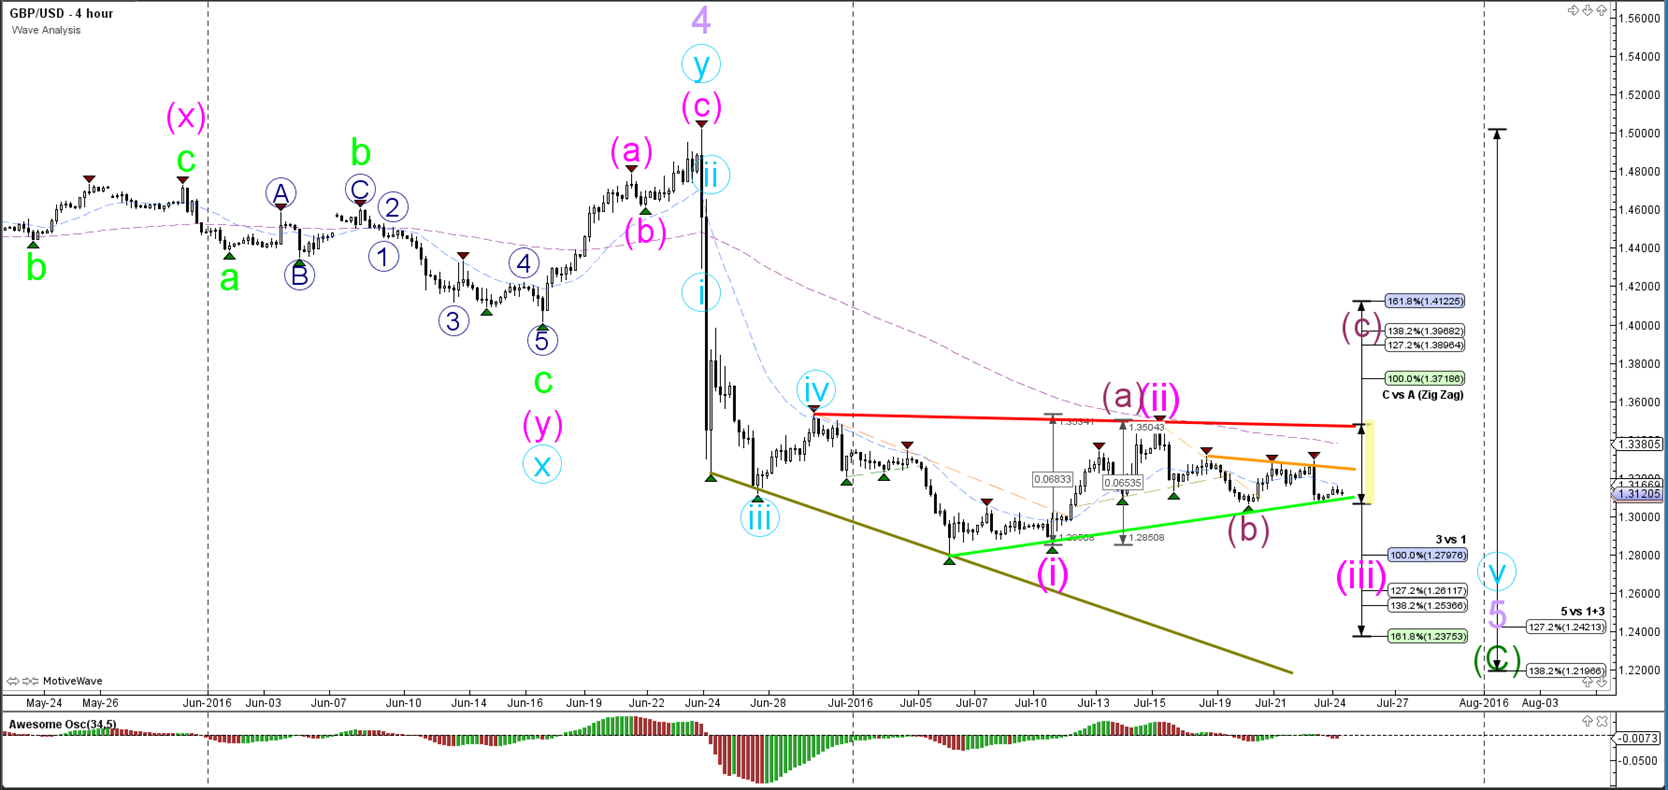
GBP/USD
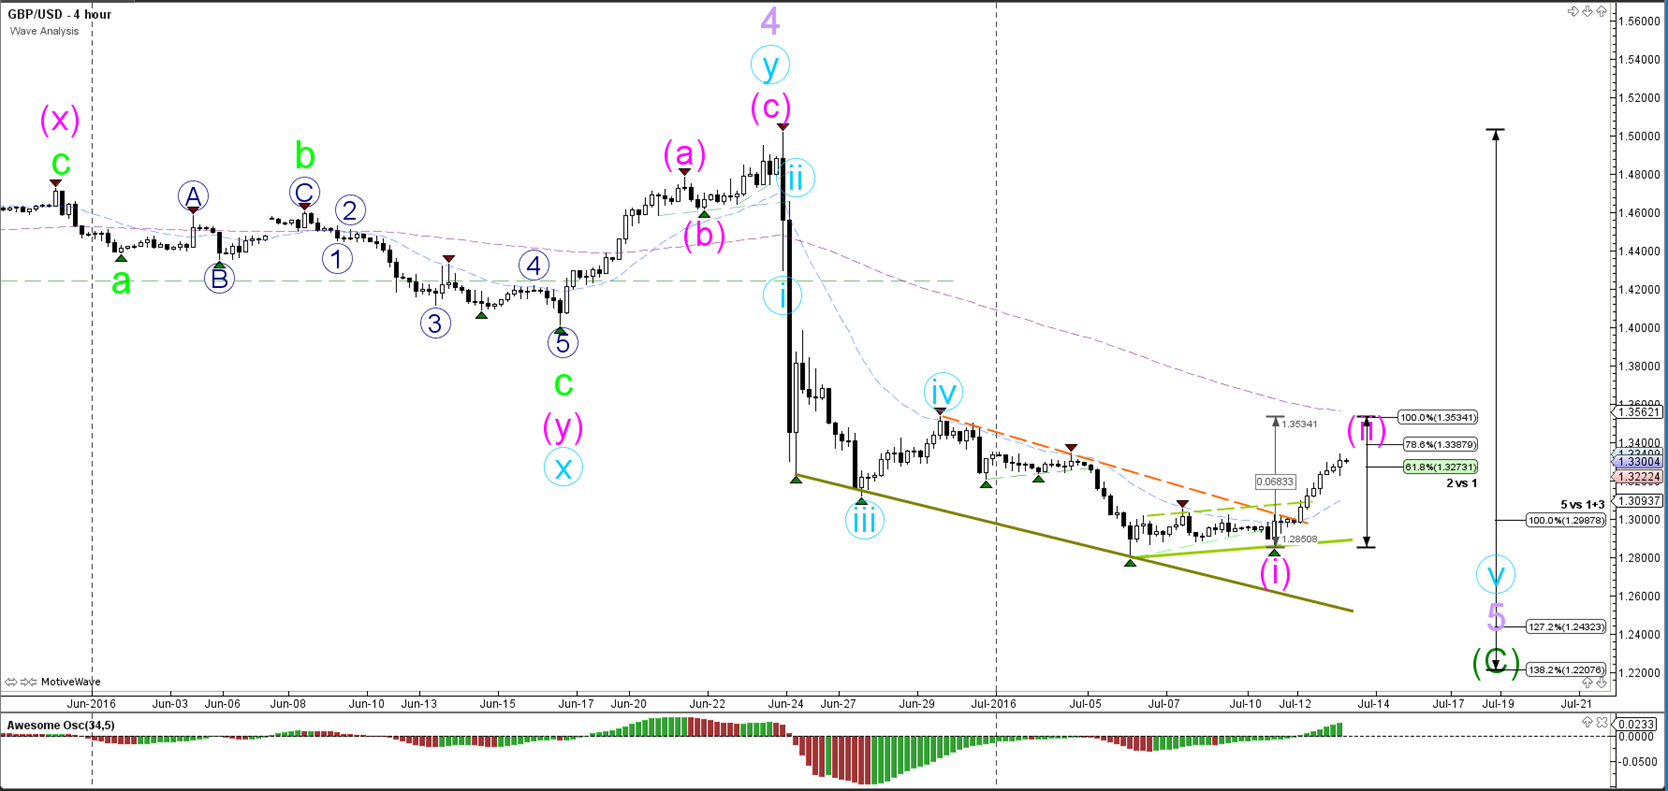
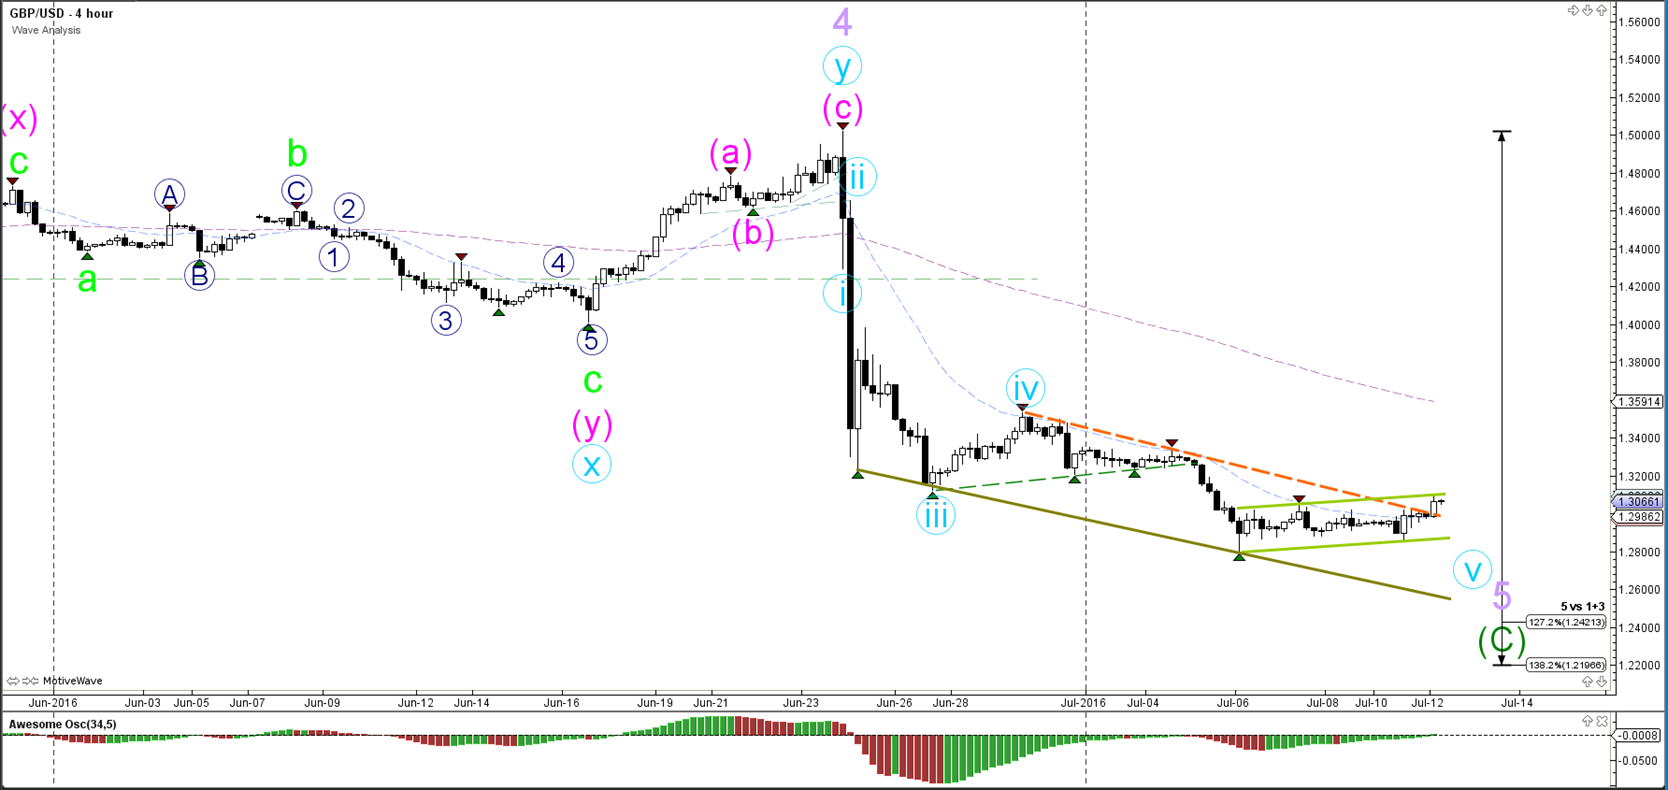
4 hour

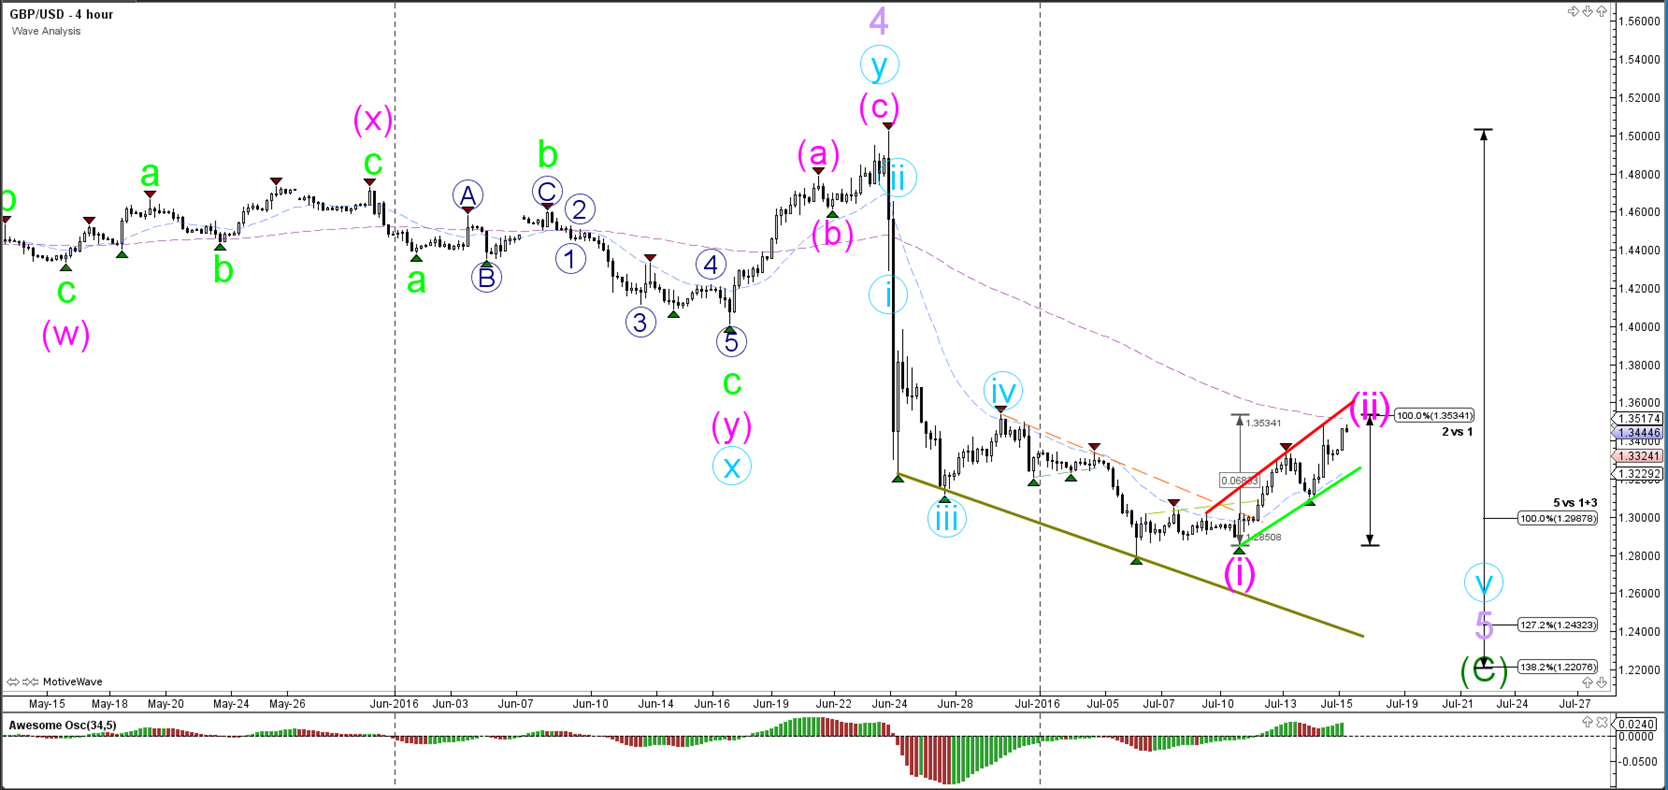
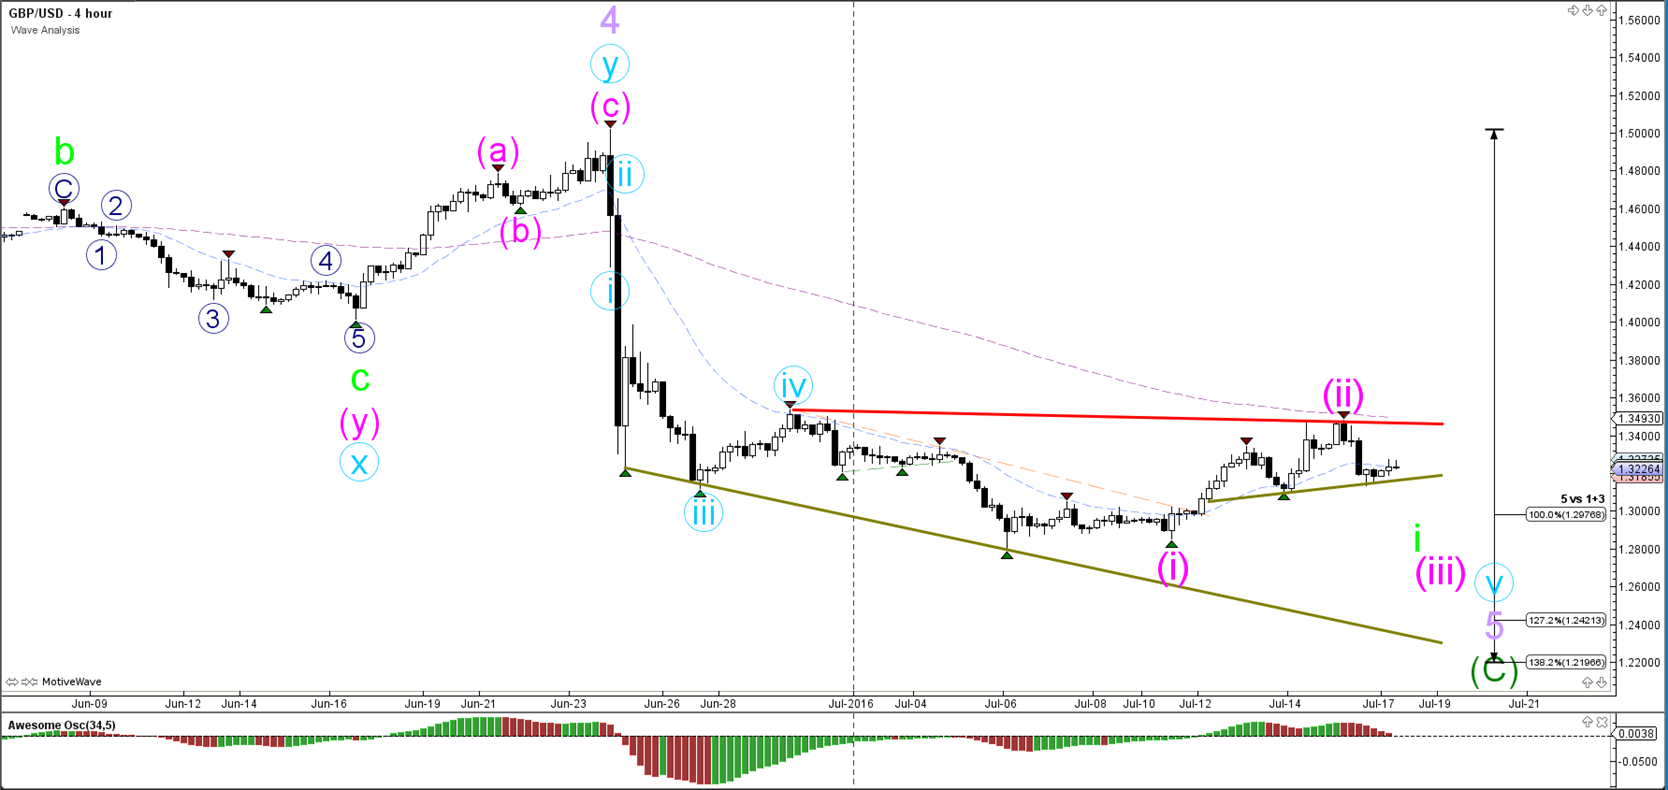
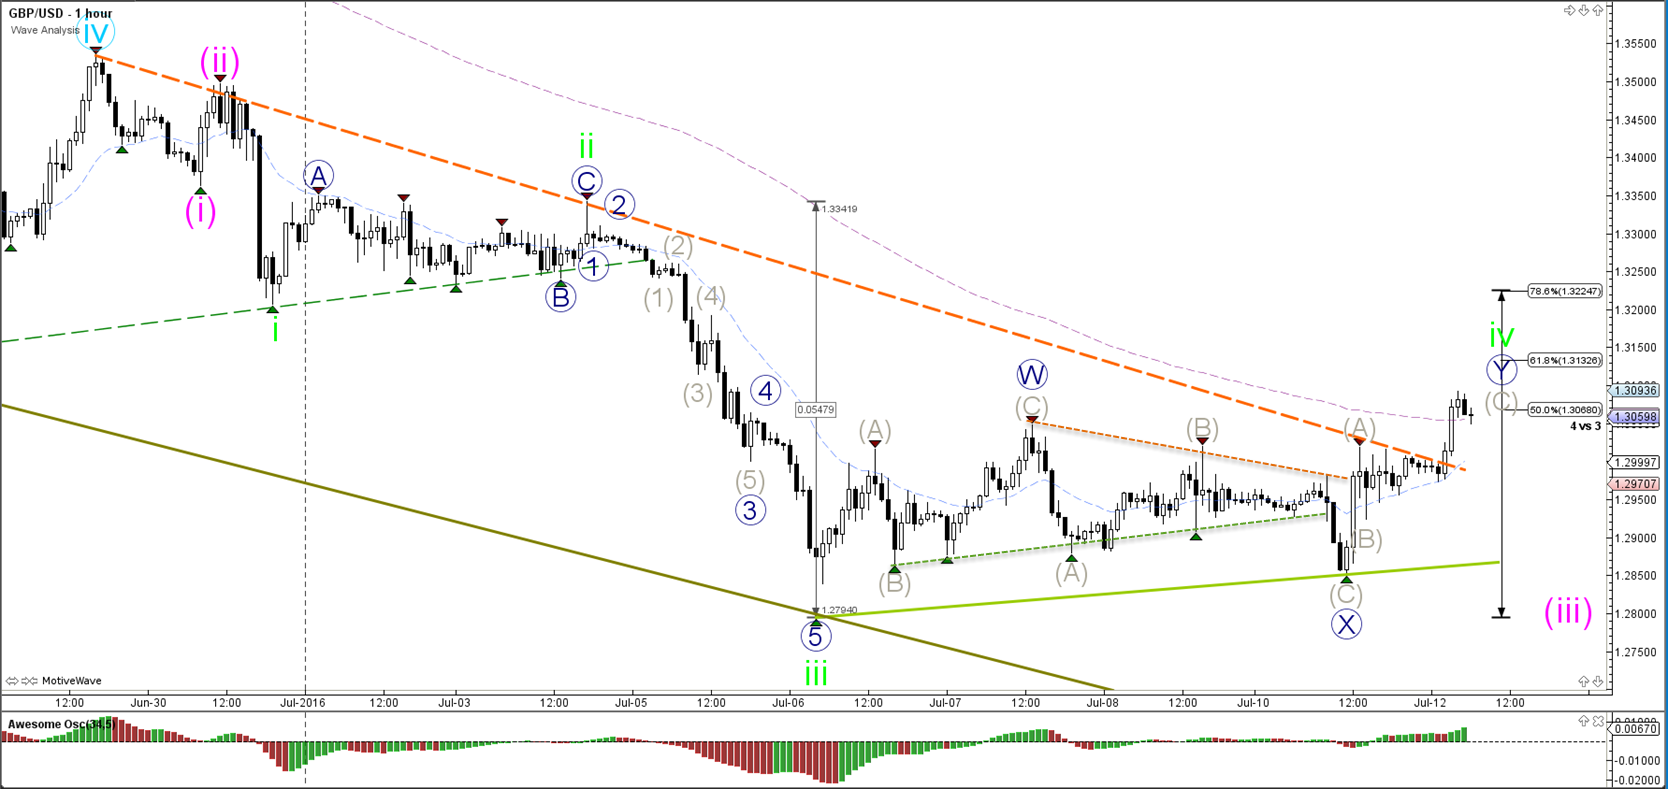
The GBP/USD broke the resistance trend line (orange) of the downtrend channel, but this could be explained by a larger consolidation such as a bear flag. This chart pattern is indicated by the green lines and is bearish continuation signal unless price breaks above it.
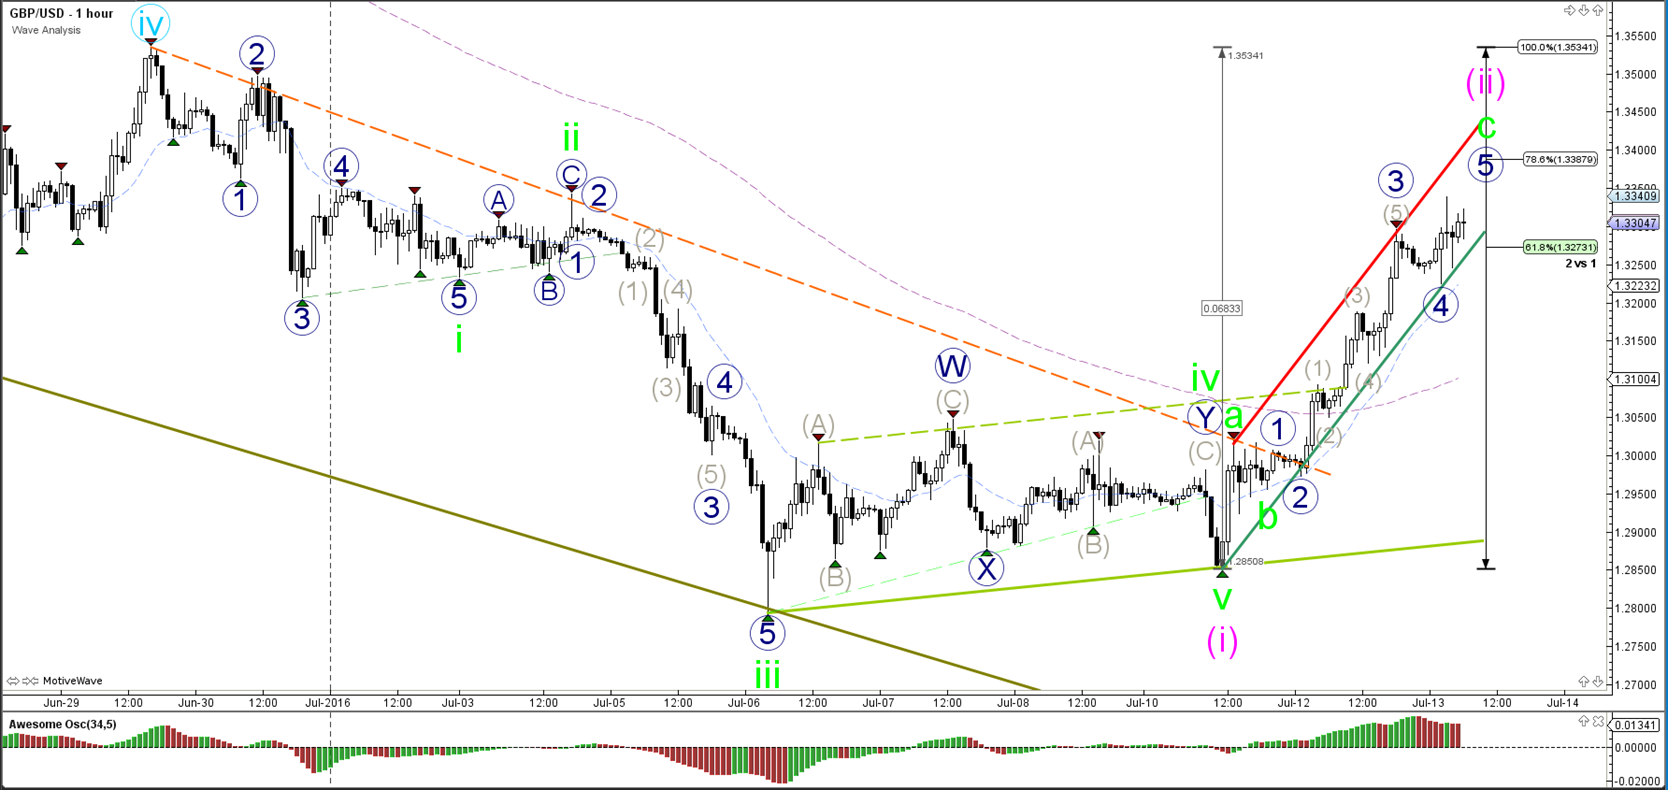
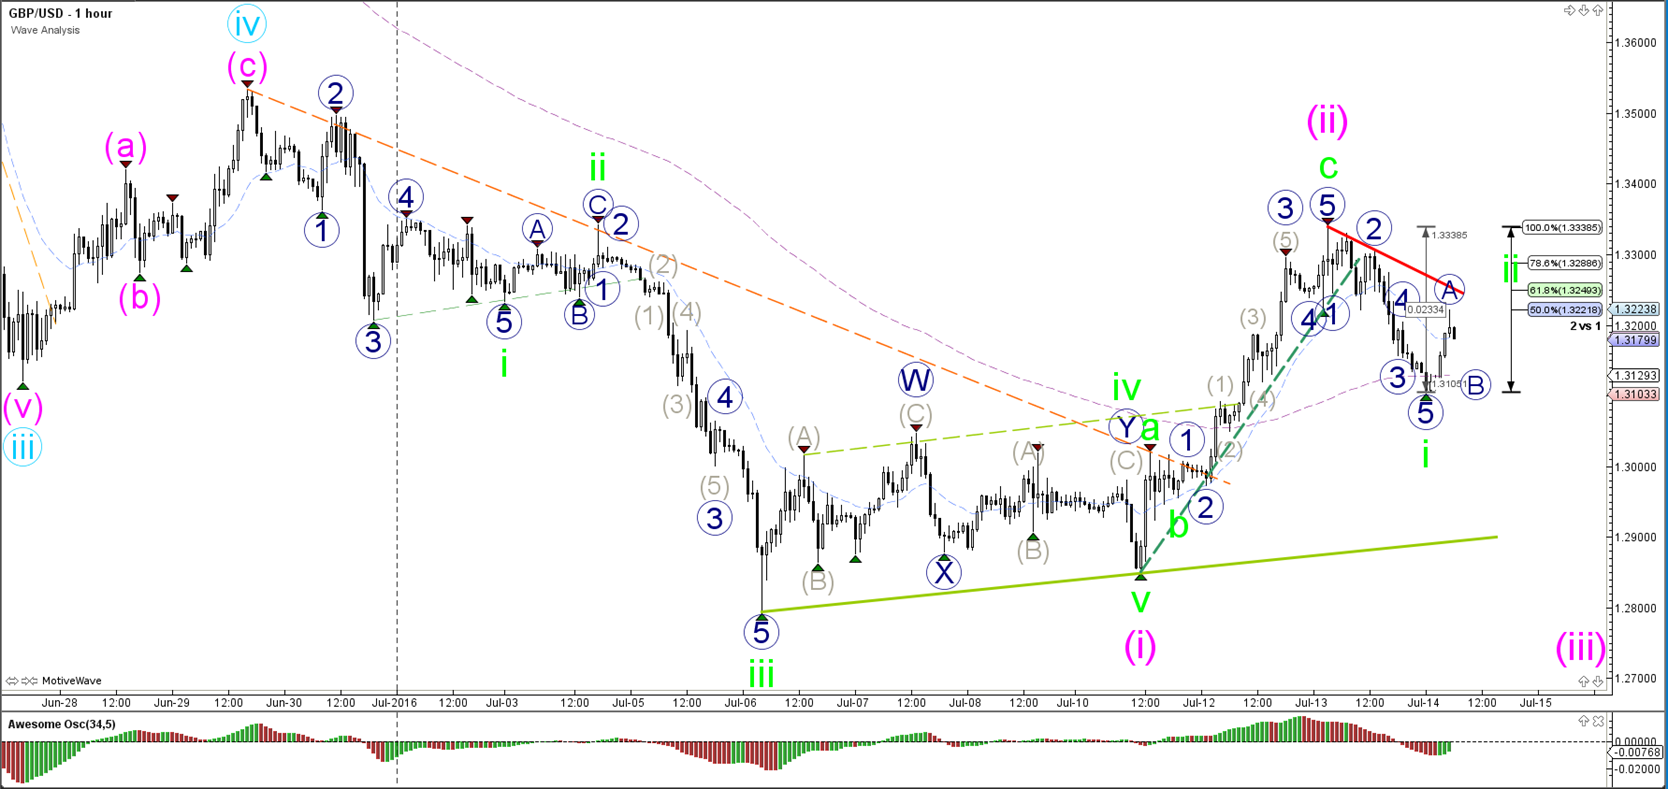
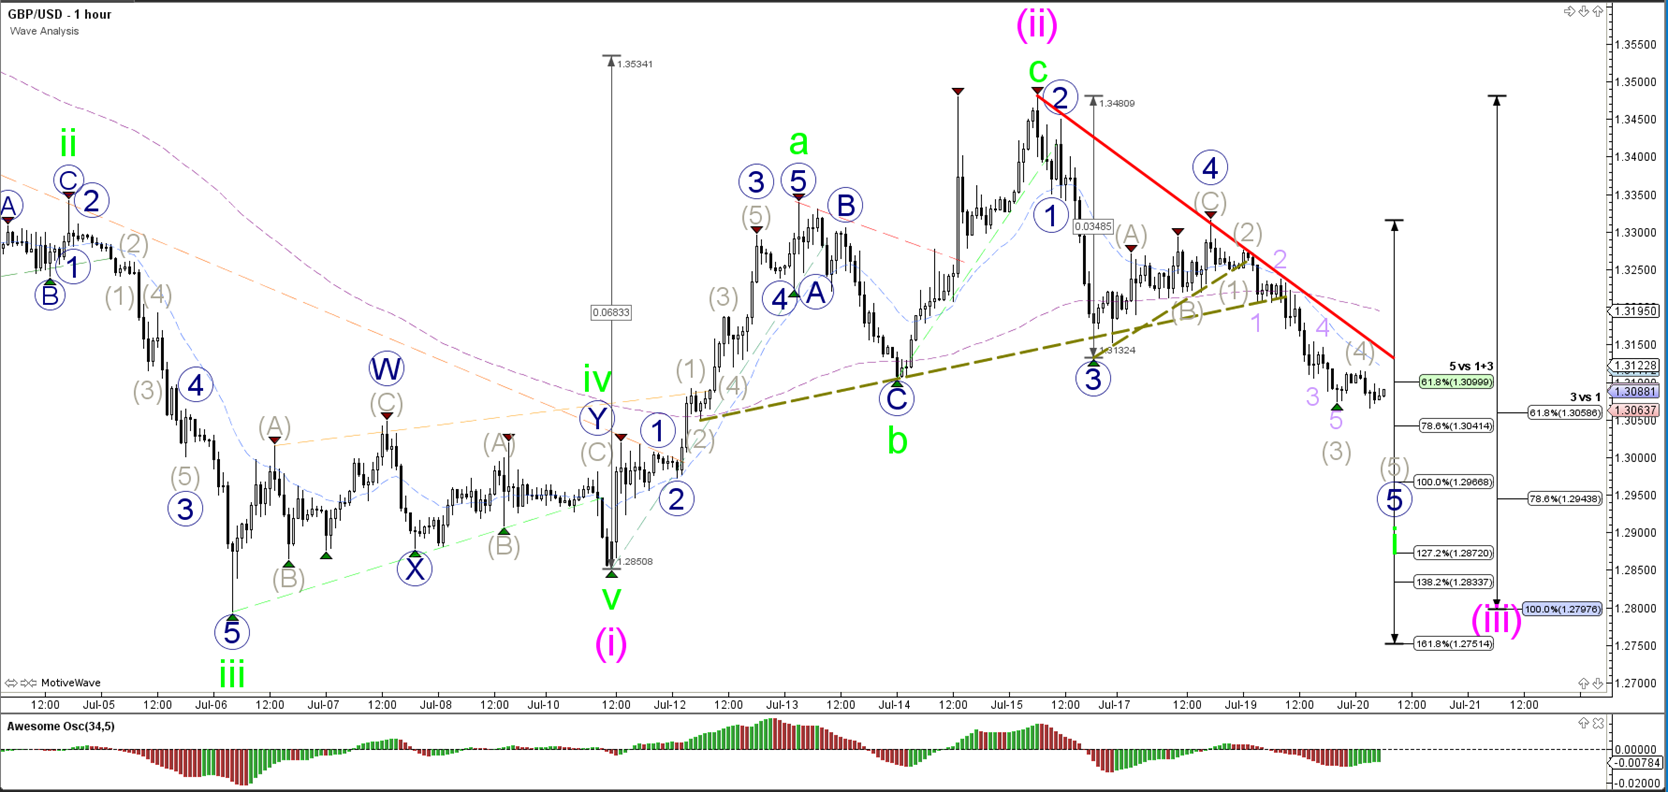
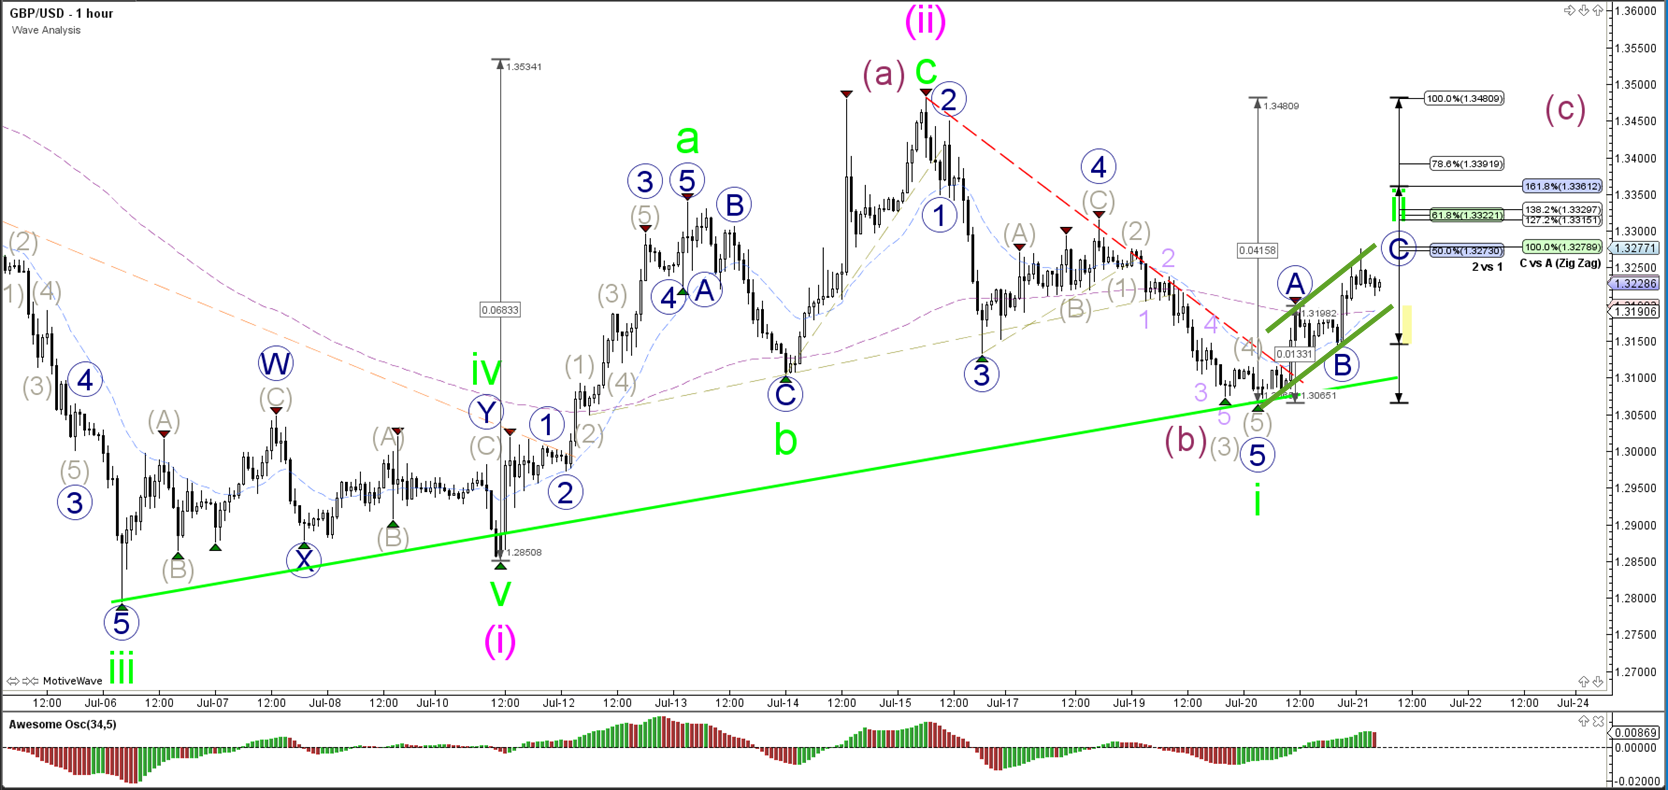
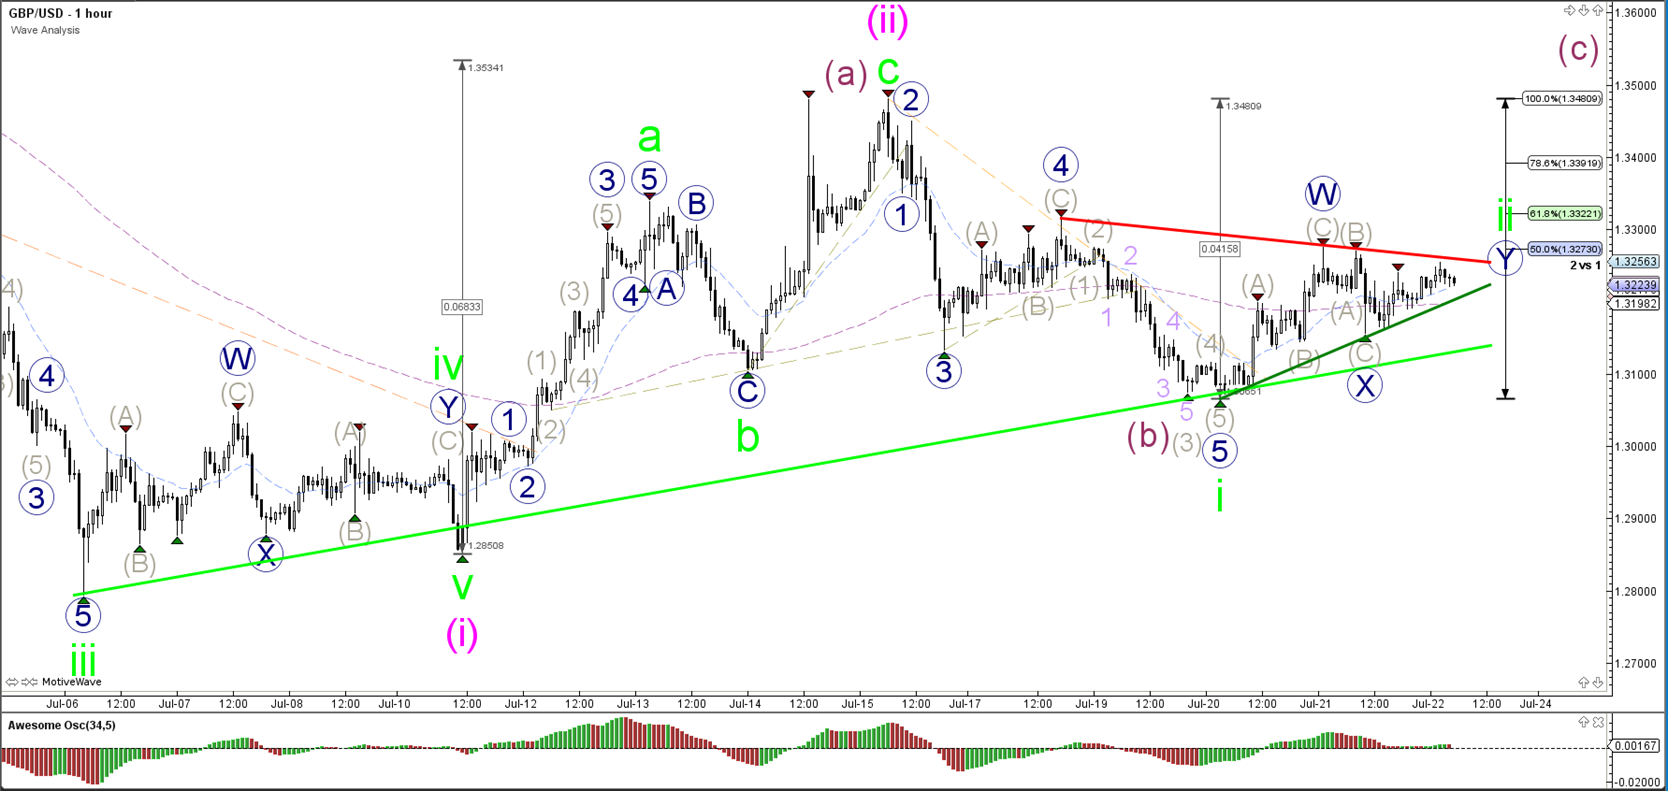
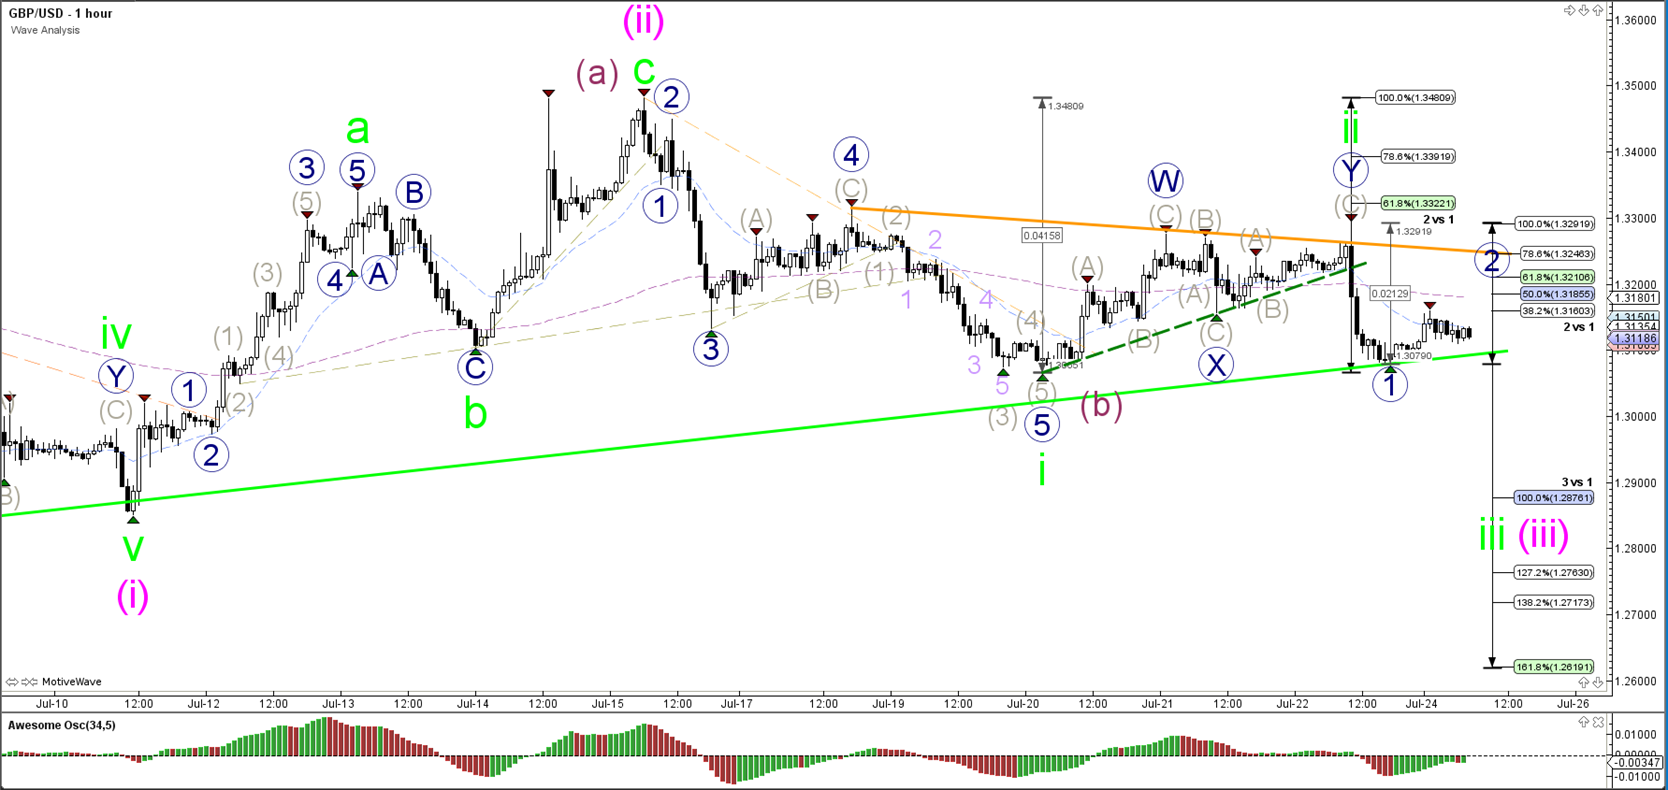
1 hour

The GBP/USD seems to be building a bullish ABC zigzag (grey) within the wave 4 (green).
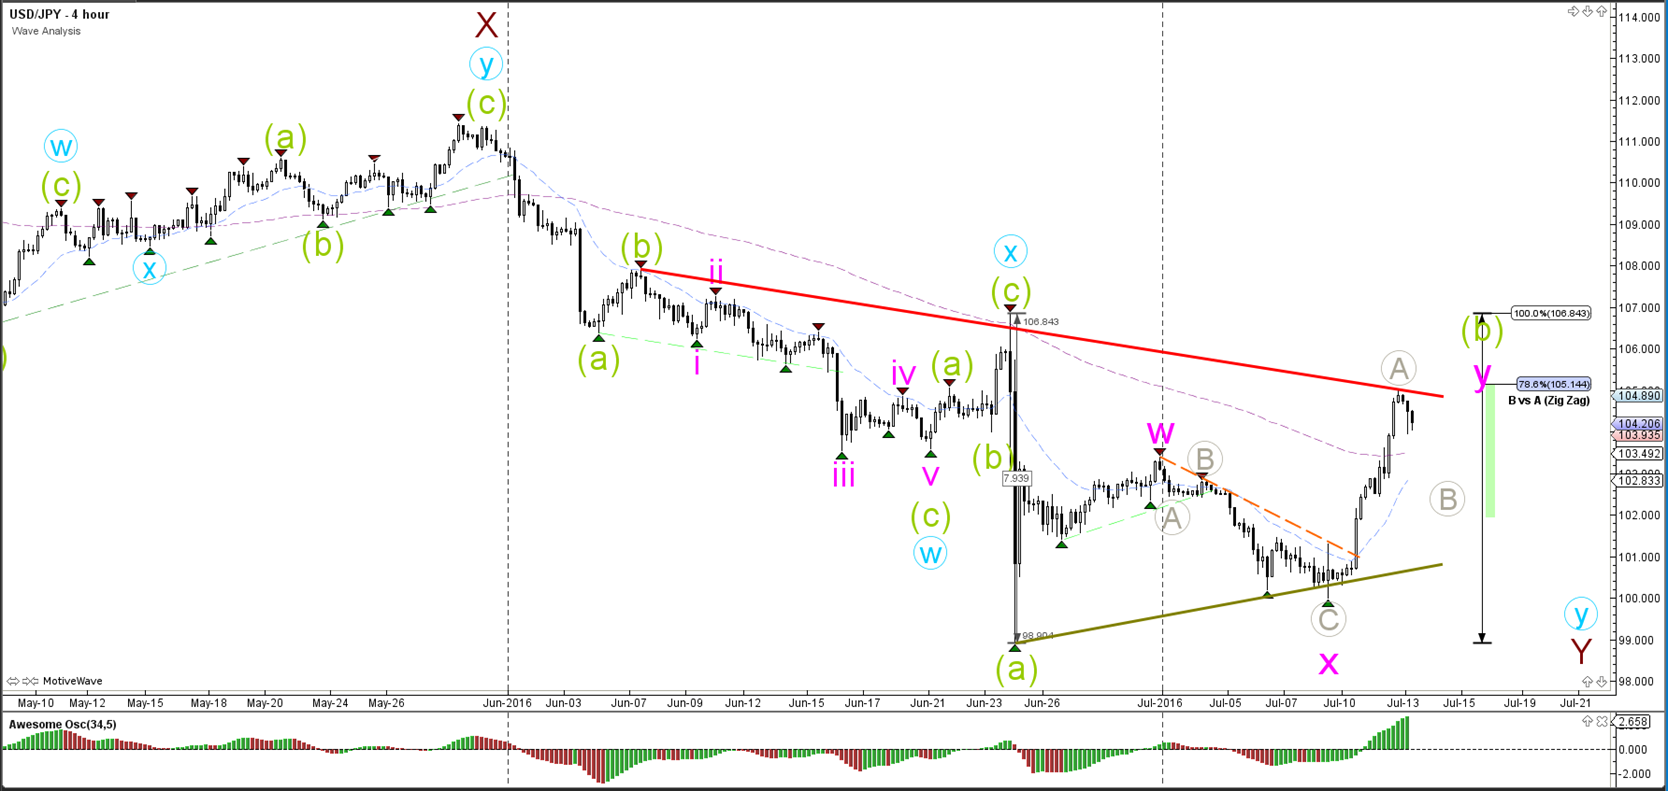
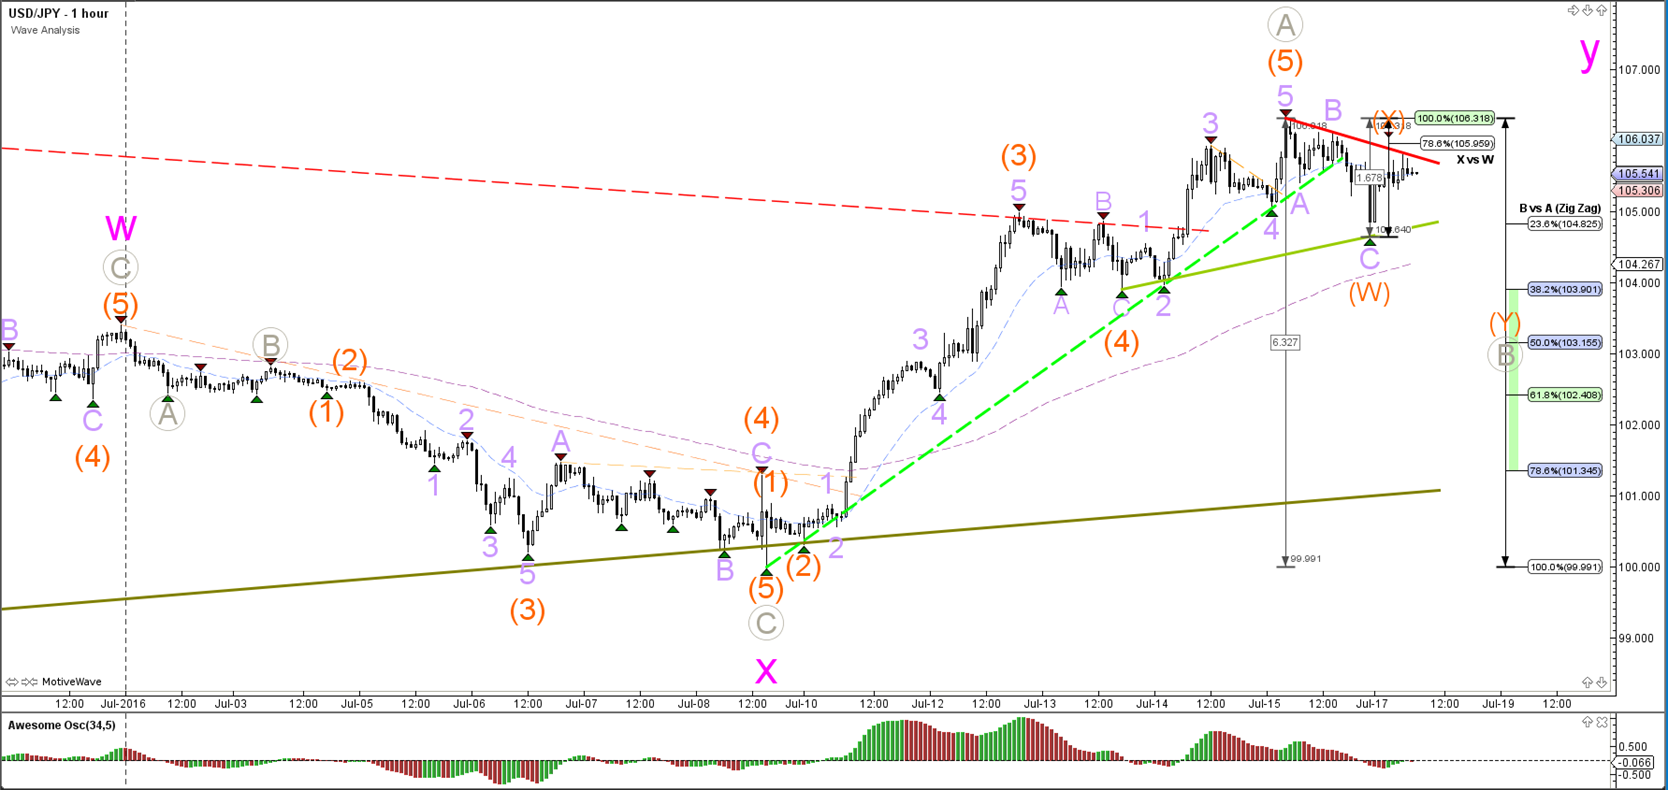
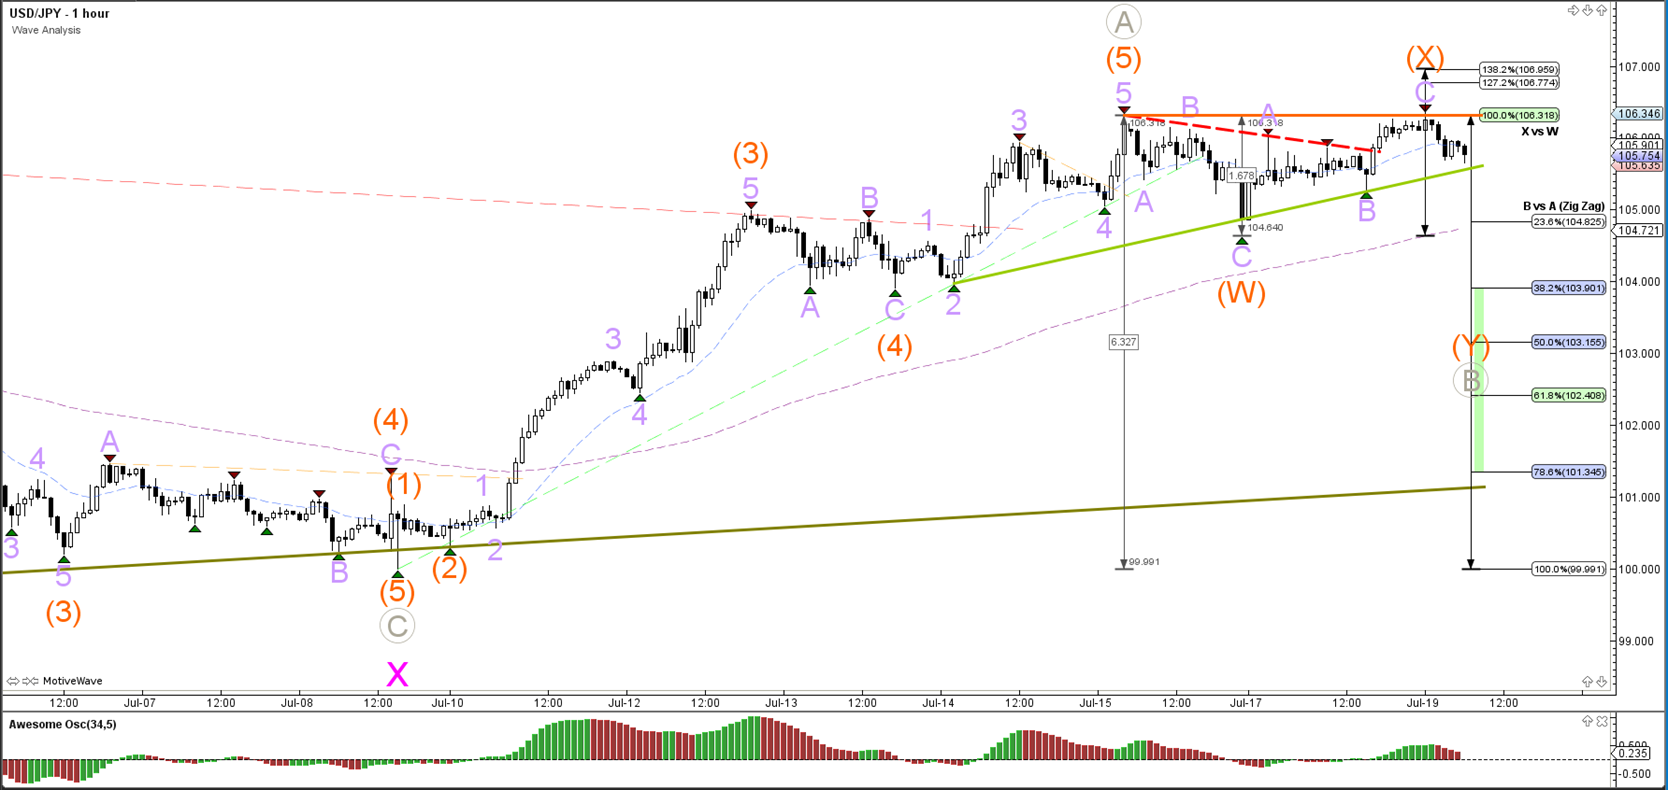
USD/JPY
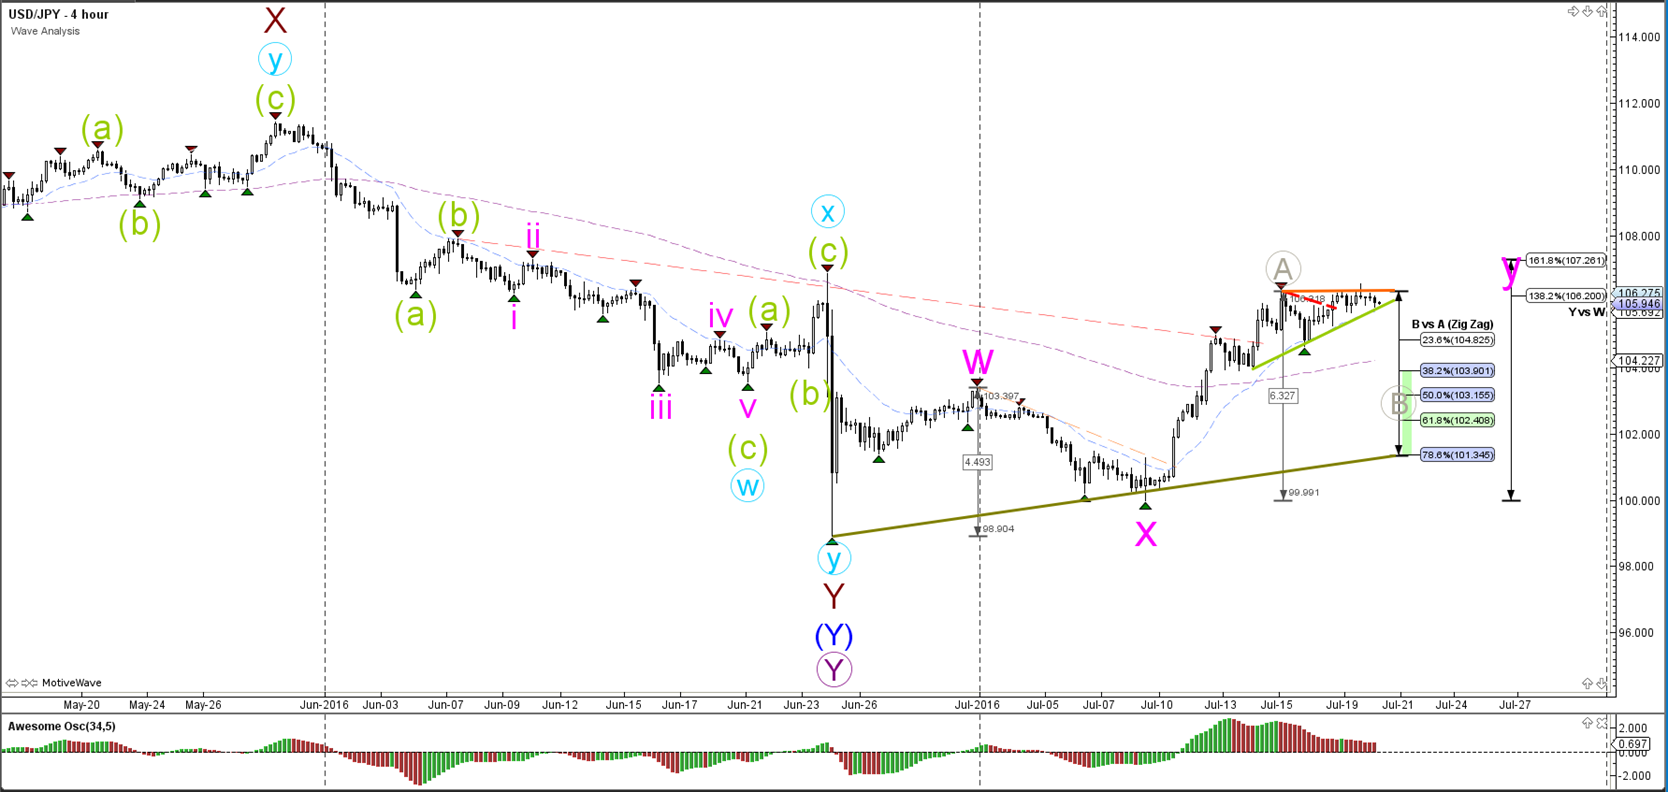
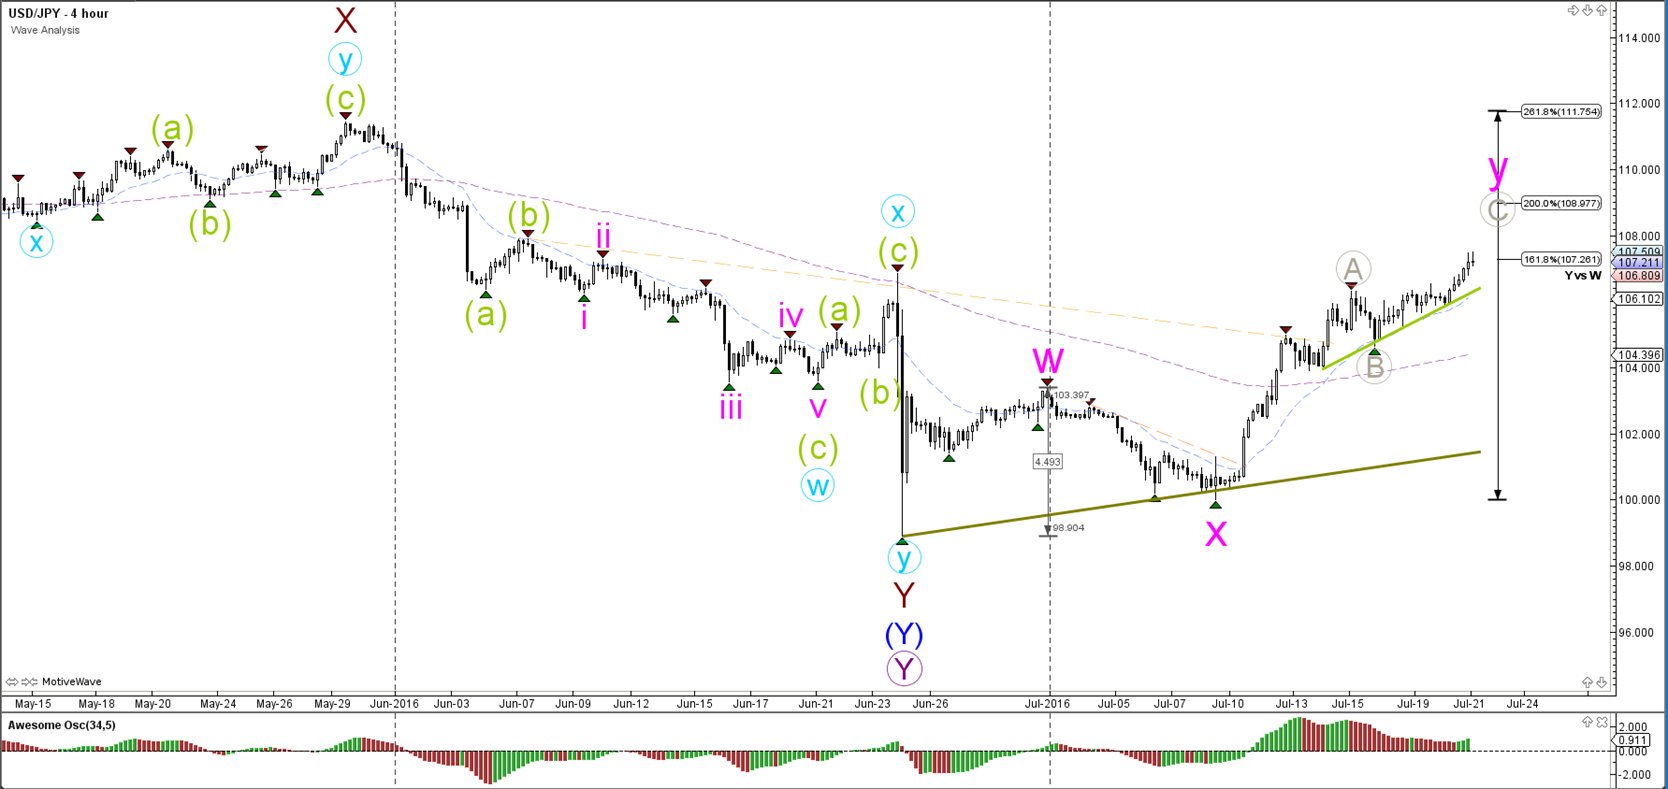
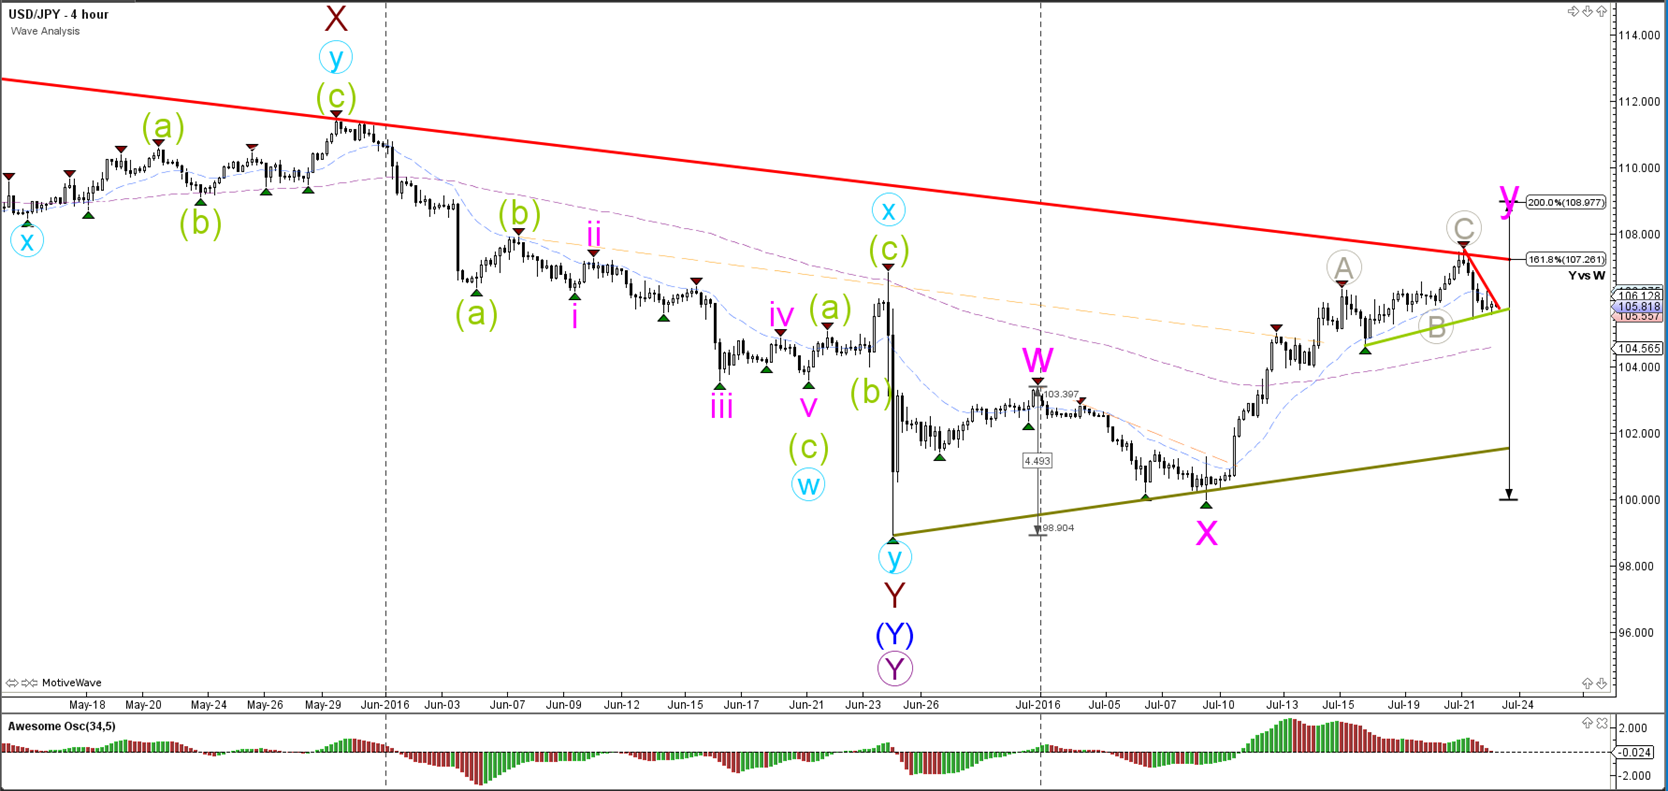
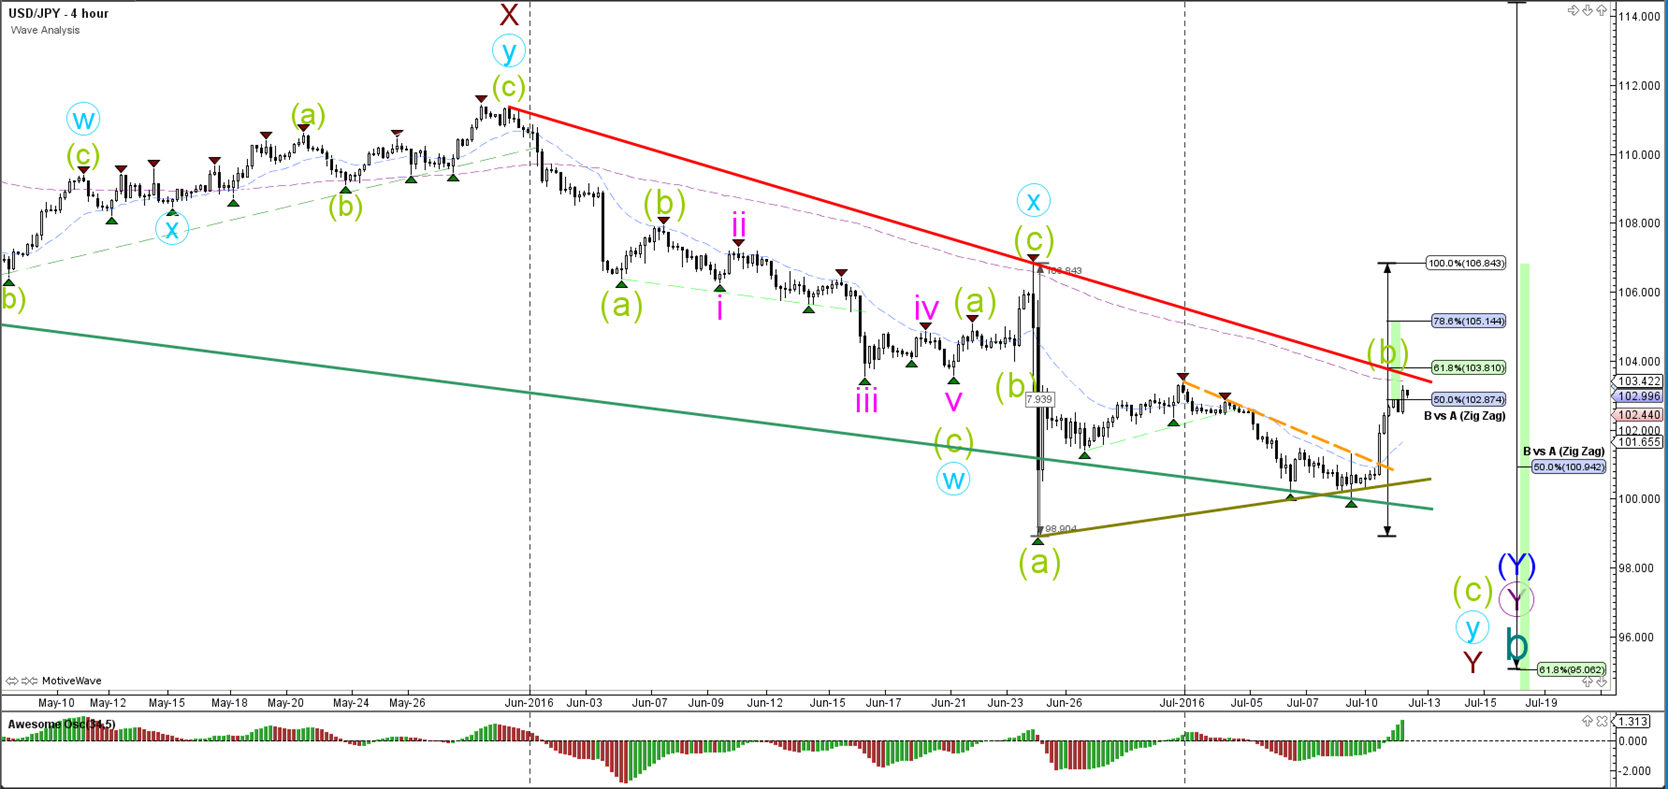
4 hour

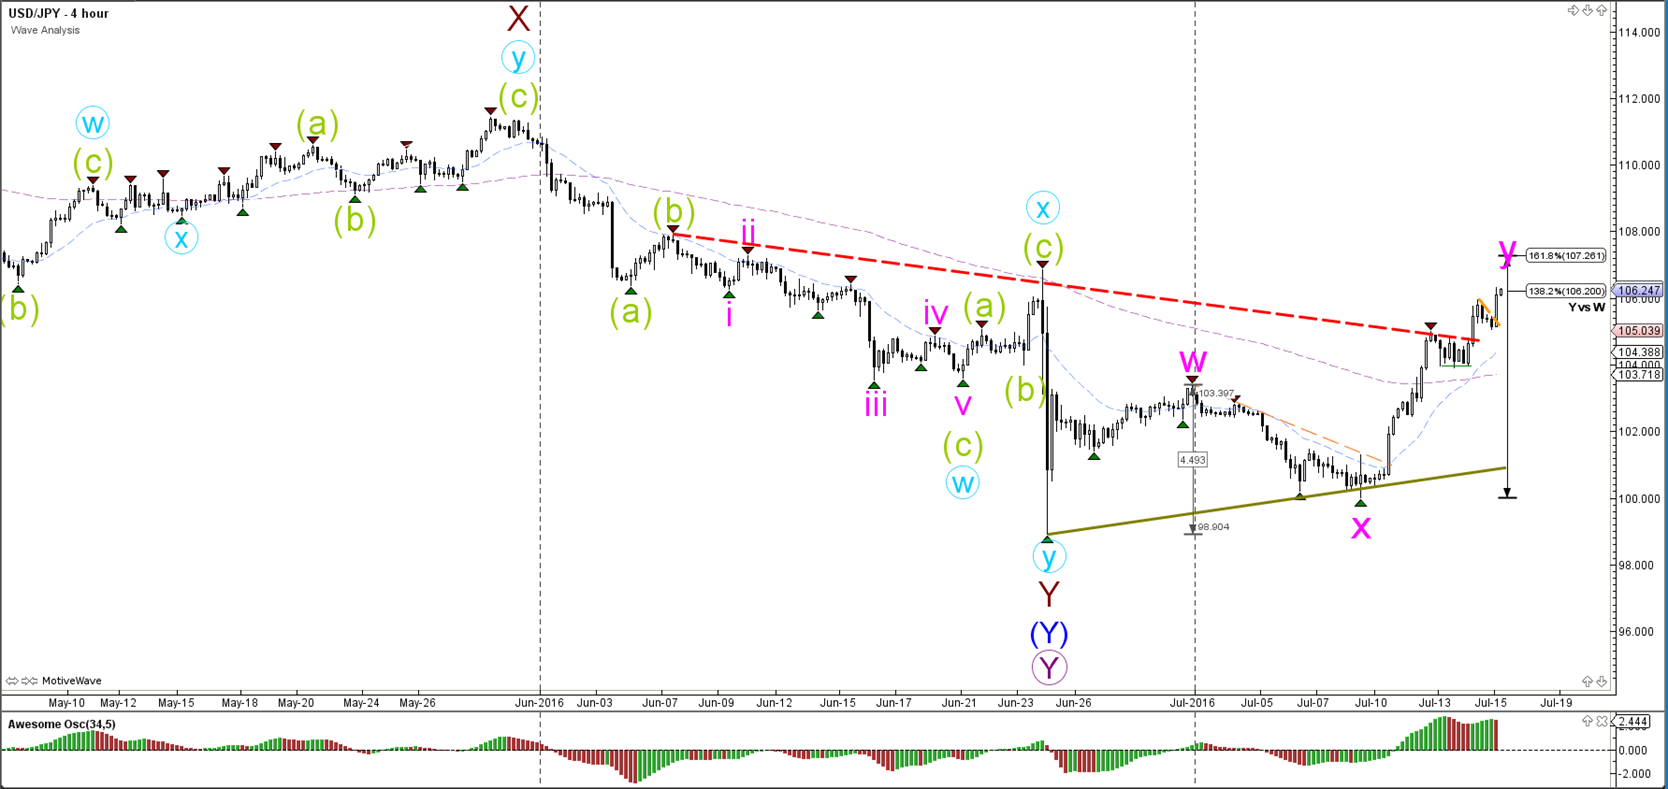
The USD/JPY broke above the resistance trend line (orange) and is expanding the wave B (green) correction unless price breaks above the 100% Fibonacci level.
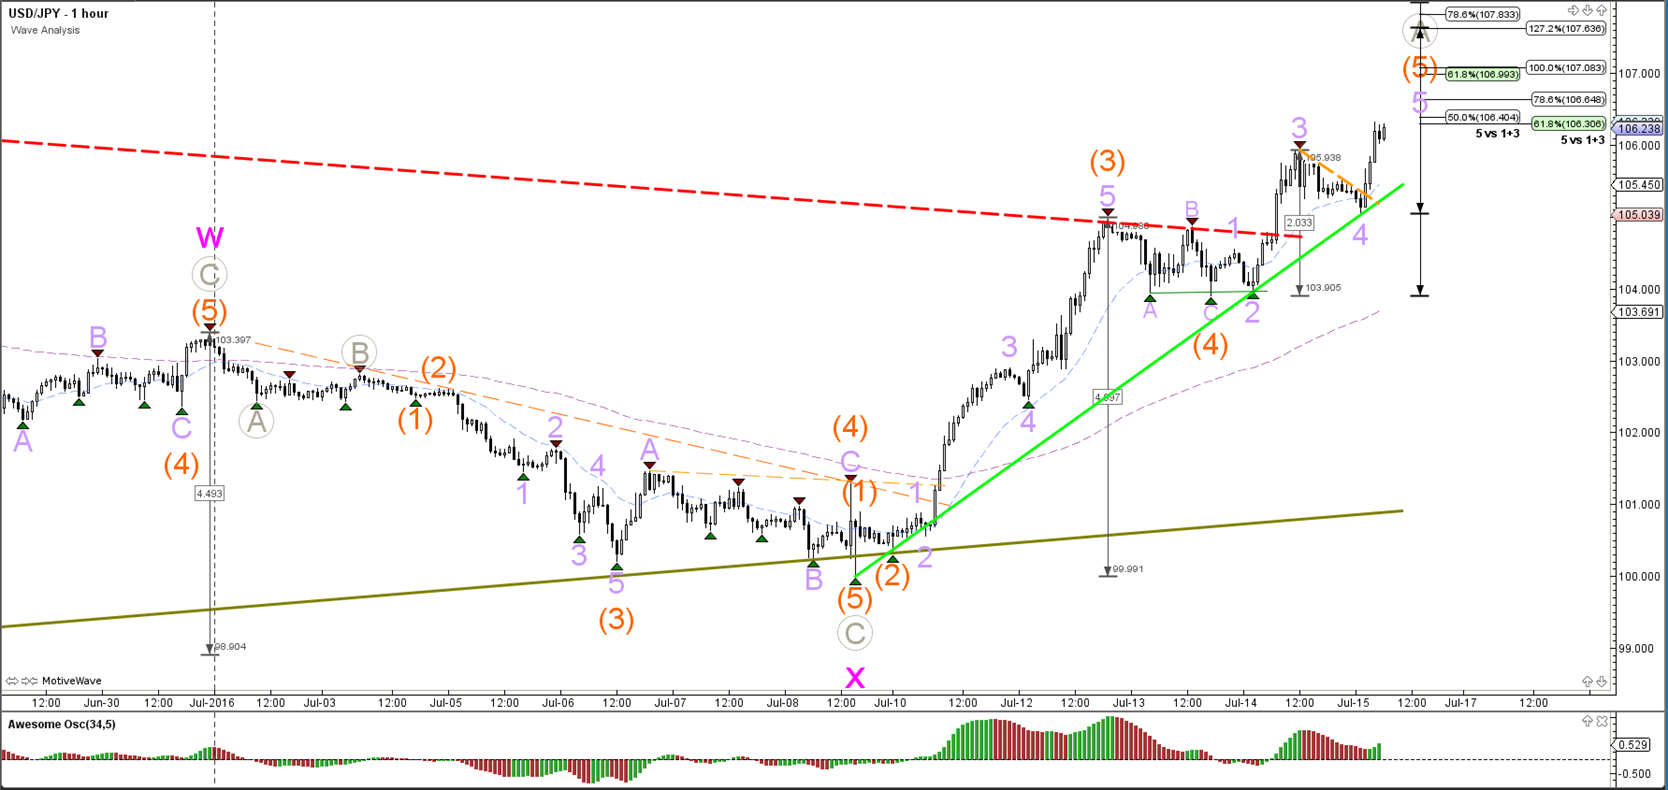
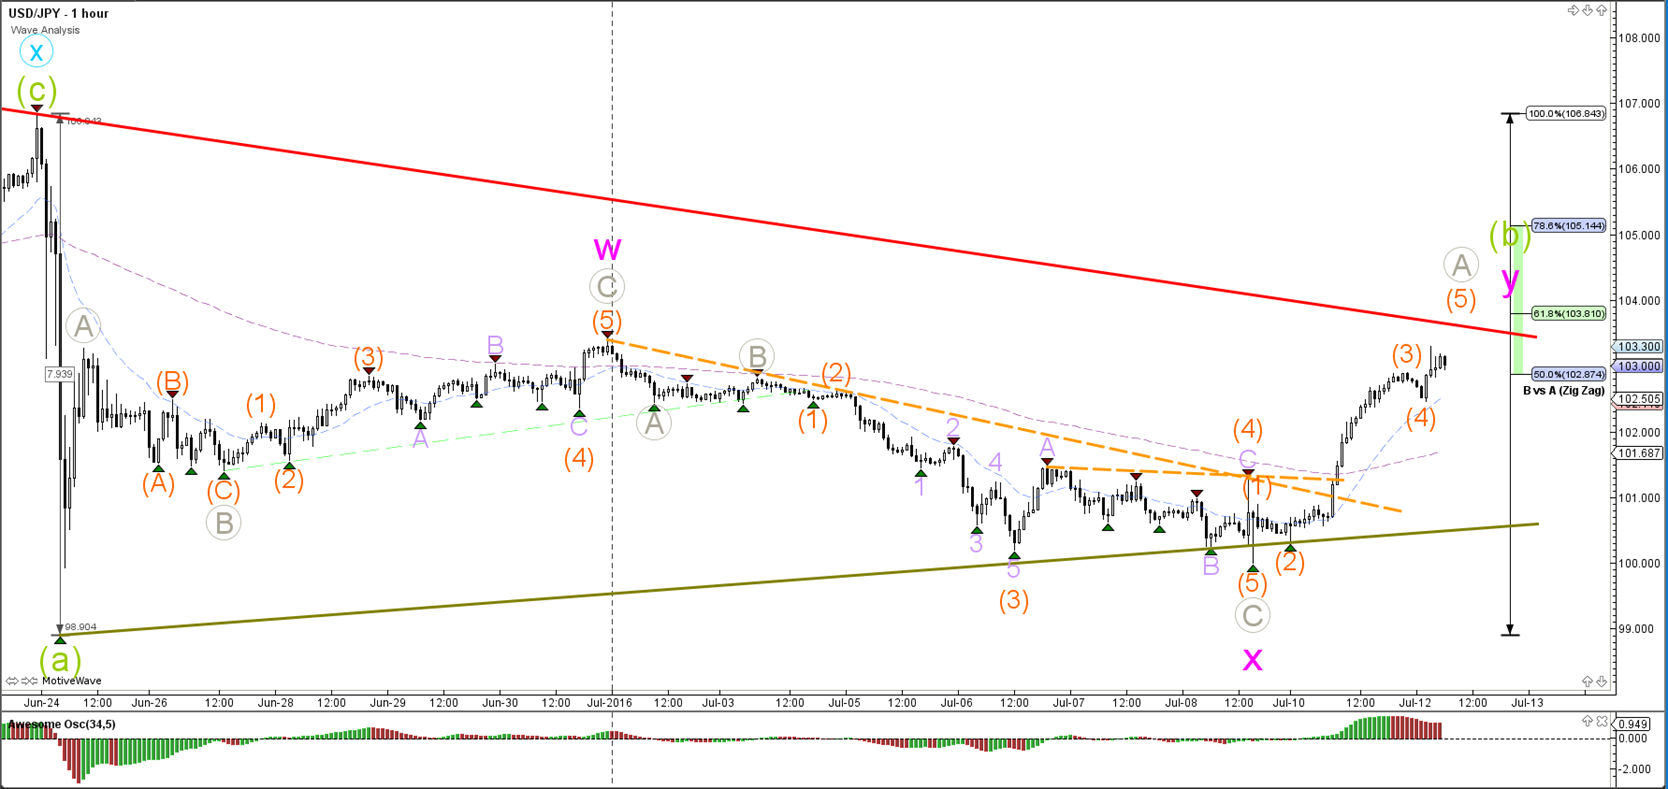
1 hour

The USD/JPY bullish breakout has strong momentum pushing it which seems to be a wave 3 (orange). A larger ABC (grey) seems the most likely unless price breaks below the support trend line (green).
“Original analysis is provided by Admiral Markets”
EUR/USD
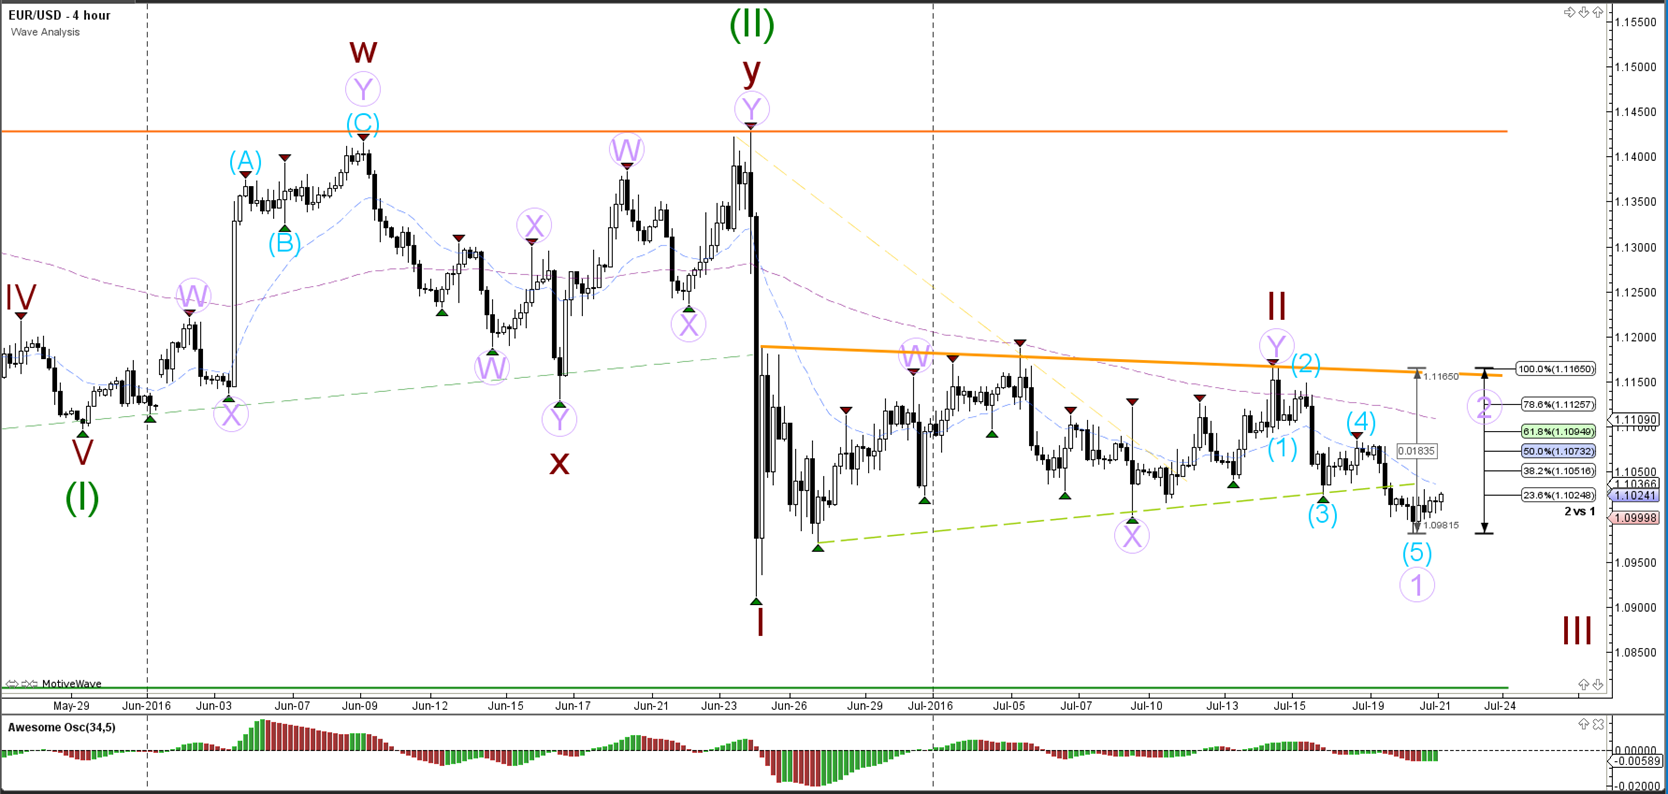
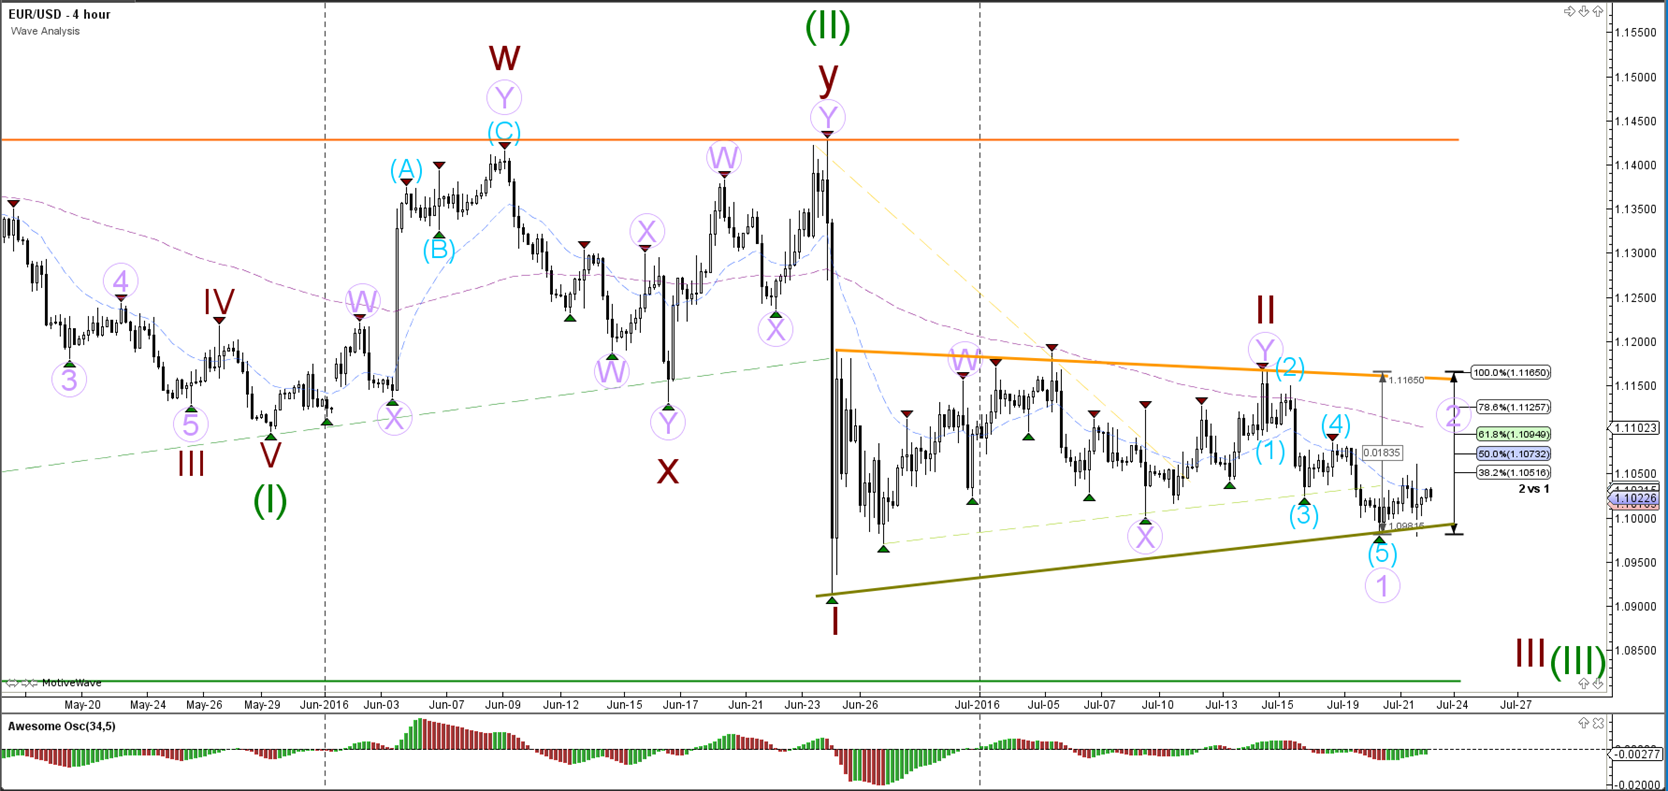
4 hour

The EUR/USD is bouncing at the support levels (green) of the larger consolidation zone (orange/green). The correction is most likely part of a larger wave 2 (brown) via a WXY (purple). Price needs to break below the support (green lines) levels before a wave 3 (green) continuation is likely whereas a break above the 100% Fib at 1.1428 invalidates wave 2 (brown).
1 hour

A bullish ABC (blue) zigzag is taking place within wave 2 (brown).
GBP/USD
4 hour
The GBP/USD broke the resistance trend line (orange) of the downtrend channel, but this could be explained by a larger consolidation such as a bear flag. This chart pattern is indicated by the green lines and is bearish continuation signal unless price breaks above it.
1 hour
The GBP/USD seems to be building a bullish ABC zigzag (grey) within the wave 4 (green).
USD/JPY
4 hour
The USD/JPY broke above the resistance trend line (orange) and is expanding the wave B (green) correction unless price breaks above the 100% Fibonacci level.
1 hour
The USD/JPY bullish breakout has strong momentum pushing it which seems to be a wave 3 (orange). A larger ABC (grey) seems the most likely unless price breaks below the support trend line (green).
“Original analysis is provided by Admiral Markets”