HubuFX Sharing Trading Ideas

HubuFX

HubuFX Representative
Messages
36
USDCHF Analysis: Bearish Trend and Potential Price Correction

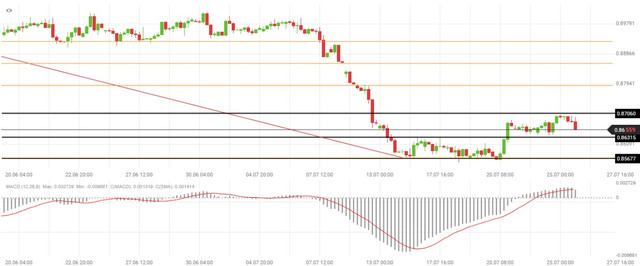
The USDCHF currency pair is currently trading sideways between the lower low at 0.8567 and the lower high at 0.8631. The trend direction is strongly bearish in favor of the Swiss franc, with the MACD signaling an enormous divergence. Since the price action does not show strength in rising, it is likely that we will see a sideways trend and a correction to upper levels. If the price remains stable above 0.8567, it may lead to a price correction at higher levels around the 23.6 Fibonacci retracement level at 0.8706.

usdchf_1.jpeg


On the other hand, if the minor support at 0.8567 breaks, the bearish bias will probably resume. The next supply area is located approximately 300 pips away, around 0.8293. In this scenario, it is possible that the downtrend may continue in the upcoming days.​


What is MACD Divergence?

In forex trading, divergence refers to a situation where the price of a currency pair is moving in the opposite direction of a technical indicator, such as the MACD or RSI. This can signal an imbalance between price and the oscillator, which may indicate an impending directional change in price. There are two types of divergences: regular divergence and hidden divergence. Each type of divergence can contain either a bullish or bearish bias.​
 
Silver: Bulls on the Prowl

Silver prices have been on the rise in recent days, trading above support at $24.53 for the third consecutive day. This has created a new higher low, which is a bullish technical signal. The price also tested support on July 17th and formed a long wick shadow candle, which indicates that bulls are pressing to push the price higher.

The next resistance level to watch is around $26.12. If silver can break above this level, it could signal the start of a new uptrend. However, if the price breaks below support at $24.53, it could indicate that the bullish trend is on hold. In this case, traders should monitor the price action closely before making any new decisions.

silver.jpg


Fundamentally, the outlook for silver is also bullish. The global economy is growing, which is increasing demand for industrial metals like silver. Additionally, the recent sell-off in the stock market has led investors to seek out safe-haven assets like silver.​


About RSI Indicator

RSI stands for Relative Strength Index. It is a tool that measures the speed and change of price movements of an asset. It ranges from 0 to 100. When RSI is above 70, it means the asset is overbought and may be due for a pullback. When RSI is below 30, it means the asset is oversold and may be due for a rally.

RSI is a popular tool among technical analysts. It is easy to use and can be helpful in identifying potential trading opportunities. However, it is important to remember that RSI is not a foolproof indicator. It is always advisable to use RSI in conjunction with other technical indicators and fundamental analysis.​
 
GBPJPY: Wait for 179 Support Before Making a New Decision

The GBPJPY currency pair is trading in a narrow declining channel near the support at 179.5. A hammer candle stick indicates that the market is keen to push the price higher, but the bulls were unsuccessful in breaking the minor resistance at 180.6. HubuFX analysis team suggests waiting for the price to test the 179.5 support for a double bottom pattern. If the pair holds above this level, it is likely to target 182.12 followed by 184. Therefore, both sellers and buyers of the currency pair should be patient and carefully monitor the price action behavior near the support before making a new decision. The currency pair is likely to trade in the range between 179.5 and 182.1 today.

However, if the bears succeed in breaking the aforementioned support, the GBPJPY decline is likely to continue.

gbpjpy.jpg


Fundamental Analysis

There are a few major economic releases scheduled for tomorrow July 21, 2023, which could influence the pair. These include:​
  • GBP: GFK consumer confidence​
  • GBP: Retail sales data​
  • JPY: Core inflation rate​
  • JPY: Inflation Rate​
 
Bulls Stabilize USDJPY Above Key Support Level

The USDJPY currency pair has recently retested the 23.6% Fibonacci retracement level. Despite this retest, the bulls have managed to stabilize the price above the minor support level of 139.4. This stabilization is a positive sign for traders who are bullish on the pair. If the price can hold above the aforementioned support level, it is likely to target the next support level at 140.9 in the following trading sessions. This would represent a continuation of the bullish trend and could provide further opportunities for traders to enter long positions.

The MACD indicator is currently trading above its signal line, which is typically considered a bullish sign. This suggests that the underlying asset may be experiencing upward momentum and could continue to rise in price.

usdjpy-hubufx.jpg


On the other hand, if the minor support at 139.4 breaks, it could signal a resumption of the decline. In this scenario, the price could retest the next support level at 137.33. Traders who are bearish on the pair may look to enter short positions if this support level is broken.​
 
XAUUSD

Gold is currently trading around the support level of $1,963 within an ascending channel. This could be a correction phase of the uptrend that began on June 29, 2023. If the market remains within the channel, it is likely that the upward movement will continue, targeting the previous high of $1,087.

On the other hand, if the bears succeed in pushing the price outside of the rising channel, the correction may continue to a lower support level starting at $1,945. At this time, we suggest monitoring the price action and waiting for a bullish candlestick to emerge before executing a buy order or exiting a sell order.

gold.jpeg


In terms of fundamental analysis, the gold market is currently supported by concerns about inflation and economic growth. Additionally, the US dollar is trading weaker, making gold more attractive to investors. However, there are also some headwinds facing the gold market from rising interest rates. The US Federal Reserve is expected to raise interest rates several times this year, which could put downward pressure on gold prices.​
 
EURJPY: How to Trade the Recent Price Action

The EURJPY currency pair has recently experienced a rise, holding steady near its last high, which is acting as a resistance level at 158. However, the price had a negative reaction to this resistance and started Monday with a decline. This could potentially be just a temporary correction before another surge in price. Despite the 158 resistance appearing fragile, a break could be imminent as long as the bulls are able to maintain control of the market above the rising trendline.

eurjpy.jpg


On the other hand, it is important to note that there is also support at 153.46, which correlates with the 23.6% Fibonacci retracement level. In the unlikely event that this support level is broken in a downward direction, the decline may continue to lower levels of the Fibonacci retracement. As always, it is important to carefully monitor market trends and make informed decisions when trading.​
 
XAUUSD

Gold is currently trading around the support level of $1,963 within an ascending channel. This could be a correction phase of the uptrend that began on June 29, 2023. If the market remains within the channel, it is likely that the upward movement will continue, targeting the previous high of $1,087.

On the other hand, if the bears succeed in pushing the price outside of the rising channel, the correction may continue to a lower support level starting at $1,945. At this time, we suggest monitoring the price action and waiting for a bullish candlestick to emerge before executing a buy order or exiting a sell order.

View attachment 85137

In terms of fundamental analysis, the gold market is currently supported by concerns about inflation and economic growth. Additionally, the US dollar is trading weaker, making gold more attractive to investors. However, there are also some headwinds facing the gold market from rising interest rates. The US Federal Reserve is expected to raise interest rates several times this year, which could put downward pressure on gold prices.​

Gold: Ready to Break 1972 as Bullish Trend Resumes

After touching the bottom line of the rising channel around $1,957, gold has resumed its bullish trend. The appearance of a long wick candlestick signaled the end of the correction, and the market is now stabilizing above the $1,961 support level. It is likely that the market will continue to rise, targeting $1,972 followed by $1,980. The market trend remains bullish, and the uptrend channel is expected to continue during today’s session.

gold.jpg


On the other hand, if the $1,961 support level breaks, the market correction may test the next major support around $1,945. This level has acted as strong and valid support during the recent decline.

In terms of fundamentals, there are no major economic releases scheduled for today. As a result, the market is likely to focus on the ongoing conflict in Ukraine and the potential for further sanctions against Russia. These factors could continue to support gold prices as investors seek safe-haven assets.​
 
EURUSD Technical and Fundamental Outlook

The EURUSD currency pair has been experiencing an upward trend since October 2022. Currently, it is trading above its 1.1060 support level. Additionally, technical indicators such as the MACD and RSI are in neutral territory, suggesting a bullish outlook.

This morning, the EURUSD is trading close to the strong support at 1.1060. This price level provides a decent supply zone for the pair, and the price may bounce from here. In the near term, there are several factors that could support the EURUSD. Firstly, the European Central Bank (ECB) is expected to raise interest rates, which could make the euro more attractive to investors. Secondly, the US economy is showing signs of slowing down, which could weigh on the dollar.

eurusd-chart.jpg


As a result, the EURUSD is expected to continue its upward trend in the near term. The pair could test the 1.1200 level in the coming weeks. However, if the ECB does not raise interest rates as expected or if the US economy shows signs of improvement, the EURUSD could pull back.​
 
CHF Likely to Gain More Strength in Coming Weeks

The Swiss Franc has been gaining strength against the US dollar since November 2022. The pair is now trading at levels last seen in 2011, due to the franc's status as a safe haven currency and comments from the Swiss National Bank (SNB) about potential FX intervention.

The USDCHF currency pair bounced from the support at 0.8706, but the 4-hour chart shows a doji and long-wicked candle, suggesting that the franc is likely to gain more strength. The moving averages and technical indicators also suggest sell signals.

usdchf.jpg


There are not many high-impact risk events on the calendar this week, but we do have US building permits later today, followed by CB Consumer Confidence and the FOMC meeting next week. The key to the FOMC meeting will be the comments by Fed Chair Powell, as well as any updates on the Fed's projections for the rest of the year.​
 
Gold Analysis: Price Line Resistance Acts as Support

Gold, the yellow metal, began the day with an increase and is currently trading at $1,971, clinging to the price line resistance that previously acted as support. The market is likely to move back to the channel since it was unable to break the 38.2 Fibonacci level. As long as the Fibo level holds, the bullish outlook remains valid. The price is likely to target $1,987 again, and the previous breakdown of the rising channel can be considered a false breakdown.

gold.jpg

The 4-hour timeframe is the best for trading XAUUSD. This timeframe provides enough detail to identify trends and reversals while also capturing the overall market sentiment. In technical analysis, a price channel is a chart pattern that occurs when the price of an asset moves between two parallel trendlines. The upper trendline connects the swing highs in price, while the lower trendline connects the swing lows. The channel can slant upward, downward, or sideways on the chart.​
 
Back
Top