HubuFX Sharing Trading Ideas

NZDUSD Poised for Breakout Above Resistance

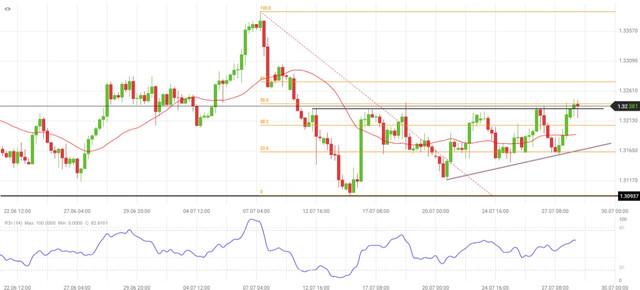
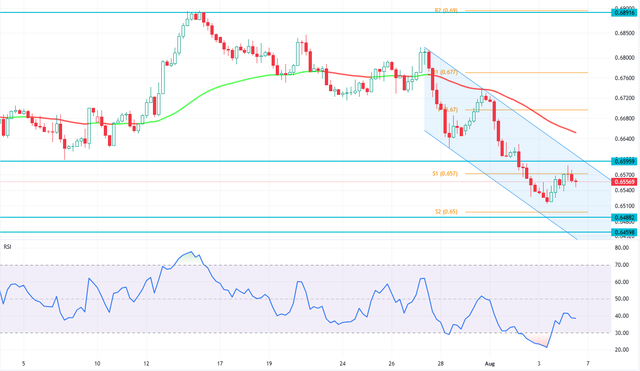
The NZDUSD currency pair is poised for a breakout, and stabilizing the price above the 0.6246 resistance today. If the bulls are successful in achieving this important milestone, the New Zealand Dollar will be able to set its sights on new targets at higher levels of the Fibonacci retracement, starting with the 50 level and followed by the 61.8 level.

In this scenario, the risk of stop for long positions should be set at 0.6184 or the previous low around 0.6150. Additionally, the simple moving average indicator is currently acting as support around the 0.619 level. However, if this level is breached, the decline could continue to the 0.6056 level.

nzdusd.jpg


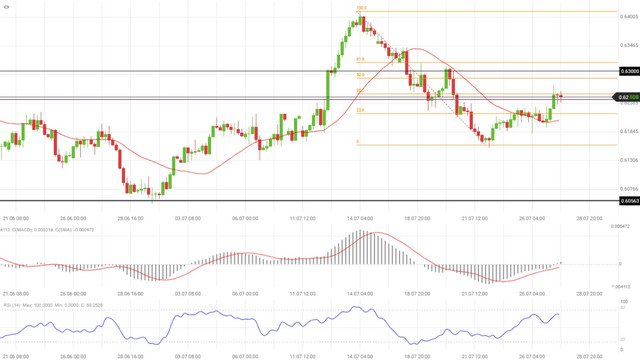
Overall, this is a critical moment for the NZDUSD currency pair, with the potential for significant gains if the bulls are able to maintain their momentum and push the price above the key resistance level.​
 
USDCAD: Is the Bear Market Over?

The USDCAD currency pair is currently testing the resistance level of 1.3235, which is also near the 50% Fibonacci retracement level. The RSI indicator has not yet reached the overbought level of 80 in the 4-hour time frame, indicating that there is still room for the bulls to push the price higher.

The candle sticks formed near the resistance level do not show any significant selling pressure from the bears. This suggests that the upward bias is likely to continue, with the 25 SMA acting as support for the bulls.

If the bulls are successful in breaking through the resistance level, their target will be the 61.8% Fibonacci resistance level. However, traders should also watch the price action closely for doji, long-wicked candles, or bearish engulfing candles, which could signal a reversal in the trend.

usdcad.jpg


In general, the trend is bearish, and the current uptick movement can be considered a correction. However, if the bulls are able to break through the resistance level, the trend could shift to bullish.​
 
EURUSD: Key Levels to Watch in Upcoming Week

The Euro weakened against the US Dollar last week, but the overall uptrend for EURUSD remains. This is because the currency pair bounced off a rising support line from June, keeping the upward bias. If it continues to rise, the next resistance level is at 1.1231, followed by a zone between 1.1453 and 1.1495. If it falls, the next support levels are at 1.0834 and 1.0635.

eurusd-hubufx-d1.png


On the 4-hour chart, positive RSI divergence shows that downside momentum is fading, which could mean a turn higher. If it rises, the next resistance levels are at 1.1182 and 1.12758. If it falls, the next support levels are at 1.0954 and a zone between 1.0833 and 1.0859.

eurusd-hubufx-4h.png
 
EURUSD Strategy: A Closer Look at the 4-Hour Chart

The EURUSD currency pair is trading bullish above the trend line from May 31. However, it is important to note that the pair is below the pivot level at 1.104. There are several high-impact economic news releases scheduled for today in the euro zone, which could impact the pair's direction in the short term. Therefore, it is not recommended to trade this currency pair until the new data is released.

eurusd-hubufx-1.png


On a technical standpoint, the euro is bullish against the dollar as long as the pair is traded above the resistance line at 1.0966. Zooming in to the 4-hour chart, we see a bullish engulfing candle stick, which signals that the rising trend may continue. However, the pair could break the trend line if the economic data released today is disappointing for the euro area.

eurusd-hubufx-2.png


Traders should keep an eye on today's economic data and watch the market behavior closely before going long or short on the EURUSD currency pair.​
 
Best Prices to Enter Gold Market with Minimum Risk

Gold bounced from the July's high of $1,987 and is currently testing the trendline that acts as support for the XAUUSD. The RSI indicator is currently below the 50 line and has room to reach the 30 level. Therefore, the downward momentum of the yellow metal may continue in the current trading session, and the bears may be able to challenge the trendline.

The S1 support offers supply for buyers in the asset, as evidenced by the long wick shadow and the bullish engulfing pattern, which signals that bulls are leading the price. If the bullish scenario is correct, the bulls' first target would be the first resistance around $1,980.

gold.png


However, traders should note that the best prices to enter the market with the minimum risk are at the support level of $1,940. If this level breaks, the gold price could dump to the next support around $1,921.​
 
Gold Price Update: Double Bottom Pattern in Play

Following up on yesterday’s analysis, the XAUUSD pair has tested the support level of $1,940 and is currently challenging the broken trendline on the 4-hour chart, which now acts as resistance. Despite the bears’ efforts, they were unable to close below the low of July 27th, and the price bounced back from that zone. This could potentially lead to the formation of a double bottom pattern.

If the price breaks above $1,952, it would provide an opportunity for the bulls to push the price above the trendline and target the pivot point at $1,961.

gold-hubufx.png


On the other hand, S1 remains a key factor in maintaining a bullish bias. If it breaks, the path towards S2 at $1,921 will be cleared. We recommend keeping an eye on minor resistance levels and monitoring market behavior around these support and resistance areas.​

A double bottom pattern in forex is a bullish reversal pattern that comprises of two distinct bottoms of similar width and height, below a resistance level (the neckline), giving it the shape of a "W"1. The first bottom forms immediately after a strong downtrend. The price then retraces to the neckline and then falls back to the downside.​
 
EURUSD Analysis: Symmetrical Triangle and Awesome Oscillator

Currently, the EURUSD currency pair is trading at around 1.097. Interestingly, it's in a symmetrical triangle pattern, which typically indicates that the current trend will continue. As a result, the pair is following the rising trend line and attempting to break down. However, it's important to note that the trend line has been tested four times, so it presents a strong barrier for bearish traders. In addition, the bars on the Awesome Oscillator indicator have turned green and are approaching the signal area.

eurusd.png


Furthermore, the low on July 27th supports a bullish outlook for the EURUSD price. If this level holds, the target will be 1.104, followed by 1.113. For those who want to trade long, it's recommended to set your risk at least 29 pips below the S1 support, as indicated by the ATR indicator.

On the other hand, if bearish traders manage to close below 1.0945 on the 4-hour chart, the decline that began on July 18th could extend to 1.092 and then to 1.083.

The Average True Range (ATR) is a technical analysis indicator that measures market volatility. The ATR is typically derived from the 14-day simple moving average of a series of true range indicators. It shows investors the average range prices swing for an investment over a specified period. The ATR can be used to develop a complete trading system or be used for entry or exit signals as part of a strategy.​
 
GBPUSD Tests 1.26 Support, Bulls Ready for Reversal

The GBPUSD currency pair is currently trading below the broken trendline, around 1.2696. At the moment, the bears are testing the support area, which extends from 1.2681 to 1.26. This support zone is clearly shown in green on the GBPUSD daily time frame. Interestingly, this support was tested once on June 29, and the bullish trend extended its legs to as high as 1.3141 until July 13.

gbpusd-1.png


If we take a closer look by zooming into the 4-hour time frame, we can see a long-wick candlestick. This signals a possibility of a trend reversal or an exhaustion in the bearish bias from July 13. Please note, the green area acts as the supply zone all the way down to S1 support at 1.261. Consequently, there is a high chance for the bulls to regain control if the latter level holds.

gbpusd-2.png


On the other hand, for the bears to keep their bearish bias valid, they have to close below the S1 barrier. HubuFX suggests monitoring the price action in the green zone closely before executing a new order or exiting a current short trade.​
 
USDCAD Resistance at 1.3386, Bounce to 1.332 Possible

On August 2, the USDCAD pair broke out of its channel and surged higher after retesting it. It is currently trading near the resistance at July’s higher highs of 1.3386, which also coincides with the 50% Fibonacci retracement level. The RSI indicator is hovering in the overbought area, signaling potential exhaustion in the trend or a possible trend reversal with a double top pattern.

Hubufx recommends closely monitoring price action and candlestick patterns around the 1.3388 resistance level. If the resistance holds, the market could bounce to 1.332, followed by 1.329.

usdcad.png


If the USDCAD pair closes above 1.3386, it would indicate a continuation of the upward trend. In this scenario, buyers should exercise patience and wait for the market to retest this level before entering a long position. By waiting for a retest, professional traders can minimize their risk and increase the potential outcome of their trade.​
 
AUDUSD: Is the Uptrend Over?

The AUDUSD currency pair is currently trading at around 0.6549. Recently, the pair bounced off the resistance level at 0.6589 and formed a doji candlestick pattern on the 4-hour time frame. This pattern suggests a bearish bias in the market. It is important to note that the bearish trend remains valid as long as the price stays below the resistance level of 0.65959. If this scenario plays out, the downward momentum could continue, with the price potentially targeting May's lower lows in the range of 0.6492 to 0.6445.

audusd.png


On the other hand, if the price breaks above the resistance level of 0.6595, we could see a continuation of the correction. In this case, the price of the asset may rise to test the next resistance level at 0.6638.

In summary, traders should keep an eye on key levels of support and resistance when making their trading decisions for the AUDUSD currency pair. A break above or below these levels could signal a potential change in market direction.​

According to the latest news, the AUDUSD pair is preparing to extend losses below the immediate support of 0.6595 as the United States Automatic Data Processing (ADP) reports that employment additions were higher than expectations. The US labor market witnessed an addition of fresh 324K private payrolls, significantly higher than the estimates of 189K but lower than the former release of 497K. The AUDUSD broke below the key support area at 0.6600 and tumbled to 0.6527, reaching the lowest level since June 1. The decline added negative pressure to the Aussie, which still persists. The pair is currently looking for the next support.​
 
Back
Top