HubuFX Sharing Trading Ideas

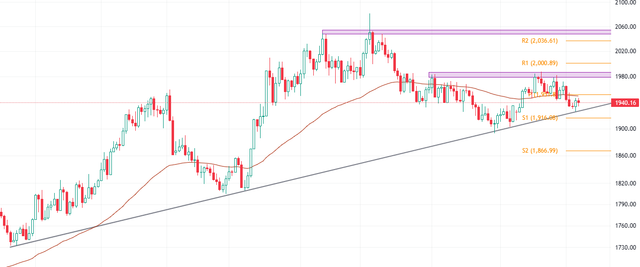
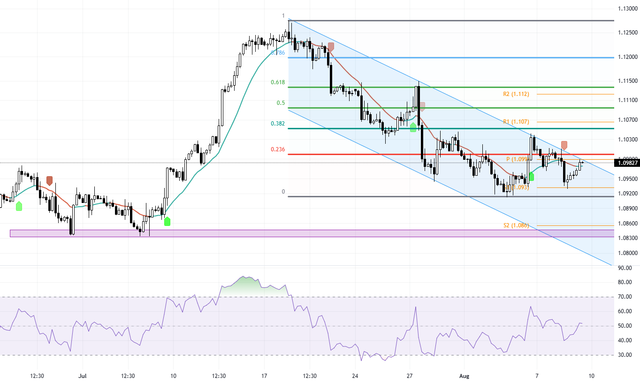
EURUSD: Downtrend Continues, But Bulls Have a Chance at R2

The EURUSD pair is trading in a downtrend and has broken below the 55 Moving Average and the pivot line at 1.099. This suggests that the decline is likely to continue, with the next target being S1 at 1.093 and S2 at 1.086. These levels coincide with the lower line of the channel.

eurusd-hubufx.png


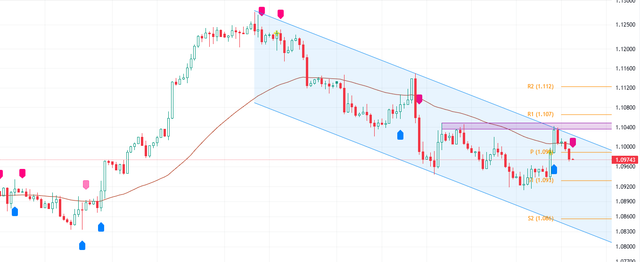
Overall, the outlook for EURUSD is bearish, but there are some bullish factors that could support the price. The 1.035 and 1.1049 levels provide support, and if the price closes above this zone, the bulls could target R2 at 1.112. Traders should be cautious and wait for a clear breakout before taking a position.​
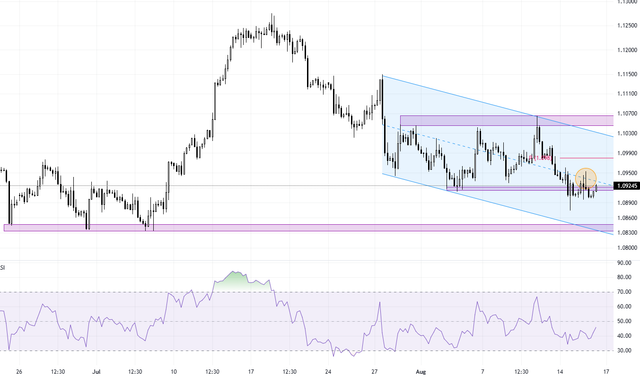

Fundamental factors for EURUSD:
  • ECB President Lagarde to speak at Jackson Hole symposium. ECB President Christine Lagarde will be speaking at the Jackson Hole symposium today. Her speech is closely watched by markets for any clues about the future of monetary policy in the eurozone.
  • German industrial production data. German industrial production data for July is due to be released today. Economists are expecting a decline of 0.5% from the previous month. A weak reading could weigh on the euro.
  • US retail sales data. US retail sales data for July is due to be released tomorrow. Economists are expecting a strong increase of 0.8% from the previous month. A strong reading could boost the dollar.
 
XAUUSD Bulls Must Hold Above Trend Line and $1,916

The XAUUSD pair is currently trading above an ascending trend line, hovering around $1941. Gold faces minor resistance at $1,951, which serves as a pivot point for the market to potentially shift from a bearish to a bullish bias. If gold can hold above the trend line, it has a bullish outlook with the potential to target and test resistance at $1980. However, it's important to note that the bulls must keep XAUUSD above both the trend line and support at $1,916.

xauusd.png


On the flip side, if bears manage to close below support at $1,916, the decline may continue to previous lower highs around $1,900, followed by support 2 at $1,866.​


Noteworthy
  • China's gold imports rise in June. China's gold imports rose in June, as the country's demand for the precious metal remained strong. Imports rose to 89.4 tonnes in June, up from 78.4 tonnes in May. This was the highest level of imports since March 2022. China is the world's largest gold consumer.​
 
Bitcoin Analysis: Key Levels to Watch

The BTCUSD is currently trading above the 28,099 support level within a declining channel. Despite the bearish channel, the overall outlook for Bitcoin remains bullish. However, in order for this bullish trend to continue, the bulls must break out of the channel and surpass the key psychological level of 30,000. If this scenario plays out, the BTCUSD pair could target 31,111 and test the previous high for a break.

Market uncertainty can be observed by analyzing the candlestick patterns on the daily time frame. Over the past 11 days, a mix of doji candles and long wick shadow candles have formed, indicating indecision among traders.

Bitcoin-Analysis-Key-Levels-to-Watch.png


On the other hand, if bears manage to close below the 28,099 support level, the BTCUSD price could fall to 26,968 followed by 25,000. As such, HubuFX's analysis team suggests keeping a close eye on market behavior within the downward channel.

In summary, while the overall outlook for Bitcoin remains bullish, there are key levels to watch on both the upside and downside. A breakout above 30,000 could signal a continuation of the bullish trend, while a close below 28,099 could indicate further downside potential. Traders should remain vigilant and monitor market behavior closely.​
 
USDJPY Surges Towards Previous High

The USDJPY currency pair recently experienced a bounce from the 0.382 Fibonacci retracement level. This bullish wave was initiated by a long wick shadow candlestick pattern in the 4-hour time frame. As a result, the pair is now surging towards its previous high of around 144.0.

usdjpy-hubufx.png


In addition, the RSI indicator is currently hovering above the 50 level, indicating that there is still room for it to reach the 70 level or enter the overbought zone. This suggests that the market expects the USDJPY to continue its upward trend and test the 144.0 resistance level in the next trading session at least.

usdjpy-hubufx-d1.png


When looking at the daily time frame, the outlook for the USDJPY remains bullish. The next major resistance level is R1 at 145.71. Furthermore, machine learning indicators signal that bulls are in control of the market. A dip to the pivot point could provide an opportunity for buyers to go long on the currency pair.​


A machine learning indicator in forex is a technical analysis tool that uses machine learning algorithms to analyze market data and make predictions about future market movements. These indicators can analyze technical and fundamental data, such as price and volume, to generate signals for potential trade setups.

For example, the RSI-MFI Machine Learning Indicator combines the Relative Strength Index (RSI) and Money Flow Index (MFI) indicators with the Manhattan distance metric to provide insights into potential trade setups by leveraging machine learning principles and calculating distances between current and historical data points. Machine learning indicators can be used in conjunction with other technical analysis tools to help traders make informed decisions in the forex market.​
 
EURUSD May Break the Channel as RSI Indicator Crosses Signal Line

The EURUSD currency pair has recently responded to the support level at 1.093. It is now testing the weekly pivot at 1.099, which coincides with the upper band of the declining channel in the 4-hour time frame. The RSI indicator has crossed the signal line and is hovering above the 50 line. This suggests that the rise that started yesterday may lead to a break of the channel upward.

eurusd-892023.png


It is important to note that horizontal support and resistance levels are generally considered more valid and reliable than trend lines or channels. With this in mind, the main resistance level for bulls is the 0.382 Fibonacci retracement level, which is around 1.105. As long as this level is not breached, the market outlook will remain bearish. The decline may continue to test the previous low around 1.093, followed by 1.086.​

What is a Channel in Forex Technical Analysis?

In forex technical analysis, a channel is a trading range. It is defined by two lines: a trend line and a concurrent line. These lines are plotted through opposite peaks or troughs. There are three types of channels based on price direction: ascending, descending, and sideways (also known as ranging). Channels are commonly used in technical analysis to confirm trends and identify breakouts and reversals.​
 
Bullish Outlook for Bitcoin After Channel Break

Recently, Bitcoin broke through its channel and tested the significant $30,000 psychological level. After this break, the outlook for Bitcoin has become increasingly bullish. In fact, the BTCUSD pair has returned to test the broken channel in the 4H time frame, which now acts as support. Additionally, the pivot point is located at 29,183 and with a hold above this level, there is a high chance that we will witness a rise to the 30,739 resistance level.

btcusd-1082023.png


Furthermore, the dip that occurred a few hours ago provides buyers with an opportunity to enter their buy orders in the market at a cheaper price. Moreover, with the RSI hovering above the signal level, there is strong support for the bullish scenario. Overall, the current market conditions present an attractive opportunity for buyers to enter the market and potentially profit from a rise in Bitcoin's value.​
 
GBPJPY Sets for Gains as Bears Offer Little Resistance

The GBPJPY currency pair has recently closed above the key resistance level of 183.26, indicating that a rise is imminent. In fact, the pair is now poised to test the second weekly resistance at 184.28. Furthermore, there appears to be little resistance from the bears, suggesting that the uptrend is likely to continue. This is certainly an exciting development for traders and investors alike.

GBPJPY-892023.png


Fundamental Highlights for JPY
  • Japan's economy grew at a slower pace in the second quarter of 2023, as rising inflation and a weak yen weighed on consumer spending. The economy expanded at an annualized rate of 0.5% in the April-June quarter, down from 2.5% in the previous quarter.​
  • The Japanese government is considering raising the minimum wage by a record 4.3%, in an effort to boost consumer spending. The current minimum wage in Japan is around $9 USD per hour, and the government believes that a higher minimum wage would help to improve the purchasing power of low-income workers.​
  • The Japanese yen has fallen to its lowest level against the US dollar in 20 years, as investors have lost confidence in the Japanese economy. The weak yen is making it more expensive for Japanese companies to import goods and raw materials, which is raising costs and could lead to further inflation.​
 
EURUSD Trading Below Middle Line of Declining Channel

The EURUSD currency pair is currently experiencing a downward trend, trading below the middle line of the declining channel at approximately 1.0920. The bears have managed to close under the 1.0915 support level, and the market is now testing this level as it acts as resistance. The long wick of the candlestick and the RSI indicator, which hovers below the 50 signal line, both indicate that the bears are still in control. As a result, another drop to the 1.08833 support level is possible.

eurusd.png


In summary, the outlook for the EURUSD currency pair remains bearish as long as it continues to trade within the downward channel.​
 
GBPUSD Analysis From Daily to 4-Hour Charts

Upon a detailed examination of the GBPUSD daily chart, it's evident that the trend has shifted sideways following the pair's break from the upward channel. The resistance zone is currently situated at 1.26, a critical level that the market must surpass to maintain the downward trend initiated on July 14th.

GBPUSD-Analysis-From-Daily-to-4-Hour-Charts-1.png


Taking a closer look at the 4-hour timeframe, we observe that GBPUSD has managed to close above the 1.2773 pivot and exit the downward channel. This development has led to an increase in bearish pressure, causing the currency pair to test the previously broken resistance, which now serves as a minor support. The primary resistance is firmly established at 1.2785. As long as this level remains intact, we can consider the downtrend to be valid. Consequently, we can anticipate the market would target the 1.26 support and potentially attempting to breach this level.

GBPUSD-Analysis-From-Daily-to-4-Hour-Charts-2.png
 
Navigating the XAUUSD Downtrend: Key Levels to Watch

The XAUUSD, or gold price, has been on a downward trend. This happened after the upward trendline was broken. The decline in gold prices slowed when it reached a significant support level at $1894.6, which is just below the 50% mark of the Fibonacci retracement tool. Please note, the RSI indicator is hovering near the oversold area.

For those who are bullish on gold, it’s crucial to prevent the price from closing below this level on the daily chart. They need to push the price above the 50% Fibonacci level to halt the steep decline. If they succeed, there’s a possibility for the price to fluctuate between $1894 and $1945.

Navigating-the-Gold-Downtrend-Key-Levels-to-Watch.png


However, if the price closes below this key level, the next target could be the 0.618 level of the Fibonacci retracement around $1865.​
 
Back
Top