HubuFX Sharing Trading Ideas

AUDUSD Technical Analysis

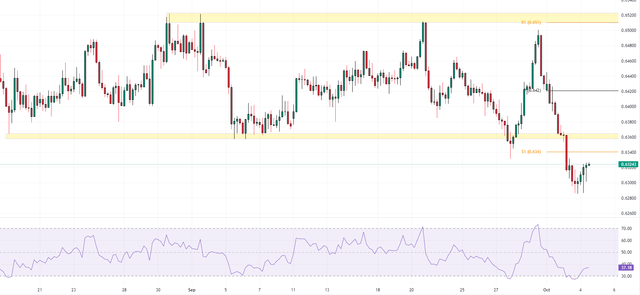
The decline of the AUDUSD currency pair has temporarily halted as the RSI indicator, previously in the oversold territory, is now hovering at the 37 level. The market maintains a bearish trend, and the support level at 0.634 presents an attractive price point for bears to intensify their selling pressure.

AUDUSD-2023-10-04-12-12-21-419fa.png
 
EURUSD Technical Analysis

The EURUSD currency pair is currently navigating within a downward channel and is positioned below the pivot in the 4-hour time frame. A minor resistance level is observed at 1.049, and at present, the pair is maintaining a position above this level. The RSI indicator has surged above the 50 mark, suggesting the potential onset of a bullish wave. Given the prevailing market conditions and the dominant bearish trend, our recommendation is to wait for the EURUSD to hit either the pivot or the 1.066 resistance level before initiating sell orders.

EURUSD-2023-10-05-11-23-55-e0860.png


Please note that this bearish outlook will be invalidated if the EURUSD bulls manage to push the currency pair out of the downward channel.​
 
GBPUSD Analysis

The GBPUSD is currently trading below the pivot point of 1.219. Interestingly, the RSI indicator is flipping above the critical level of 50, which might indicate an upcoming bullish wave. However, for this to materialize, it's crucial for the bulls to close above the pivot point, as this would pave the way towards the next resistance level at 1.228.

GBPUSD-2023-10-05-15-03-55-801ad.png
 
USDCAD Analysis: Technical View

The USDCAD is currently trading above a crucial broker resistance zone, spanning from 1.3655 to 1.3648. This zone serves as a strong support for the bullish trend. As long as the price remains above this level, we can expect the USDCAD bulls to push higher and challenge the next resistance zone, which lies between 1.3877 and 1.3976.

USDCAD-2023-10-06-10-50-21-c9591.png


Conversely, if the bears manage to push the price below 1.3655, and if the RSI indicator dips below the 50 level, it could signal a bearish turn. In this case, the USDCAD might aim for the 1.355 pivot point.​
 
Back
Top