HubuFX Sharing Trading Ideas

NZDUSD Technical Analysis

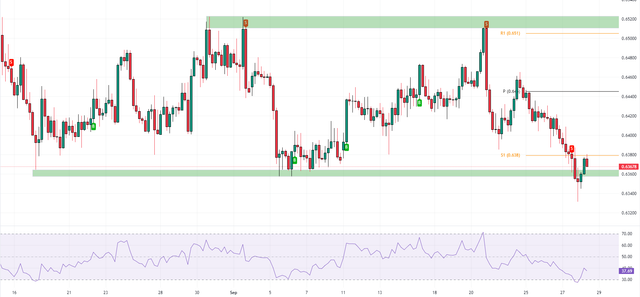
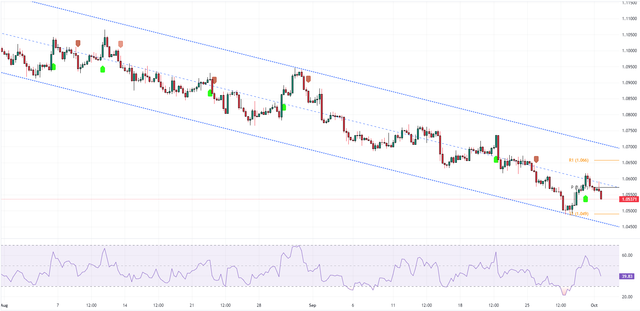
The NZDUSD currency pair is currently trading beneath the pivotal 0.595 mark, with the RSI indicator lingering below the 50 level, indicating a bearish market strength. The pair is navigating within an ascending channel, which is typically viewed as a corrective phase following the pair's recent downturn.

NZDUSD-2023-09-27-09-34-23-bea15.png


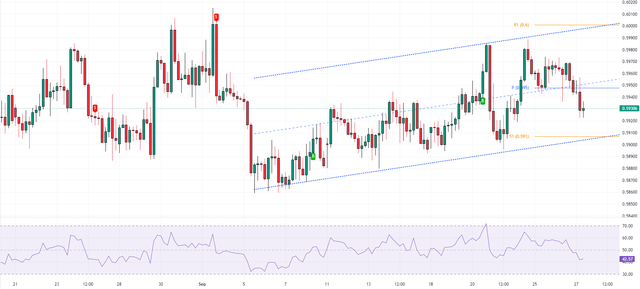
The lower boundary of this declining channel plays a crucial role in resuming the bearish outlook. As NZDUSD is trading below the pivot point and with the price remaining under this level, there's a likelihood of a further decline towards the 0.591 support level. This scenario underscores the importance of monitoring these key levels and market indicators in your trading strategy.​
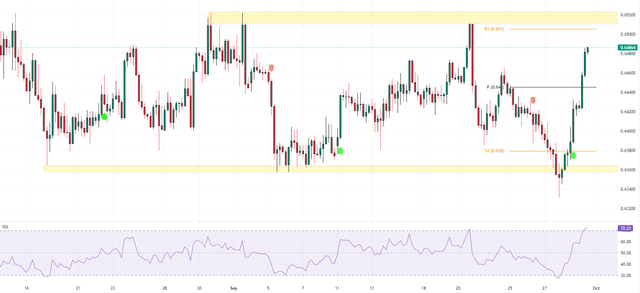
 
AUDUSD Technical Analysis

The AUDUSD currency pair recently tested the 0.638 resistance level, following a rebound from the 0.636 support level. However, bearish forces managed to push the closing price below the crucial support level of 0.636. Given that the Relative Strength Index (RSI) was in the oversold territory, a market correction was anticipated.

AUDUSD-2023-09-28-10-57-32-e6257.png


As long as the price remains below the 0.638 resistance level, the market trend is expected to stay bearish. On the other hand, if bullish forces can push the closing price above 0.638, the recent low could be interpreted as a new lower low, setting the stage for bulls to aim for the 0.645 pivot point.​
 
Bitcoin Technical Analysis

The BTCUSD is trading around $26,395 this morning after a failed attempt to break the $27,116 last week. The previous daily candle is a long wick shadow candle, showing the strength of the bears in the market. This scenario is stronger with the RSI indicator hovering below the level of 50.

BTCUSDT-2023-09-28-12-25-55-8e08c.png


With the price below the $27,000 barrier, it is likely for Bitcoin to decline and test the $25,000 support again.
 
Crude Oil Update: Key Resistance Breached

Crude Oil has successfully breached the significant resistance level of $94, reaching as high as $95 in early trading sessions. Currently, it’s trading around $93, forming a long wick candlestick pattern. It’s important to note that the weekly pivot is also situated at $93. This resistance level is crucial, and with the price surpassing it, Crude Oil may be poised to reach the psychological level of $100.

USOIL-2023-09-28-13-18-27-24102.png


The RSI indicator is currently in the overbought zone, suggesting a need for close monitoring of today’s price action on the daily chart. If bearish forces manage to push the price down, forming an inverted hammer or a long wick shadow candlestick pattern, we could see some corrections to lower levels such as $90, followed by $85.​
 
AUDUSD Technical Analysis

In the recent analysis of AUDUSD, we observed a robust rebound from the 0.63 mark, with the currency pair now hovering around 0.648. The Relative Strength Index (RSI) is currently in the overbought territory, indicating a potential deceleration in the ongoing upward trend. The critical level to monitor for AUDUSD is the resistance at 0.651. There's a possibility that AUDUSD may reverse its course and enter a bearish phase from this point onwards.

AUDUSD-2023-09-29-12-28-49-81624.png
 
Bitcoin Analysis

Yesterday, Bitcoin managed to break above the downward trendline and successfully closed above the $27,997 R1 resistance level. The Relative Strength Index (RSI) is now approaching the overbought territory. Given this RSI indicator, it's possible that BTCUSD might experience a sideways range. With Bitcoin surpassing the R1 support level, there's a likelihood that the bulls could drive the BTCUSD price up to $29,031, and potentially even reach $30,579.

BTCUSDT-2023-10-02-11-36-37-792b7.png
 
EURUSD Analysis: Persistent Decline

The EURUSD pair is on a steady decline, unable to break the midpoint of the downward channel. The RSI dipping below 50 signals a likely continuation of this bearish trend.

EURUSD-2023-10-02-13-38-47-ddd72.png


The 1.0409 support level is a key marker. If the pair holds above this, it could slow the bearish momentum. However, if it fails to maintain this level, the downtrend may continue to lower levels.​
 
US Oil Analysis: Bears Targeting the $87 Support

US oil prices are falling from a high of $95 and trading below the $90.36 pivot point due to various factors. The next support level is at $87.63, which could act as a buffer against further declines. The market conditions are fluid and vigilance is key.

USOIL-2023-10-02-18-14-52-d7aec.png
 
Bitcoin Bulls Hold the Fort: An Analysis of Current Market Trends

The bears put pressure on the bitcoin from $28,708 and currently bitcoin is testing the $27,349 pivot. The RSI indicator is hovering above the 50 level and with the BTCUSD holding above the broken trendline and pivot, bitcoin bulls are yet in control and we can expect the bitcoin price to rise and test the R1 resistance again.

BTCUSDT-2023-10-03-10-48-13-f9f31.png
 
Turkish Lira Weakens Against Strong US Dollar

The Turkish lira is falling against the strong US dollar. The USDTRY is up 0.4% as Turkey's inflation was slightly lower than expected, which might influence the CBRT's approach. Despite recent changes, the USDTRY is still on an upward trend.

USDTRY-2023-10-03-12-27-36-b0f9d.png
  • Yearly inflation in Turkey: 61.53% (Expected: 61.6%, Previous: 58.94%)​
  • Monthly inflation in Turkey: 4.75% (Expected: 4.8%, Previous: 9.09%)​
 
Back
Top