HubuFX Sharing Trading Ideas

USDJPY Analysis: Bulls Thrilling Climb to New Heights

The Japanese yen has slowed down a bit against the U.S. dollar after the head of the Bank of Japan made a statement that seemed to favor tighter monetary policy. But, there's some news coming up that could shake things up. People are guessing that the U.S. Consumer Price Index (CPI), which measures inflation, might be higher than before. If that's true, the U.S. Federal Reserve might raise interest rates again next week. This idea is making the U.S. dollar stronger. Also, in Japan, the rate of inflation at the wholesale level went down in August, which is making the yen weaker.

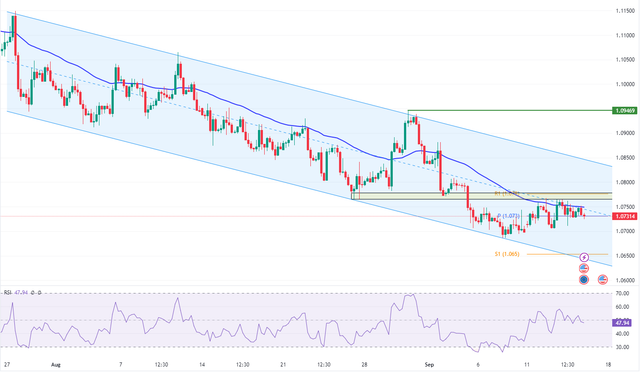
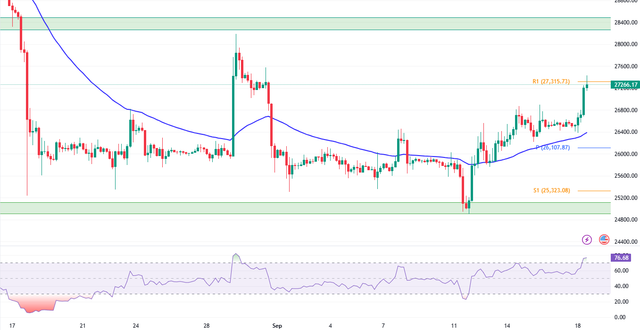
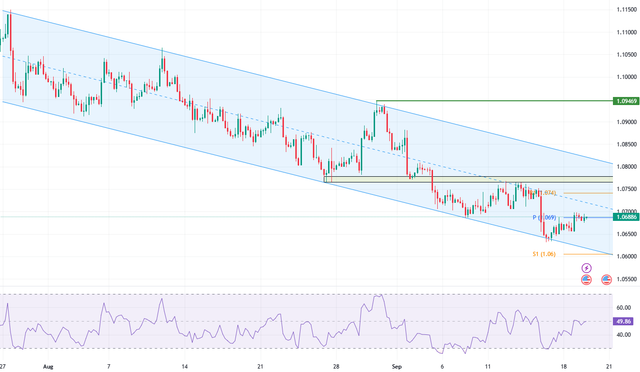
The USDJPY currency pair is on an upward trend, trading within a rising channel. The Relative Strength Index (RSI) has tipped over the signal line, indicating a potential increase in buying pressure. The lower line of this channel is acting as a support for bullish traders.

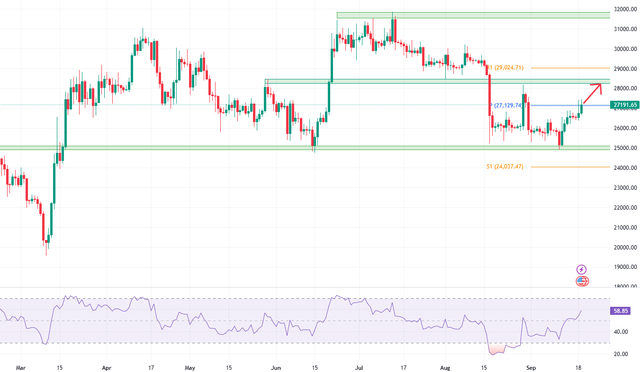
Interestingly, Japan's yearly inflation rate at the wholesale level has been on a downward trend for the past eight months, weakening the Japanese yen. This economic backdrop sets the stage for the USDJPY to potentially reach its recent high at 147.88. If this level is surpassed, the next target could be 148.42.

USDJPY-2023-09-13-16-00-53-8c12b.png


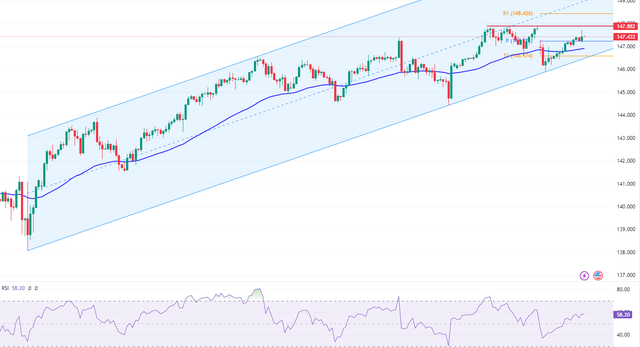
The outlook for the USDJPY pair remains bullish. The support level at 146.57 could provide a favorable entry point for traders considering the risk-reward ratio at the current price.

In forex trading, it's crucial to keep an eye on these economic indicators and market trends. They can provide valuable insights into potential trading opportunities and strategies. Always remember, successful trading involves careful analysis and risk management.​
 
EURUSD Bearish Outlook and the Impact of Euro Economy News

The EURUSD currency pair has recently tested the 50-day Simple Moving Average (SMA) and the 1.078 resistance zone, but is currently trading below this level. As long as this level remains steady, the outlook for the currency pair will be bearish, with a potential target of 1.065.

EURUSD-2023-09-14-13-31-39-b641d.png


However, if the bulls manage to close above the 1.078 resistance, it could halt the current downtrend momentum. In this scenario, the upper band of the bearish channel would become the next resistance to watch.

It's worth noting that recent news about the Euro economy could impact this analysis. For instance, the European Central Bank is considering raising its key interest rate, and there are concerns about climate risks impacting Europe's economy. These factors could influence the EURUSD currency pair's movements in the near future. Stay updated with the latest news for more accurate forex predictions.​
 
Stablecoin Studio Shines as Bitcoin Weathers the FTX Storm: A Crypto Market Analysis

A U.S. Bankruptcy Court judge in Delaware ruled that crypto exchange FTX can use its crypto assets to repay creditors. Bitcoin (BTCUSD) rebounded from $25,000, targeting the $24,129 pivot. Bulls need a close above the pivot for $28,000 resistance.

BTCUSD-2023-09-14-18-12-59-2cbfb.png
 
EURUSD Forecast

Upon examining the daily chart for the EURUSD currency pair, it is evident that the bears have exerted significant downward pressure on the price. This has resulted in a substantial decline, pushing the price all the way down to a crucial support zone. This zone, which extends from 1.0664 to 1.0636, is of paramount importance in the current market dynamics.

This particular level is noteworthy as it offers a substantial bid for buyers, making it an attractive point for potential market entry. However, it's important to bear in mind the inherent risk of being stopped out should the price fall below this support level. Therefore, careful consideration and risk management strategies are essential when trading at this juncture.

EURUSD-2023-09-15-10-55-37.png


If this support level proves to be robust and withstands further bearish pressure, we could potentially see a reversal in the EURUSD price trend. This could usher in a period of correction, during which the price may retrace some of its recent losses. In such a scenario, it's plausible that the EURUSD price might aim to test the previously broken support level around 1.072 on the daily chart. This level could serve as a key target for this potential corrective phase.

In conclusion, monitoring these key levels on the EURUSD daily chart can provide valuable insights for traders and investors alike. It's also worth noting that these observations are based on current market conditions and are subject to change as new market data becomes available.​
 
GBPUSD Technical Analysis

The GBPUSD currency pair is currently trending downwards, with the RSI indicator moving away from the oversold zone of 30. The pivot and resistance point is around the 1.245 zone, which is a key area for bearish traders to sell the currency pair. Therefore, it's important to monitor this pivot area and look for price action or candlestick patterns before making a trade decision. This information could be beneficial for those interested in forex trading, particularly with the GBPUSD pair.

GBPUSD-2023-09-18-14-20-29.png
 
Bitcoin at the 27.315 Resistance: What RSI and Candlestick Patterns Tell Us

Bitcoin has successfully reached the resistance level of 27.315 and is currently undergoing testing at this level. The BTCUSD 4-hour chart reveals that the Relative Strength Index (RSI) indicator is in the overbought zone, suggesting a potential pause in Bitcoin's upward trend.

BTCUSD-2023-09-18-17-33-00.png


Given the RSI signal, it's recommended to wait for the candle to close within the 4-hour timeframe. The shape of the candlestick can offer valuable insights into market activity.

Specifically, we're on the lookout for a long wick candlestick, a doji, or an inverted hammer. These candlestick patterns could potentially indicate a trend reversal scenario, adding another layer to our market analysis.​
 
EURUSD Technical Analysis

The EURUSD currency pair is currently hovering around a crucial pivot point, situated at 1.069. This pivot area is of significant interest to traders as it often acts as a reliable supply zone for bearish market participants. As such, it's not surprising to see the market trading in a relatively narrow range around this level.

However, the market's direction is not solely determined by technical factors. Fundamental events, such as policy announcements from influential institutions like the Federal Reserve, can cause significant shifts in market sentiment and price action. In this case, the market is eagerly awaiting the Federal Reserve's policy announcements scheduled for this Wednesday.

EURUSD-2023-09-19-12-16-31.png


Given the potential impact of these announcements, many traders are choosing to adopt a cautious approach, refraining from placing substantial bets until they have a clearer picture of the Fed's stance. Consequently, we can expect the EURUSD pair to continue trading within its current range until the market receives further updates from the Federal Reserve. This careful, anticipatory behavior underscores the importance of balancing technical analysis with an understanding of key economic events in successful forex trading.​
 
Analyzing Bitcoin's Potential Rise to $28,500

Bitcoin is currently in the process of testing the pivot point at $27,129 for the second consecutive day. Given the bullish momentum that's building up, it's highly probable that BTCUSD will close above this pivot point in the upcoming trading session. This bullish sentiment is further confirmed by the Relative Strength Index (RSI) indicator, which has recently flipped above the level of 50, indicating a strong upward price movement driven by the bulls. If this scenario holds true, Bitcoin could potentially set its sights on the $28,500 mark as its next target.

BTCUSD-2023-09-19-16-41-06.png
 
Gold Technical Analysis:

The XAUUSD pair, which represents the trading relationship between gold and the US dollar, is currently positioned below a descending channel. This indicates that the market sentiment is leaning towards the bearish side as long as the price of gold remains beneath the trendline. Investors and traders are closely monitoring the $1940 price level, which has proven to be a significant barrier for the bulls. If the bullish market participants are unable to push the price above this level, it could signal a lack of buying pressure in the market. This could potentially lead to a shift in market sentiment, causing the price of gold to retreat.

XAUUSD-2023-09-20-08-17-14.png


In such a scenario, the next key level to watch would be the $1,894 support level. This price point could serve as a safety net for the gold price, providing a platform from which it could potentially bounce back. However, if the price breaks below this level, it could trigger further selling pressure, leading to a deeper correction in the gold price.​
 
US Federal Reserve Holds

On Wednesday, the US Federal Reserve, also known as the Fed, decided to keep the policy rate, or federal funds rate, steady at 5.25%-5.5%. This decision was expected by the market and occurred after their September policy meeting.

The Fed's policy statement highlighted that the economy is still growing steadily. Although job growth has slowed down, it remains robust. The Fed also emphasized that inflation is still high and they are closely monitoring the risks associated with it. According to the updated Summary of Economic Projections, also known as the dot plot, the policymakers are predicting one more rate hike of 25 basis points before the year ends.

The US Dollar is showing resilience against its competitors following the Fed's rate decision and the updated dot plot. As of now, the US Dollar Index remains steady for the day at 105.15. Market trends indicate that the Fed's decision to keep the policy rate unchanged is already factored in. However, investors are still considering a nearly 40% chance of an additional 25 basis points interest rate hike by the end of the year, according to the CME Group FedWatch Tool.

Analysts at Wells Fargo anticipate a more positive outlook in the dot plot: "The FOMC is likely to maintain the federal funds rate target range at 5.25%-5.50% at its meeting on September 20."

"We predict that the September SEP will present a more positive forecast for the US economy compared to the last SEP in June. Specifically, we expect the FOMC to increase its forecast for real GDP growth this year while slightly lowering its inflation outlook. We don't anticipate significant changes in the median dots for 2024 and 2025, although some of the higher dots may be slightly adjusted."​
 
Back
Top