HubuFX Sharing Trading Ideas

EURUSD Analysis: Exploring the Possibility of a Bullish Reversal

In July, the number of orders for German-made goods decreased significantly, suggesting that Germany’s manufacturing industry is facing challenges. The decrease was 11.7%, which was more than expected. In the same month, Germany’s Industrial Orders also decreased by 10.5% compared to the previous year, while in June it had increased by 3.3%. This data indicates that the German manufacturing sector may require support to recover.

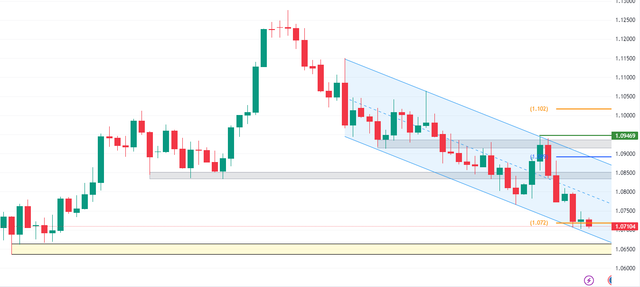
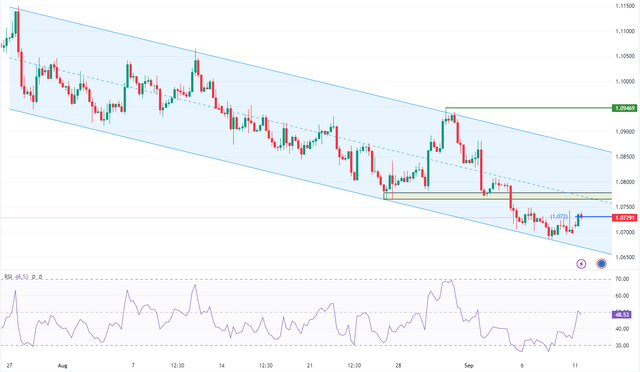
The EURUSD currency pair is currently trading in a declining channel and recently visited the 1.071 support level. At the same time, the RSI indicator was hovering in the oversold area. Interestingly, a bullish engulfing pattern has emerged in the EURUSD 4-hour time frame. As a result, we have two signals for entering a form of correction in the EURUSD or even a trend reversal. However, the reversal is unlikely since it requires optimistic fundamental news for the Euro zone.

EURUSD-2023-09-06-08-59-48-809b7.png


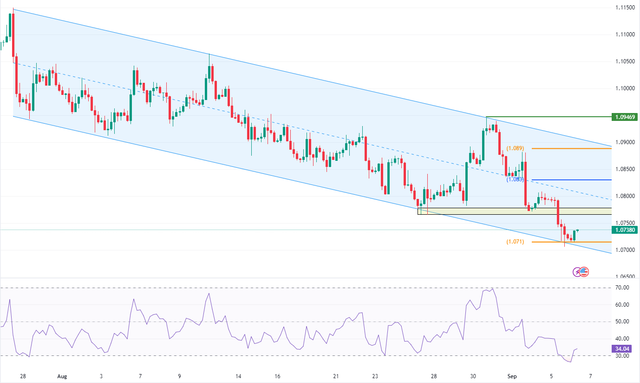
On a technical standpoint, support is at 1.071 and due to the bullish engulfing candlestick pattern and the RSI indicator exiting the oversold area, there is a high possibility for the pair to test the recent broken support which acts as resistance around 1.076 followed by the 1.083 pivot.​
 
Gold Trading Forecast: Key Levels to Watch in the Short Term

The price of gold has been falling for two days because people are investing more in the US Dollar. This is happening because there are concerns about a global recession. People see the US Dollar as a safe option, especially as some countries are struggling with high interest rates and the possibility of deflation in China.

However, the situation for gold may not be bad. The US Unemployment Rate has gone up to 3.8% and wages are not growing as fast. People hope that the Federal Reserve will stop raising interest rates. A member of the Federal Reserve, Christopher Waller, agrees with this idea. He says that recent economic information gives the Federal Reserve more time to decide if they need to raise interest rates again.

XAUUSD-2023-09-06-14-33-33-45cf9.png


In a recent development, gold closed under the pivotal point of $1,930. This event was triggered when the bulls were unable to breach the trendline on XAUUSD, which now serves as a strong resistance. The presence of a long wick shadow and the inverted hammer pattern are clear indicators of mounting sell pressure on gold. From a technical analysis perspective, it is likely that the price of gold could retreat to $1,910, and potentially even to $1,900.

However, all is not lost for gold. The high gold price recorded on September 1 is currently acting as a resistance level. To negate the bearish outlook, the bulls need to overcome the declining trendline and ensure a close above $1,950. Achieving this would signal a momentum shift and could pave the way for further gains in gold.​
 
Fed Rate Hike Speculation Rattles Markets

The strong ISM data has led to speculation that the Federal Reserve (Fed) might raise interest rates again before the year ends and keep them high for a while. The US 2-year return is now over 5%, and the 10-year return is around 4.30%, meaning the returns you get from investing in US government bonds are going up. The 2-year return is now above 5%, and the 10-year return is about 4.30%. When these returns rise, it can affect the economy.

The US dollar is getting stronger, and it's moving towards the 105 level. When it reaches 105.40, traders will decide if it's going to change from being weak this year to being strong in the medium term. But this is affecting countries around the world. Japan, in particular, is worried and says they might do something to prevent their currency, the yen, from losing value.

DXY-2023-09-07-11-43-34-c39d8.png


In the stock market, the S&P 500 didn't do well because of the rising US returns. It went below 4500 points and a 50-day average that shows market trends. The Nasdaq 100 also dropped because Apple's stock fell more than 3.50%. This happened because of a report that Chinese government workers can't bring iPhones and other foreign-made devices to work. People see this as a sign of the ongoing trade and technology disputes between the US and China."​
 
EURUSD Analysis: Markets Surprised by Q2 GDP Fails

The Eurozone’s Q2 2023 GDP was revised, surprising markets that had expected 0.6% growth. Instead, the GDP saw a small increase of 0.1%, falling short of the projected 0.3%. This was due to slow domestic consumption and decreasing exports. Despite this, the EURUSD is gaining, even though expectations for a rate hike from the ECB next week are dropping.

EURUSD-2023-09-07-14-03-59-dccd0.png


The EURUSD currency pair is currently trading within a declining channel and is closing below the 1.072 resistance level. This suggests that the decline is likely to continue, with the next target being the 1.065 supply zone.​
 
GBPUSD Analysis: A Dance with the 1.2500 Mark

The GBPUSD pair is experiencing a slight increase during the Asian session on Friday, moving away from its three-month low. Despite this, it remains below the 1.2500 mark and traders should exercise caution before betting on a bullish scenario. With US Treasury bond yields declining and stock markets stable, traders are hesitant to bet on USD bulls. This is providing some support to the GBPUSD pair, though the USD remains strong due to expectations of high interest rates from the Fed.

Traders anticipate another 0.25% rate increase by the end of the year, supported by strong US economic data such as the Weekly Jobless Claims on Thursday. This should boost US bond yields and the USD, while expectations that the Bank of England (BoE) is nearing the end of its rate hikes could weigh on the British Pound and limit gains for the GBPUSD pair.

GBPUSD-2023-09-08-10-41-35-9d803.png


BoE Governor Andrew Bailey stated on Wednesday that the central bank is close to ending its rate increases, though further hikes may still be necessary due to high inflation. In the absence of significant economic news from either the UK or the US, it may be prudent for traders to wait for further buying momentum before confirming a near-term bottom for the GBPUSD pair.​
 
The Calm Before the Storm: Anticipating the ECB Meeting

The European single currency is currently stable, maintaining a level above 1.07. This stability is due to the low volatility in the market today, as investors are hesitant to make significant moves before the European Central Bank's (ECB) meeting on Thursday.

On Friday, the currency's performance was as expected. Despite a temporary dip below 1.07, it managed to avoid major losses and showed signs of steadiness. There were no additional losses in the international stock markets, which means there's no current trigger that could lead to further losses for the European currency.

This week is crucial as we anticipate one of the most contentious ECB meetings in recent months on Thursday. Opinions are divided on whether ECB President Lagarde will announce a 25 basis point increase in key interest rates.

EURUSD-2023-09-11-10-48-25-53f93.png


Today's agenda is quite light, and tomorrow's doesn't hold much of significance either. The focus now shifts to Wednesday, when the U.S. Consumer Inflation rate will be announced, and of course to Thursday's ECB meeting.

In anticipation of these significant events, it's likely that we'll see a repeat of Friday's market behavior, with limited fluctuations. The exchange rate is expected to hover around the 1.07 level without much deviation.​
 
Decoding GBPJPY’s Price Dynamics Amid Weak JPY Fundamentals

The GBPJPY currency pair has been exhibiting a rectangular trading pattern since the onset of the week. At present, the pair continues to test the previous week's low at 182.86. Despite this, the market remains bullish above the 182.86 support level, providing a glimmer of hope for bullish investors to drive up the pair's price. This optimism is further bolstered by the current weak fundamentals of the Japanese Yen.

However, it is crucial to exercise caution before initiating a long trade on GBPJPY, as indicated by the Relative Strength Index (RSI) which is currently positioned below the signal line. The level of 183.7 serves as a minor resistance point that bullish investors must overcome to aim for R1 at 185.59.

GBPJPY-2023-09-12-11-20-18-8e7f5.png


Conversely, should there be a firm close below the S1 support at 182.86, it could potentially signal a continuation of the downtrend. Therefore, it is essential for investors to closely monitor these key levels and market indicators to make informed trading decisions.​
 
Dollar Gets Stronger Amid Changes in World Economy

The US dollar is doing better after it fell due to comments from Japan and China. Also, Beijing has made rules that need approval for buying more than $50 million. These different money policies around the world keep helping the dollar. It's doing better against all the G10 currencies and is mostly the same as yesterday. Most currencies from developing countries are lower, with those from Central Europe falling the most. The Chinese yuan is steady.

Most stock markets are down, but those in Japan, Taiwan, and Australia went up today. Europe's Stoxx 600 is a bit lower and US index futures have dropped by about 0.25%.

Japan's 10-year yield has gone up a bit to 0.70%. European yields are a bit lower by up to two points. Even with a rise in average weekly earnings in the UK, the 10-year Gilt yield has dropped almost five points to 4.42%. The US 10-year yield has dropped about 1.5 points to almost 4.27%. Today, the US plans to sell $35 billion of the 10-year note.

Gold is trading between $1918.6 and $1924.5 today, with its 200-day average around $1920. October WTI is steady near yesterday's high of $88.15 before today's OPEC and EIA monthly market reports. The IEA's report will be out tomorrow.​
 
The WTI Crude Oil Odyssey: From $85 and Beyond

The possibility of more growth in US oil production is quite limited. The number of oil drilling machines has dropped by 140 this year, which is a 20% decrease since the start of the year.

The amount of gasoline stored in the US is at the lowest it's been in the past five years. It's also about 5% less than the average amount stored over the past five years, which means people are still using a lot of gasoline.

Goldman Sachs says that Saudi Arabia needs the price of oil to be around $85 per barrel to balance its budget. It's important to remember that Saudi Aramco is planning to sell more shares in December. So, we can expect pressure to keep oil prices high until then. But for the UAE, it's closer to $50 per barrel. For a long time, Russia needed the price of oil to be between $40 and $50 per barrel to balance its budget. But now, because of the ongoing war, it needs the price to be as high as $115 per barrel. Last year, when prices were this high, we saw a big drop in demand.​
  • The EIA predicts that demand for oil will reach its highest point before 2030.​
  • There's a big increase in speculative interest in the oil market. Net positioning is already above the average of the past two years.​
  • The next big hurdle for WTI oil is around $90 per barrel.​
WTI-2023-09-12-16-20-04-9c658.png


Examining the WTI Crude Oil daily chart, the uptrend persists post a minor correction and $85 test. The RSI indicator is in the overbought zone. HubuFX analysts advise retail traders with small balances to wait for a correction to around $84 for better long trade entry points.​
 
Navigating the Gold Market: An In-depth Look at Recent Trends

The price of gold is continuing to drop, moving closer to the $1,900 mark. This is happening because the value of the US Dollar is starting to rise again. This increase is due to a careful approach in the market and a rise in US Treasury bond yields. Everyone is now waiting for the US Consumer Price Index (CPI) inflation data. This information will guide the US Federal Reserve's decisions about interest rates.

On Wednesday, the market is being cautious because of a drop in Apple and Oracle shares. People are thinking about what the European Central Bank and Bank of Japan might do next. They're also considering how the increase in oil prices could affect the world's economy and central banks. Oil prices are near their highest in ten months because OPEC+ has cut oil production.

The US Dollar is in demand because it's seen as a safe option when the market is uncertain. This is causing the price of gold to fall. US Treasury bond yields are going up again because people think that high US CPI data could lead to another increase in interest rates in November or December. There's a 93% chance that the Fed will not change interest rates in September. So, the price of gold could drop below $1,900.

The US CPI is expected to have increased by 3.6% in August, compared to 3.2% in July. The annual Core CPI inflation is likely to be 4.3%, down from 4.7% in July. On a monthly basis, the US CPI is expected to have increased by 0.6% in August, while the core figure is likely to remain at 0.2%.

On Tuesday, the price of gold fell. This happened because people expect the European Central Bank (ECB) to change its policy after seeing its inflation forecasts. This expectation made gold, which doesn’t earn interest, less attractive. The Euro became more popular because of the ECB report, which made the Euro to US Dollar exchange rate go up. This decrease in the value of the US Dollar helped stop the price of gold from falling too much, keeping it around $1,907.

XAUUSD-2023-09-13-08-24-16-72b04.png


As we approach the release of US inflation data, the price of gold seems more likely to decrease. This is because it broke out of its previous range on Tuesday. Previously, the price of gold was fluctuating between the 21-day and 50-day moving averages (DMA), which were at $1,917 and $1,932 respectively. However, it ended the day below the 21-day DMA, indicating a potential downward trend.

The 14-day Relative Strength Index (RSI), which measures the speed and change of price movements, is currently below the midpoint and heading downward. This suggests that the price could continue to fall. The next important level for the price of gold is $1,900. If it falls below this level, we could see a rapid drop towards $1,885.

On the other hand, if the price starts to rise, it will first encounter resistance at the 21-day DMA of $1,917. If it can break through this level, it will then face the 200-day DMA at $1,921. If it can surpass this level, it could potentially rise to the 50-day DMA at $1,932.​
 
Back
Top