HubuFX Sharing Trading Ideas

AUDUSD Technical Analysis

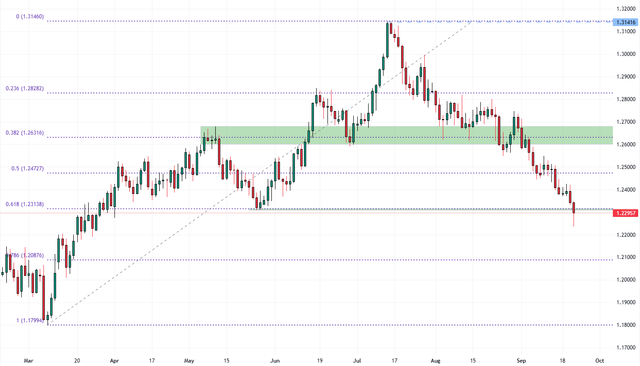
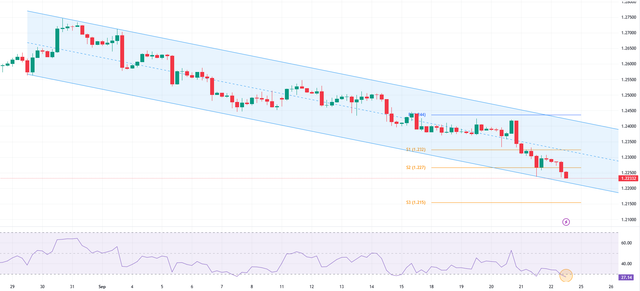
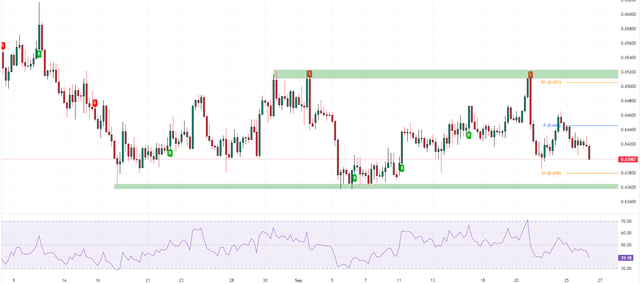
Thursday sees the AUDUSD pair continue its downward trend for the second day in a row, moving away from a nearly three-week high just above the 0.6500 mark. The pair has now hit a low of around 0.6400, a level not seen in over a week. This drop is largely due to the strong performance of the US Dollar (USD).

The USD Index (DXY), which measures the USD against other major currencies, is nearing a six-month high from last week. This is thanks to the Federal Reserve's (Fed) positive outlook. As expected, the Fed kept interest rates at a 22-year high of between 5.25%-5.5% after a two-day policy meeting. The Fed also hinted at another possible rate hike in 2023 due to ongoing inflation concerns.

According to the 'dot-plot', rates are expected to peak between 5.5%-5.75% by the end of this year, with the benchmark rate predicted to be 5.1% next year. This suggests only two rate cuts in 2024, compared to the four previously projected. This positive outlook has led to increased selling in the US fixed-income market, pushing the yield on the two-year government bond to its highest level since July 2006. The 10-year US Treasury yield has also hit a 16-year high, further boosting the USD.

Higher rates in the US have reignited worries about economic challenges due to rising borrowing costs, reducing the appeal of riskier assets. This is reflected in the weaker performance of equity markets, which is benefiting the safe-haven USD. Additionally, China's cautious approach to introducing more stimulus measures and speculation that the Reserve Bank of Australia (RBA) may have ended its rate-hiking cycle are driving investors away from the risk-sensitive Australian Dollar (AUD).

AUDUSD-2023-09-21-11-10-08.png


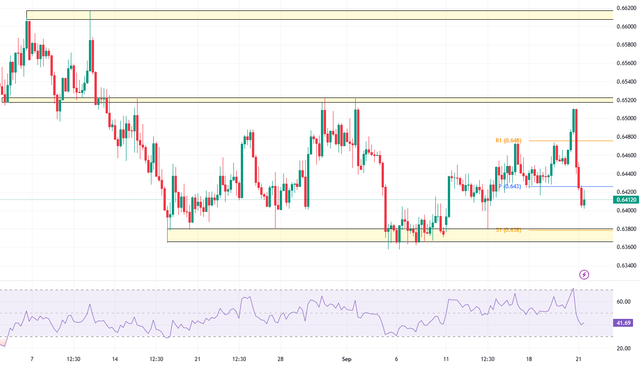
Investors are now awaiting the release of the Weekly Initial Jobless Claims, the Philly Fed Manufacturing Index, and Existing Home Sales data from the US. These releases, along with the performance of US bond yields and overall risk sentiment, will likely influence the USD and the AUDUSD pair. However, given the current situation, it seems more likely that the AUD/USD pair will continue to fall."​
 
GBPUSD Technical Analaysis

The GBPUSD currency pair has experienced a significant event: it has broken through the key support level of 1.2318 and is currently testing this level. The bearish trend is expected to continue, with the target set at the 0.786 Fibonacci retracement level, which is around 1.2087.

GBPUSD-2023-09-21-18-31-41.png
 
GBPUSD Technical Analysis

The GBPUSD currency pair, a significant barometer in the foreign exchange market, is currently navigating a downward trajectory. It's trading beneath the previously breached support level at 1.277 and is presently testing the lower boundary of the declining channel. This trend is further substantiated by the Relative Strength Index (RSI), which is lingering in the oversold territory as shown in the GBPUSD 4-hour timeframe.
GBPUSD-2023-09-22-12-51-50.png


Despite the prevailing bearish sentiment, the oversold market conditions suggest a potential for the pair to undergo a correction. This could lead to a rise towards the middle band of the declining channel or a retest of the previous support area. In this context, the levels of 1.227 and 1.232 present attractive entry points for initiating short trades on the GBPUSD. These levels offer a balance of risk and reward for traders looking to capitalize on the ongoing bearish momentum.

However, if the lower band of the declining channel fails to sustain the price, a drop to the 1.215 support level becomes a likely scenario. This potential downturn underscores the importance of risk management in trading, particularly in volatile market conditions.

In conclusion, while the GBPUSD market is currently bearish, there are signs of a potential correction. Traders should remain vigilant and look for further confirmation before making any decisions. This analysis serves as a guide for understanding the current market dynamics and potential future scenarios.​
 
Oil Technical Analysis: Ascending Triangle

In the world of Forex trading, the ascending triangle is a powerful tool used by traders to predict future price movements. This bullish continuation pattern is characterized by a rising lower trendline and a flat upper trendline that acts as resistance. The pattern indicates that buyers are more aggressive than sellers as the price continues to make higher lows.

Now, let's apply this knowledge to the current situation with oil trading. In the 1-hour chart, oil is forming an ascending triangle. This pattern is significant because it suggests that the bulls in the market are gaining strength and could potentially push the price higher. At present, oil is trading above the pivot line at $90 per barrel. The pivot line is a technical indicator used by traders to determine the overall trend of the market. If the price is above the pivot line, it's a bullish signal, indicating that it's a good time to buy.

WTI-2023-09-25-10-55-44.png


Furthermore, the Relative Strength Index (RSI), another key technical indicator, is trading above the level of 50. The RSI is a momentum oscillator that measures the speed and change of price movements. When the RSI is above 50, it indicates that the market is in a bullish phase, suggesting that the price is likely to go up.

Given these factors, it's likely that the bulls will break through the triangle and test the $91 barrier. This is based on the principle of the ascending triangle pattern, which predicts that the price will continue in the trend direction it was moving before the pattern appeared. However, as with all forms of trading, it's important to remember that while patterns and indicators can give us a good idea of what might happen, nothing is ever certain in the markets. Therefore, always trade responsibly and ensure you're managing your risk effectively.​
 
Litecoin’s Bearish Outlook

Litecoin is trading in a range area between $70 and $58. The RSI indicator is hovering below the level of 50 and currently LTCUSD is trading below the $64 pivot. The LTCUSD outlook is bearish and the pair might decline to lower support levels starting with $61.52 and followed by $58.

LTCUSD-2023-09-25-13-52-06.png
 
USDCAD Technical Analysis

The USDCAD currency pair has rebounded from the 1.34 support level, which also aligns with the lower boundary of the ascending channel. Currently trading above the pivot line, and with the RSI indicator nearing a shift above the 50 level, the bullish scenario appears more likely than a bearish one. If the pair maintains its position above the 1.34 mark, it has the potential to reach the previous high of around 1.37.

USDCAD-2023-09-25-17-41-33.png
 
AUDUSD Technical Analysis

The AUDUSD currency pair is currently trading beneath the pivot line, inching towards the 0.638 support level. Given that the RSI indicator is lingering below the 50 mark, the market sentiment leans towards bearish. This suggests that the downward trend is expected to persist, with the 0.638 support level as the immediate target, followed by the 0.636 area.

AUDUSD-2023-09-26-09-45-57-4000a.png
 
EURUSD Technical Analysis

The EURUSD has decisively breached the 1.059 support level, indicating a robust bearish market. With the RSI indicator nearing the oversold territory, we recommend a cautious approach. It would be prudent to wait for the EURUSD pair to rectify the recent sharp declines near the 1.067 weekly pivot. This level presents a substantial demand zone, providing an opportune moment for bears to initiate short trades with less risk than entering the market immediately.

EURUSD-2023-09-26-09-46-16-a15c6.png


For those already holding short positions in EURUSD, it is advisable to maintain their trades open. The currency pair is likely to aim for the lower band of the declining channel.​
 
USDJPY Technical Analysis

The bullish momentum in USDJPY appears to be unyielding. Since last week, the pair has been on an upward trajectory and is now nearing a key demand zone. The RSI indicator has been lingering in the overbought territory for several weeks, underscoring the strength of the uptrend. The bullish sentiment in the USDJPY market is robust, making it highly probable that the pair will reach the 151 - 152 demand zones.

USDJPY-2023-09-26-09-45-42-ad118.png
 
USDCHF Technical Analysis

The USDCHF currency pair is currently challenging the resistance level at 0.917. The RSI indicator is in the overbought zone, which typically suggests a correction might be on the horizon. Given that the USDCHF pair is overbought, it would be prudent to wait for a price correction before making any moves. The 0.912 level, or the previously broken channel, could potentially offer a substantial supply for bullish traders. This scenario presents an opportunity to observe and strategize for optimal entry points.

USDCHF-2023-09-27-08-28-45-50b45.png
 
Back
Top