NordFX.com - ECN/STP, MT5, CQG, Multiterminal broker

Forex Forecast for EURUSD, GBPUSD, USDJPY and USDCHF for 27 November - 1 December 2017


To begin with, a few words about the forecast for the previous week, which turned out to be accurate either fully or 90% accurate for all four currency pairs:

- Regarding EUR/USD, we named the forecast based on graphical analysis as the most promising one last week. Our decision was not a mistaken one. Recall that, according to readings on H4, the pair was expected to spend some time moving in the side corridor in the 1.1700 to 1.1860 range. After hitting the lower border of this channel, it was expected to sharply rise. This is exactly what happened: having designated a local minimum at the level of 1.1712 and being propelled by Trump's decision regarding North Korea and news from the US Federal Reserve, the pair started heading north on 21 November. It reached its maximum at 1.1943 by the end of the week;

- Giving a forecast for GBP/USD, 60% of analysts were inclined to believe that it would linger for some time in the central zone of the medium-term side channel, which began in late September - early October. As for the remaining 40% of experts, supported by almost 90% of the indicators, they expected the pair to leave this zone and go to the upper border of the channel.
This scenario was implemented with 100% accuracy: until the middle of the week, the pair had struggled to stay close to the center of the medium-term corridor, using its Pivot Point as support, and then rushed up, reaching the October maximum at 1.3338 on Friday;

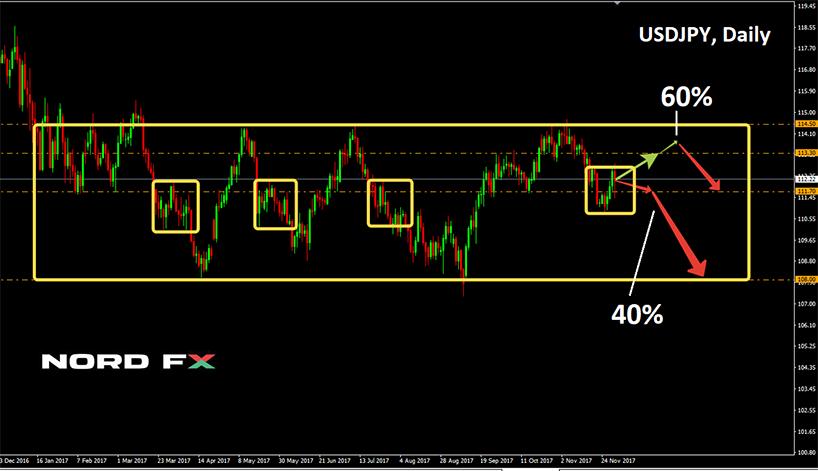
- USD/JPY. Most experts (75%), supported by an absolute majority of indicators (90%), stated that the pair would necessarily test the support in the Pivot Point area of the medium-term 108.00-114.50 side channel. This forecast was also fully correct. Having broken through the level of 111.70, the pair found the week’s minimum at 111.05, after which it fought back up, meeting the weekend in the zone 111.50;

- The forecast for USD/CHF was correct as well. 0.9940 was indicated as the nearest resistance. As predicted by 60% of experts and 75% of indicators, the pair rebounded from this level and went south. 0.9800 was identified as a target, and the pair froze near it by the end of the week.


As for the forecast for the coming week, summarizing the opinions of analysts from a number of banks and brokerages, as well as forecasts made on the basis of a variety of methods of technical and graphical analysis, we can say the following:

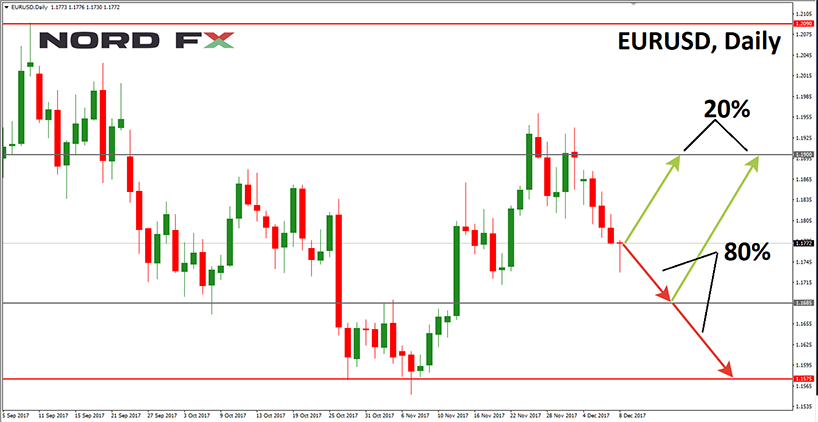
- 65% of experts predict further weakening of the dollar and the growth of EUR/USD to at least 1.2000. The next resistance levels are 1.2045 and 1.2090, which were the August peaks. Both graphical analysis and 100% of trend indicators agree with this forecast. As for the oscillators, almost a third signal that the pair is overbought. 35% of analysts are talking about a possible downwards correction: according to them, the pair may fall to the support at 1.1855, and in the event of its breakthrough, to the 1.1800 area;

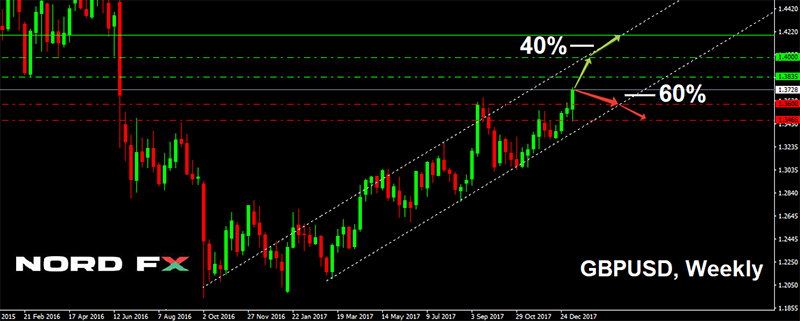
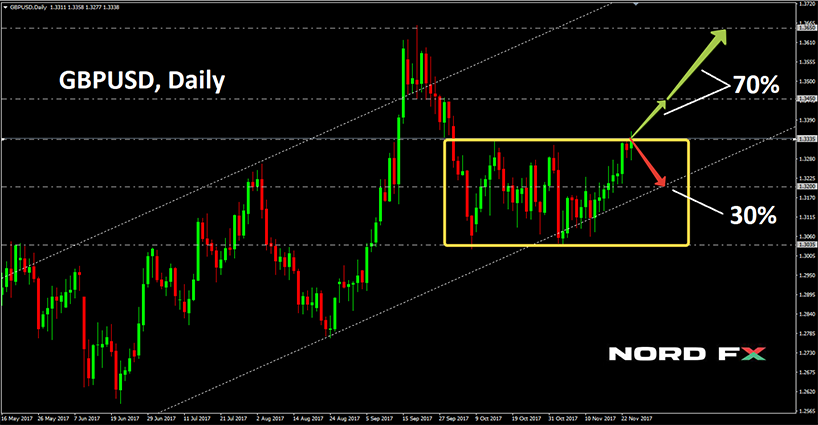
- 70% of experts, graphical analysis on D1 and 100% of indicators agree that the dollar will continue to fall relative to the British pound as well. In their view, the upward trend of the GBP/USD that began in January 2017 will continue, and the pair will rush to the September high in the 1.3650 zone. The nearest resistance is 113.25.
An alternative forecast, supported by 30% of analysts, suggests that, having reached the upper boundary of the "autumn" medium-term channel of 1.3035-1.3335, the pair should return to its Pivot Point at 1.3200;
1511669980_GBPUSD_27.11.2017.png

- The dollar’s weakening, according to 70% of experts, will also concern the USD/JPY. The pair’s target is in the 110.00-110.50 area. However, in the medium term the picture changes: here 65% of analysts vote for the pair's rise to 112.00-113.45, and then to 114.45. Graphical analysis and several oscillators on D1 also testify in favor of such a development;

- Southwards and only southwards: this is what 70% experts, graphical analysis on D1, 100% of trend indicators, as well as 80% of oscillators on H4 and D1 suggest. The support levels are 0.9750, 0.9675 and 0.9560.
As for graphical analysis, it joins 20% of oscillators in indicating that before falling, the pair may temporarily rise to 0.9865.
Finally, 30% analysts strongly disagree with the bears' supporters: according to them, the pair is expected to return to 1.0000 in the near future.


Roman Butko, NordFX


Notice: These materials should not be deemed a recommendation for investment or guidance for working on financial markets: they are for informative purposes only. Trading on financial markets is risky and can lead to a loss of money deposited.

#eurusd #gbpusd #usdjpy #usdchf #forex #forex_example #signals #forex #cryptocurrencies #bitcoin

https://nordfx.com/
 
Forex Forecast for EURUSD, GBPUSD, USDJPY and USDCHF for December 04 - 08, 2017


To begin with, a few words about the forecast for the previous week, which turned out to be accurate either fully or 90% accurate for all four currency pairs:

- As practice shows, if at least 25-30% of oscillators signal that a pair is oversold or overbought, one should expect a correction. This is what happened last week with the EUR/USD. At the beginning of the week, it seemed to have gone north, continuing the main trend of November, but the bulls' strength quickly dried up, and soon the pair retreated to where one third of analysts and oscillators had indicated - to the local bottom in zone 1.1800. However, while the pair was falling, the bulls regained their forces and by the end of the week they managed to bring it back to the level of 1.1900 - practically to the same place where the pair started on Monday;

- When giving forecast for the GBP/USD, 70% of experts, graphical analysis on D1 and all indicators had agreed that the upward trend of the pair, which started in January 2017, would continue, and it would rush to the September high in the zone 1.3650. The level of 1.3450 was named as the nearest resistance.
It is common knowledge that the truth is in the middle. So, it happened this time too - the maximum peak that the pair could conquer was the height of 1.3550, after which the forward impulse of the pair came to naught, and it completed the week at 1.3470;

- USD/JPY. The forecast for this pair assumed it would go down to the zone of 110.00-110.50 with the subsequent rise to the zone 112.00-113.45. This is what happened, with minor amendments. First, the pair dropped to the level of 110.83, and then, having turned around, it went up, rising to the height of 112.87. Afterwards, a powerful leap down 140 points followed, then up 80, and the finish was at 112.20;

- The basic forecast was accurate for the USD/CHF too. «Southwards and only to the south,"- claimed 70% of experts, graphical analysis on D1, 100% trend indicators and 80% of oscillators. The support was 0.9750. At the same time, graphical analysis on H4 together with the remaining 20% of oscillators warned that before going down, the pair could temporarily rise to the level of 0.9865.
The fairness of this forecast is clearly visible on the pair's chart - a smooth slow rise to the height of 0.9880, then a throw to the south to horizon 0.9733 and the week finished almost where expected, at 0.9760.


As for the forecast for the coming week, summarizing the opinions of analysts from a number of banks and brokerages, as well as forecasts made on the basis of a variety of methods of technical and graphical analysis, we can say the following:

- Exactly like last week, 65% experts predict a further weakening of the dollar and the growth of the EUR/USD at least to 1.2000. The following resistance levels are 1.2045 and 1.2090, the August maximum. Both graphical analysis and 95% of indicators agree with this forecast. But as for the medium-term forecast, the number of bulls' supporters is reduced to 35%, and the balance bows to the bears' side. According to the latter, starting from August, the pair is in a sideways trend in the range of 1.1575-1.2090, and therefore, having reached the upper border of this channel, it should turn around and rush to its Pivot Point in zone 1.1835.
At the same time, when opening positions on EUR/USD, it is necessary to take into account events that may affect the trend change or increase the volatility of this pair. Among the main events are the ECB meeting on Wednesday 6 December, publication of data on Eurozone GDP on Thursday and Friday publication of data on the US employment;

- The dollar is expected to weaken against the British pound as well. Thus, in the opinion of 60% of experts, graphical analysis on H4 and D1, as well as about 90% of indicators, the goal of the GBPUSD is a maximum of September 20 at 1.3650. The nearest resistance is 1.3600.
In case the trend reverses right now, the strongest support will be located at the levels 1.3325, 1.3265 and 1.3050. It is necessary to note here that the pair has been moving in the side corridor 1.3050-1.3325 for nearly two months and it was only last week that it managed to break through its upper border. Therefore, the desire of the bears to return it to this framework is strong enough, and they are ready to implement it at the first opportunity. Almost 70% of analysts do not rule out such a scenario in the medium term;

- If you try to give any forecast for the USD/JPY using indicators, you won't be able to do so. Some of them are painted in green, some in red, and some in neutral gray, both on H4, and on D1, And, this concerns both trend indicators and oscillators.
Among experts, there is a slight advantage (60% versus 40%) of those siding with the bulls, in their opinion the pair will once again try to rise to the level of 113.30-114.00, which is confirmed by graphical analysis on H4 as well. However, if we look at the D1 chart, the pair's desire to re-test the Pivot Point of the medium-term side channel 108.00-114.50 in the area of 111.70, becomes evident. If this line is broken through successfully, the pair will rush again to its lower boundary. This is exactly what we could observe in the period from March 22 to April 11, from May 17 to June 6 and from July 20 to July 31 this year;
1512287060_USDJPY_04.12.2017.png

- USD/CHF. 45% of experts believe that having reached a strong support/resistance level of 0.9760, the pair will break up and go to resistance 0.9845, and, in case of its breakthrough, and another 100 points higher. Graphical analysis on H4 and D1 as well as a quarter of the oscillators indicating that the pair is oversold, vote for this development as well.
Speaking about the movement of the pair to the north, it should also be noted that in the medium term, the number of supporters of its growth to the level of 1.0100 increases to 65%. At the same time, the bears who predict a decline of the pair to the 0.9700 level, prevail among analysts (55%).


Roman Butko, NordFX


Notice: These materials should not be deemed a recommendation for investment or guidance for working on financial markets: they are for informative purposes only. Trading on financial markets is risky and can lead to a loss of money deposited.

#eurusd #gbpusd #usdjpy #usdchf #forex #forex_example #signals #forex #cryptocurrencies #bitcoin

https://nordfx.com/
 
A Revolution In Cryptocurrency Trading – A Leverage 1:1000

Ever since December 2017, NordFX clients are enjoying the ability to trade the most popular cryptocurrencies—Bitcoin, Litecoin and Ethereum—using a 1:1000 leverage ratio.
This ratio is 10 times the market average, and enables clients to achieve a colossal profit with just a tiny amount of starting capital.
In the 11 months of this year the US dollar value of Ethereum has multiplied by 40, that of Litecoin by 20 and that of Bitcoin by 10. Thus, having bought 1 Ethereum for USD 11 in January and having sold it now for USD 440 would have resulted in a USD 429 profit. If, however, the same trade was conducted with a 1:1000 leverage ratio, USD 11 would have been enough to purchase not just 1, but 1000 of these coins.

Cryptocurrency trading is now available on all the account types that NordFX offers its clients. This gives traders exclusive opportunities to hedge their risks through completing numerous simultaneous trades with conventional currency pairs, as well as gold and silver.

NordFX provides yet another bold innovation: the most popular cryptocurrency, Bitcoin, can now be used as the deposit currency alongside the US dollar. This means that a trader can use Bitcoins to fund an account, to store assets, to withdraw profit and, by using cross exchange rates and leverage, conduct transactions with other cryptocurrencies, several dozen currency pairs and precious metals.

As a refresher, leverage is the monetary amount that a broker automatically offers traders for transacting in financial markets. Thus, NordFX allows traders and investors to make transactions of a volume equal to 1000 times that of their own assets.


#nordfx #btcusd #ltcusd #ethusd #forex #cryptocurrencies #bitcoin

https://nordfx.com/
 
Forex Forecast for EURUSD, GBPUSD, USDJPY and USDCHF for 11 – 15 December 2017


First, a review of last week’s forecast:

- Medium-term forecasts often come true much faster than expected. 65% analysts had expected that EUR/USD would test the midpoint of the 1.1575-1.2090 side channel - along which it has been moving for several months - in the medium term. However, it was just last week that the pair once again returned to the August values, completely defying the bulls' short-term expectations;

- A similar situation developed for GBP/USD. 70% of experts had expected its growth in the short term, and 70% of experts expected its fall in the medium term. It was also noted that the bears’ desire to return the pair to the boundaries of the 1.3050-1.3325 side corridor was strong enough and they would act on it at the first opportunity. This is what happened: on Thursday, 7 December, the pair fell to 1.3318, and finished the week’s session at 1.3380;

- USD/JPY. It was unfeasible to give any forecast for this pair with the help of indicators, using either H4 or D1: some of them were painted green, some red, and some neutral gray. As for the experts, the bulls had a slight advantage (60% versus 40%): according to them the pair was supposed to once again rise to the level of 113.30-114.00. This was confirmed by graphical analysis on H4. However, on D1, the pair seemed posed to once again test the Pivot Point of the medium-term side channel 108.00-114.50 in the 111.70 vicinity.
If you look at the graph, it becomes obvious that both these forecasts turned out to be correct. The pair dropped to 111.98 by the middle of the week and then made a u-turn, rushing to where the bulls were expecting it; by the end of the five-day period it reached the height of 113.58;

- USD/CHF. 45% experts had claimed that once it reached a strong support/resistance level of 0.9760, the pair would rebound first to the resistance at 0.9845, followed by another 100 points up. This scenario had been confirmed by the oscillators as well, which had indicated it was oversold. The forecast turned out to be 100% true, with the pair having steadily moved north during the entire week, fixing a maximum at 0.9975. Then it experienced a rebound of 50 points, and it froze at 0.9925.


As for the forecast for the coming week, summarizing the opinions of analysts from a number of banks and brokerages, as well as forecasts made on the basis of a variety of methods of technical and graphical analysis, we can say the following:

- As the Christmas holidays and the year’s end approach, we should expect the usual decline in financial activity. However, as trading becomes "thinner", it becomes possible for even minor speculators to influence rates.
Regarding EUR/USD, the bears have a serious advantage (80% vs. 20%): they expect the pair to continue falling to the lower boundary of the medium-term side channel 1.1575-1.2090. At the same time. it is possible that in the coming days the pair will move in a much narrower range - 1.1685-1.1900.
Graphical analysis and about 70% indicators also agree with this forecast. As for the bulls' supporters, they are corroborated by the roughly third of oscillators which indicate the pair is oversold. However, in this scenario the pair should not rise above the zone 1.1850-1.1900;
1512829773_EURUSD_11.12.2017.png

- The readings of the indicators regarding the future of GBP/USD on H4 and D1 are diametrically opposed. On H4, most of them point to the south, and on D1, they look to the north. A similar situation occurs with graphical analysis. Experts, however, are dominated by bearish sentiments: 65% of them have voted for the fall of the pair. The nearest support is in the 1.3300 zone, with the next one being in the 1.3125-1.3200 area. The main resistance is located at 1.3550;

- USD/JPY. Here, just as last week, most experts (75%) are voting for the continued growth of the pair. The targets are 114.00, 114.45 and 114.75. This forecast is supported by almost all indicators and graphical analysis. On the other hand, 25% of oscillators on H4 signal the pair is overbought, which may cause it to fall to 112.00-113.00;

- USD/CHF. 90% experts, graphical analysis on D1 and 90% indicators on H4 and D1 believe that the pair will continue its growth to 1.0100. The nearest resistance is at the parity level of 1.0000.
A mere 10% of analysts and 10% of oscillators adhere to the opposite viewpoint, thinking that the pair is overbought: they expect a decline to support 0.9880. The next support is at the level of 0.9845.


Roman Butko, NordFX


Attention: grab an unprecedented opportunity!
NordFX offers you a unique opportunity to trade cryptocurrencies (Bitcoin, Litecoin and Ethereum) with a leverage 1: 1000!


Notice: These materials should not be deemed a recommendation for investment or guidance for working on financial markets: they are for informative purposes only. Trading on financial markets is risky and can lead to a loss of money deposited.

#eurusd #gbpusd #usdjpy #usdchf #forex #forex_example #signals #forex #cryptocurrencies #bitcoin

https://nordfx.com/
 
TRADE BITCOIN WITH 1:1000 LEVERAGE

1513309916_TRADE_BITCOIN_x1000.png
As the great bitcoin rally continues, new crypto billionaires appear.
This December, NordFX presents the ULTIMATE offer:

Trade the most popular cryptos (Bitcoin, Litecoin, Ethereum) using MetaTrader4, and get:

– Narrow spreads: direct access to liquidity from all reputable exchanges
– Low commissions: up to 0.1% per side
– Margin Trading: leverage of up to 1:1000. We credit your trading for FREE!
– Ultimate safety of your funds
– Trade round the clock 24/7, 365 days a year.

As you are reading this, bitcoin bulls look set to push prices as high as $20,000 over the next few days.
Bitcoin has already exceeded gold, oil and diamonds in value.
What next?

Start Now
THE ULTIMATE WAY TO TRADE BITCOIN AND OTHER CRYPTOS!
https://nordfx.com/

#forex, #forex_forecast, #cryptocurrencies, #bitcoin, #litecoin, #ethereum
 
Forex Forecast for EURUSD, GBPUSD, USDJPY and USDCHF for 18 – 22 December 2017


First, a review of last week’s forecast:

- The Christmas holidays simply cannot help affecting financial market participants. They are the reason most analysts expected EUR/USD to move in the rather narrow range of 1.1685-1.1900. In fact, this channel turned out to be even narrower, ending up being 1.1717-1.1862, with the week’s fluctuations not exceeding 150 points. Thus, the week produced no real results: the pair ended it in almost the same place where it started, namely in the 1.1750 zone;

- In giving a forecast for GBP/USD, most experts (65%) voted for its fall, identifying 1.3300 as the support level. This was the level the pair descended to in the middle of the week. It then rebounded briefly, before returning and finishing the week there on Friday, 15 December.

- USD/JPY. Here, as is often the case, the analysts were defeated by the oscillators. Recall that the former voted for the continuation of the uptrend; the latter, meanwhile, signalled that the pair was overbought and could decline to 112.00-113.00, and proved completely correct: the weekly minimum was fixed at 112.02. The pair then rose 60 by points and stopped at 112.62;

- USD/CHF. Here the readings of many oscillators also said that the pair was overbought and would likely move south, and identified 0.9880 and 0.9845 as support levels. This forecast was fully vindicated. The pair repeatedly tried to break through the level of 0.9880 during the first half of the week, and an attempt on Wednesday ended up being successful. As a result, the pair sank to the second support level in the 0.9840 zone. After this, a reversal followed, and, like EUR/USD, USD/CHF returned to the week’s starting values.

1513491615_New_Year_ENG.png
Christmas: the end of the financial year ... Banks and funds have already wrapped things up and the Forex market is experiencing a lull. Therefore, as long as nothing extraordinary happens in the world (and we sincerely hope nothing does!), there should not really be any serious exchange rate fluctuations.
In these conditions, it is very difficult to make forecasts. This time, we, as usual, summarize the opinions of analysts from a number of banks and brokerages, as well as forecasts made on the basis of a variety of technical and graphical analysis methods. However, the overwhelming likelihood is that we will only be able to tell which of them came true at the beginning of the new year. Thus:


- Starting with EUR/USD, there is a very slight advantage on the side of the bears. 45% of experts have voted for the fall of the pair, 30% for its growth, and the remaining 25% have predicted a lateral trend. The situation remains the same with technical analysis, with about half of the indicators pointing southwards. However, it should be noted that about 20% of oscillators indicate that the pair is oversold. The resistance levels are 1.1815 and 1.1860; the support levels, meanwhile, are 1.1720 and 1.1650;

- GBP/USD. 50% of analysts expect growth, 25% a decline, and 25% predict a lateral movement. Most trend indicators (70%), like oscillators, are coloured red. At the same time, a third of the oscillators indicate that the pair is oversold. Graphical analysis agrees with them, showing a possible rise of the pair to 1.3425 on H4, and even higher to 1.3550 on D1. After that, the pair is expected to descend first to 1.3300, and then even lower to the support at 1.3225 (as per H4) or to 1.3065 (as per D1 readers). 65% of experts support such a medium-term drop;

- USD/JPY. Here, most analysts (65%), graphical analysis and indicators on H4 have firmly sided with the bears, expecting the pair to fall to at least 110.85. 30% of experts are waiting for the pair to return to 113.70. The remaining 5% of experts, as well as trend indicators and oscillators on D1, have taken a neutral position;

- The last pair of our review is the USD/CHF. Here, there is a complete discord among both experts and oscillators. Most trend indicators (75%) point north on both H4 and D1. Graphical analysis supports this development, predicting a side trend with a predominance of bullish sentiment on D1. However, according to its readings, the pair may first brush against the bottom in the 0.9800 zone, and only then perform a U-turn. After this, it will rise to the resistance in the 0.9925-0.9935 zone. Once it breaks through this, it will rise even higher to 0.9975.

Dear trading colleagues,
Our next forecast will be released next year. From the bottom of our hearts, we wish you a Merry Christmas and a Happy New Year. Whilst you are enjoying the festivities, however, please do keep in mind that even though the Forex market may calm down during the holiday period, cryptocurrency trading does not diminish even for a second.


NordFX offers you the unique opportunity of trading cryptocurrencies (bitcoin, Litecoin and Ethereum) with 1: 1000 leverage 24 hours a day, 7 days a week, 365 days a year!
After all, earnings, unlike Forex, never sleep.

Roman Butko, NordFX


Notice: These materials should not be deemed a recommendation for investment or guidance for working on financial markets: they are for informative purposes only. Trading on financial markets is risky and can lead to a loss of money deposited.

#eurusd #gbpusd #usdjpy #usdchf #forex #forex_example #signals #forex #cryptocurrencies #bitcoin

https://nordfx.com/
 
Forex Forecast for EURUSD, GBPUSD, USDJPY and USDCHF for the First Quarter of 2018


This forecast has been written on Saturday, 30th December, right before the new year of 2018. As per tradition, before forecasting what will happen next year, we first draw conclusions about what has already happened this year:

If you recall, several months ago we discussed forecasts for EUR/USD given by strategists from some of the world’s leading banks.

Out of the 80 banks that published their forecasts in June, only 23 of them predicted growth to $1.15 by year-end. Even fewer thought the pair would reach $1.18.
Analysts from the Canadian Imperial Bank of Commerce were largely bullish, believing that by the end of December the pair would be trading near $1.14. The view at Bank of America Merill Lynch was the following: 1.15 at year-end 2017 and 1.19 at year-end 2018.
Rand Merchant Bank gave an even more conservative forecast this summer, expecting the pair to be at $1.12 halfway through next year. Bloomberg’s research yielded a similar result of $1.13. BNP Paribas analysts expected the pair to reach 1.15 in Q1 2018.

Strategists from Germany’s second largest bank, DZ Bank AG, proved more accurate, but even they did not expect EUR/USD to greet the New Year near 1.20. Societe Generale, however, hit the spot.
A common adage is that there are as many opinions as there are people. We therefore attempted to unite these opinions and drew out a channel within the boundaries of 1.15–1.21 for EUR/USD. This ended up being accurate, with the pair reaching the minimum of 1.1553 on 7 November and the peak of 1.2092 two months prior, on 8 September 2017.


When it comes to forecasting the future, gauging market sentiment during the first week of January is particularly challenging; a certain degree of clarity tends to come only when markets finally re-open in the New Year. Therefore, we offer our forecast for Q1 2018, rather than the first week of January. This encompasses the opinions of analysts from a whole roster of banks and brokerages, as well as the findings of a wide range of technical and graphical analysis methods.

- almost 100% of trend indicators and around 75% of oscillators on D1, W1 and MN are coloured green for EUR/USD. Despite this, only 20% of experts agree with this view: they suggest the 1.2200–1.2300 area as a target.
The contrasting viewpoint is held by 80% of analysts and sees the pair descending to the Pivot Point of the medium-term channel at 1.1800. After this, the pair may descend even further to the channel’s lower boundary in the 1.1500–1.1550 area. A quarter of oscillators also expect a growth reversal and signal that the pair is overbought;

- GBP/USD is in a similar situation, with the difference being one of percentages. Thus, a mere 10% of analysts believe the pair will grow to the resistance at 1.4000, while 25% believe in a sideways movement along 1.3500. Most experts (65%), however, believe the pair will reverse downwards after reaching the August-September 2016 peaks. The first noteworthy support level is near 1.3000, with the next one being at 1.2800. Around 15% of oscillators signal the pair is overbought;

- USD/JPY. Analyst predictions and indicator signals on D1, W1 and MN all differ starkly. The overwhelming majority of experts (80%) think that the pair will experience a minor fall to 111.00–112.00 in the near future.
The number of bears drastically decreases on the W1 and MN intervals, however. Now, 55% of analysts, corroborated by around 80% of trend indicators and oscillators, predict the pair’s growth to the upper bound of the medium-term channel in 114.50–115.00.
Graphical analysis, meanwhile, suggests the pair will move in the narrow side-corridor of 112.00–113.75 throughout January;

- the last pair of our forecast is USD/CHF. Around 65% of experts believe the pair will be able to break through the support at 0.9730 and subsequently descend to 0.9600. After this, it should rebound upwards and return to parity at 1.0000.
Even so, on D1 around a third of oscillators indicate the pair is oversold. When we look at W1 and MN, though, such signals are absent. Therefore, we cannot exclude that the next few days may see a very minor correction, right before the pair will end up moving southwards to the support at 0.9600.


Dear traders,
NordFX gives you the opportunity to trade cryptocurrencies (bitcoin, Litecoin and Ethereum) with unique leverage levels of 1:1000. Spreads are minimal, and it takes under 1 minute to open an account.

http://nordfx.com/promo/bitcoinleverage1000.html

1514628140_Crypto_MQL_2018.png


Roman Butko, NordFX


Notice: These materials should not be deemed a recommendation for investment or guidance for working on financial markets: they are for informative purposes only. Trading on financial markets is risky and can lead to a loss of money deposited.

#eurusd #gbpusd #usdjpy #usdchf #forex #forex_example #signals #forex #cryptocurrencies #bitcoin

https://nordfx.com/
 
NordFX: The Best Broker to Work with Cryptocurrencies

1515056748_IAFT_NordFX_Bitcoins.png

At the very beginning of the new year, the winners of the 2017 IAFT Awards were announced. NordFX was overwhelmingly declared ‘The Best Broker to Work with Cryptocurrencies’.

The organizer of the IAFT Awards is the International Association of Forex Traders (IAFT), in which more than 200,000 traders from across the world take part. Each of them had the chance to express their appreciation and trust for any given broker by voting on the awards website.

We are grateful to all who gave their vote to our company. It should be noted that the nomination ‘The Best Broker to Work with Cryptocurrencies’ is new for this award, and the victory in this inaugural year undoubtedly confirms that the services NordFX offers cryptotraders today are not just in demand, but are also unique.

Even when one’s starting capital is low, leverage of up to 1: 1000 for transacting with bitcoin, Litecoin and Etherium, combined with minimal spreads, opens the possibility of making significant profits off both the growth and fall of cryptocurrencies. The ability to have an account in bitcoins should interest not only active traders, but also passive investors, who are used to working only with crypto exchanges. Moreover, opening such an account takes only about a minute and takes place exclusively online: this is yet another undisputed advantage of NordFX.

https://nordfx.com
 
Forex Forecast for EURUSD, GBPUSD, USDJPY and USDCHF for January 8 - 12, 2018


First, a review of last week’s forecast:

- The markets are apparently still on winter vacation. Hence, the pair EUR/USD spent five days in the very narrow lateral channel of 1.2000-1.2085 and completed the five-day period in the same place where it started at 1.2030;

- it is difficult to conceive a 40-point weekly increase as being serious growth. Rather, it represents a lateral trend once again, which for GBP/USD was in the corridor 1.3493-1.3611. Unlike EUR/USD, this width at least slightly exceeded 100 points;

- USD/JPY grew by 40 points as well, demonstrating its intent to stay in the corridor 112.00-113.75 for a while. This is what the readings of the graphical analysis that we announced a week ago were talking about. Having quickly reached the lower limit of this range on Monday 2 January, the pair reversed and climbed to 113.30 on Friday 5 January. After that, a 25-point rebound followed, and the pair froze in the zone of 113.05;

- a classic lateral trend was also demonstrated by USD/CH: it denoted 0.9745 as a Pivot Point. The minimum of this week was at 0.9698, with a maximum 99 points higher at 0.9797.


As for the forecast for the coming week, summarizing the opinions of analysts from a number of banks and brokerages, as well as forecasts made on the basis of a variety of methods of technical and graphical analysis, we can say the following:

- EUR/USD is currently in a landmark zone: on the border between the two-year high of summer end/autumn start 2017, and the lows of June 2010 and July 2012. This is clearly visible on the graphs of W1 and MN. This zone may contend to be "Barrier of the Decade"; where the pair moves from it will depend on major economic and political events. These are not, however, expected this week. That is why the opinions of experts at the moment are divided almost equally.
55% of them, supported by graphical analysis and oscillators on D1, think that the pair will try again to break through the resistance of 1.2100 and subsequently rise to the zone 1.2150-1.2200. As for the remaining 45%, in their opinion, the pair will first decrease to the Pivot Point of the medium-term summer/winter channel of 2017 (1.1830). It will then potentially go even further, to its lower border at 1.1550-1.1650.
It should be noted that in the medium term, the number of supporters of the bearish scenario, counting on strengthening the dollar, increases from 45% to almost 70%;
1515324042_EURUSD_08.01.2018.png

- as for the GBP/USD, most analysts (85%) voted for the fall of this pair. The nearest support is 1.3400, the target is 1.3300.
Only 15% of analysts side with the alternative scenario, along with almost 100% of trend indicators and oscillators. They indicate a height of 1.3655 and think that the pair will only reach southwards upon having reached this height;

- USD/JPY. The graphical analysis on D1 still draws a continuation of the lateral corridor. However, as if anticipating the end of the New Year holidays, volatility forecasts are upgraded, with the corridor’s borders being expanded from 112.00-113.75 to 111.60-114.40.
Recall that the 111.60 zone is the Pivot Point of the medium-term channel 108.00-114.75, in which the pair throughout the whole of last year. 65% of experts agree that this situation will continue
After this, a rebound up should follow. If the pair manages to break the upper boundary of the channel, its target will be a maximum of 2016, 118.60. This possibility is not ruled out by 55% of analysts;

- The last pair of our review is USD/CHF. This New Year period immediately reminds us of the "Black Thursday" on January 15, 2015. Then, because of a decision by the Central Bank of Switzerland, the pair immediately collapsed from 1.0200 to 0.6700, losing about 35% of its value. However, in just two months it fully recovered, which once again proved the speculative impulsiveness of the market.
As for the forecast for the near future, like last week, about 65% of experts believe that the pair will be able to break through the support of 0.9730 and fall to the zone of 0.9600-0.9650. The rebound should happen then, and the pair should return to parity at 1.0000.


Dear traders,
NordFX offers you a unique opportunity to trade cryptocurrencies (bitcoin, Litecoin and Ethereum) with a leverage of 1: 1000!
Minimal spreads, account opening in just 1 minute.

http://nordfx.com/promo/bitcoinleverage1000.html


Roman Butko, NordFX


Notice: These materials should not be deemed a recommendation for investment or guidance for working on financial markets: they are for informative purposes only. Trading on financial markets is risky and can lead to a loss of money deposited.

#eurusd #gbpusd #usdjpy #usdchf #forex #forex_example #signals #forex #cryptocurrencies #bitcoin

https://nordfx.com/
 
Forex Forecast for EURUSD, GBPUSD, USDJPY and USDCHF for January 15 - 19, 2018


First, a review of last week’s forecast:

- EUR/USD. Recall that the majority of experts (55%), supported by graphical analysis and oscillators on D1, voted for the pair's growth to 1.2200. This forecast turned out to be 100% true: it was at this point that the pair ceased movement at midnight on Friday 12 January. It should be noted that the publication of the minutes of the last ECB meeting, according to which the regulator is planning to curtail its 2.5 trillion-euro bond-buying programme in 2018 - a programme which should seriously accelerate the recovery of the eurozone - contributed to such impressive growth of the euro;

- GBP/USD. The overwhelming majority of analysts (85%) voted for the fall of this pair, and the level of 1.3400 was named as the nearest support. The pair was bearish until Thursday, but it was only able to go down to 1.3455, after which it turned and, following in the euro’s steps, rushed up, completing the five-day period in the zone 1.3730;

- While the yield of 10-year and 25-year Japanese state bonds grows, the dollar fell against the Japanese yen. In this case, the experts called out 111.60 as a target, which is also the Pivot Point of the medium-term channel 108.00-114.75 in which the pair USD / JPY has moved during the entirety of the past year. This plan was not only completed, but also somewhat overdone -the pair ended up near 111.00 at the end of the trading session;

- As for USD/CHF, most analysts (65%) agreed that the pair would be able to break through the support of 0.9730 and fall to the zone of 0.9600-0.9650. With a small allowance, this is exactly what happened: mirroring the movements of EUR/USD, by the end of the week the pair was able to reach the local minimum at 0.9664.


As for the forecast for the coming week, summarizing the opinions of analysts from a number of banks and brokerages, as well as forecasts made on the basis of a variety of methods of technical and graphical analysis, we can say the following:

- EUR/USD. The pair is still in the barrier “zone of the decade”, marked by the two-year high of 2017 and the lows of June 2010 and July 2012; the direction in which it will move from there will depend on major economic and political developments and decisions. That's why there is uncertainty among experts: 40% see growth ahead, 40% see a fall, and 20% just shrug their shoulders.
As for the trend indicators, it is clear that they are all coloured green: the nearest target is 1.2360. But a quarter of oscillators on both H4 and D1 are already giving signals the pair is overbought, which indicates a possible trend reversal.
Graphical analysis also agrees with this scenario. According to its readings, the pair should return first to 1.2090, and in the event of a breakthrough, go down even further, to the support line of the two-month rising channel in the zone of 1.2000-1.2020;

- 40% of analysts believe that following the weakening of the dollar, the GBP/USD will continue its movement in the medium-term rising channel, which began a year ago when 2016 became 2017. In this case, its immediate target will be the 1.3835-1.4000 zone, with the next one being 1.4200.
An alternative scenario is supported by 60% of experts, who cite the uncertainty surrounding the Brexit negotiations. A trend reversal is also predicted by graphical analysis on H4 and by the approximately 20% of oscillators signalling the pair is overbought. The support levels are 1.3600, 1.3520 and 1.3465;
1515844878_GBPUSD_15.01.2018.png

- USD/JPY. Graphical analysis on D1 still draws out a continuation of the lateral corridor, denoting 110.75-113.35 as its boundaries. 30% of experts vote for the growth of the pair in the coming days. Resistance is at the levels of 112.00, 113.35 and 114.75.
As for the opinion of most analysts (70%), supported by 10% of oscillators on D1, the pair will continue its fall to the lower boundary of the mid-term side channel 108.00-114.75. The nearest support is in the 110.00 area;

- The last pair of our review is USD/CHF. On January 16, we are expecting to hear the speech of the head of the National Bank of Switzerland: this has again reminded us of the "Black Thursday" on January 15, 2015. However, this time there will, most likely, be no surprises.
As for the forecast for the near future, like last week, about 60% of experts express bearish sentiment, believing that the pair may fall to the support at 0.9575. The next support is 0.9430.
Only 40% of analysts have given their votes for the rise of the pair to the resistance at 0.9835 and its subsequent return to 1.0000.


Dear traders,
NordFX offers you a unique opportunity to trade cryptocurrencies (bitcoin, Litecoin and Ethereum) with a leverage of 1: 1000!
Minimal spreads, account opening in just 1 minute.
http://nordfx.com/promo/bitcoinleverage1000.html


Roman Butko, NordFX


Notice: These materials should not be deemed a recommendation for investment or guidance for working on financial markets: they are for informative purposes only. Trading on financial markets is risky and can lead to a loss of money deposited.

#eurusd #gbpusd #usdjpy #usdchf #forex #forex_example #signals #forex #cryptocurrencies #bitcoin

https://nordfx.com/
 
Back
Top