Technical Analysis by Admiral Markets

Technical Overview - Important CAD Pairs

EURCAD


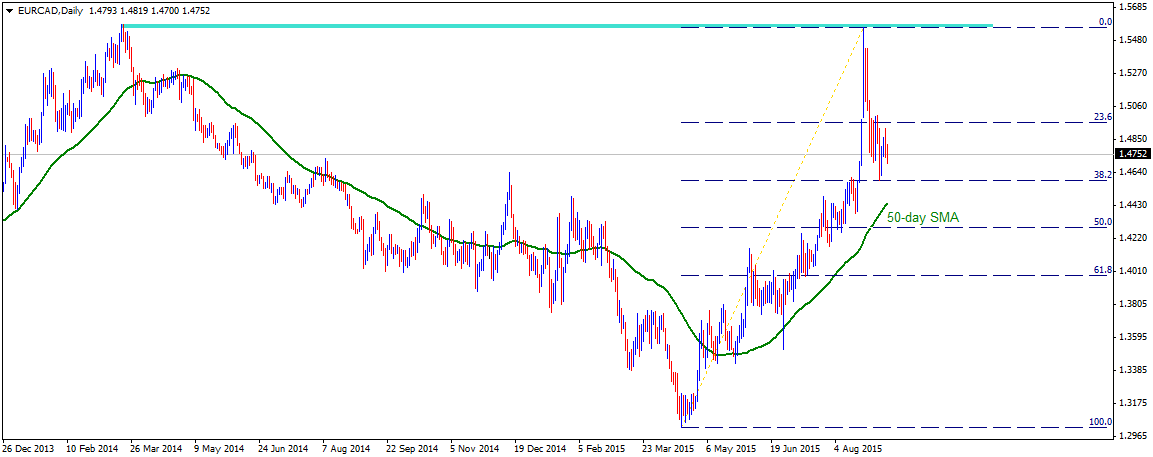
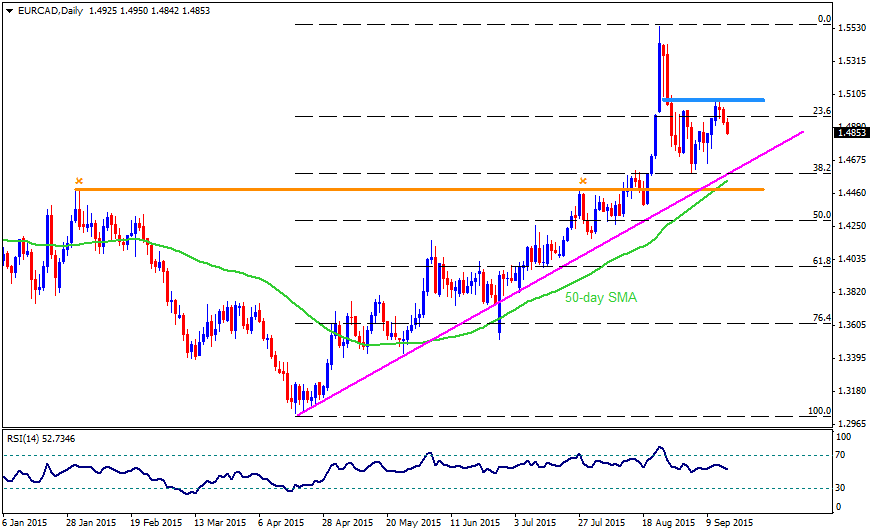
Although the pair made a big up-move from nearly 2-year low touched in April, the momentum failed to lift the pair beyond March 2014 highs. Reversal from 1.5560-80 resistance, however, seems to have found some support near 1.4600-1.4580 area, representing 38.2% Fib. retracement level of its April to August up-move, and is currently holding above 1.4700 mark. Should the pair resume its corrective move and drop back below 1.4700 mark, it seems likely to retest 1.4600-1.4580 support area. Further, decisive weakness below 1.4600 support now seems to open room for extension of the near-term weakening trend towards 50% Fib. retracement level support near 1.4300-1.4285 zone, with 50-day SMA near 1.4460-50 area acting as intermediate support. Meanwhile on the upside, 1.4860-80 horizontal zone seems to provide immediate resistance. This is closely followed by a strong resistance near 1.4980-1.5000 psychological mark, also nearing 23.6% Fib. retracement level. Only a sustained strength above this strong resistance might negate any near-term bearish expectations, thus paving way for continuing the near-term upward trajectory towards back towards 2015 daily closing high resistance near 1.5400-20 region.
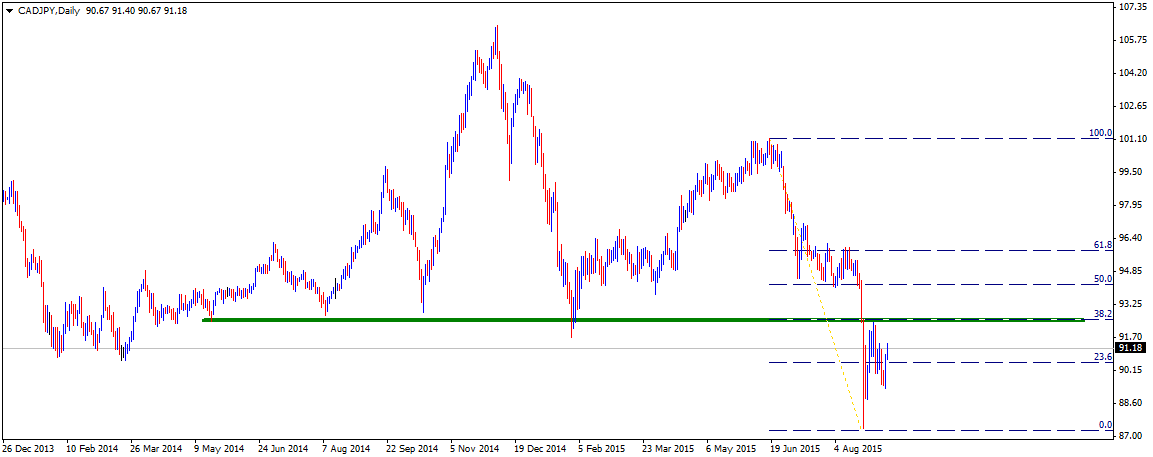
CADJPY


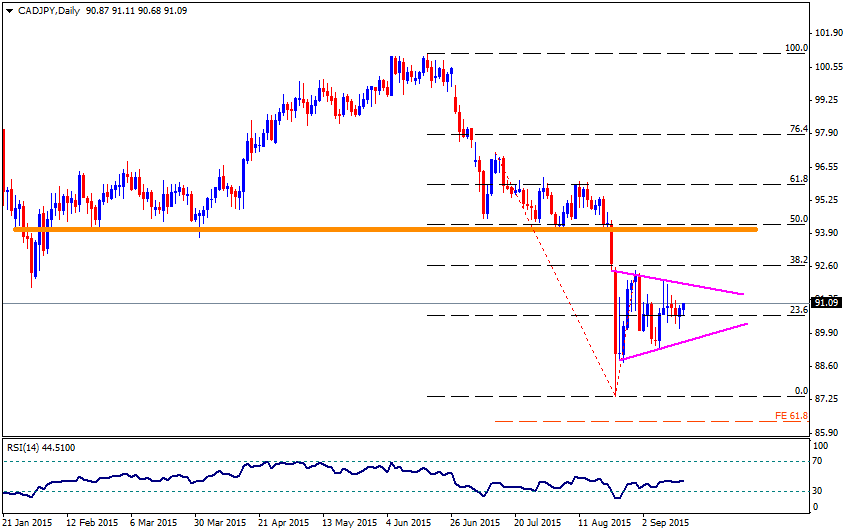
Following a break below an important support near 92.00 mark and a subsequent drop to the lowest level since Jan. 2013, the pair witness some pull-back from lower levels to retest the important support break-point. The support break-point now turned immediate strong resistance, near 92.00 mark, also coincides with 38.2% Fib. retracement level of June to August sharp fall. Hence, from current levels the pair seems more likely to resume its downward trajectory. However, a decisive strength back above 92.00 mark might negate the bearish outlook and is likely to boost the pair further in the near-term towards testing its next resistance near 94.00-94.20 area, marking 50% Fib. retracement level. On the immediate downside, 23.6% Fib. retracement level near 90.50 level seems to provide immediate support. Failure to hold this support now seems to drag the pair back towards testing 89.00 mark support, also coinciding with recent daily closing low levels.
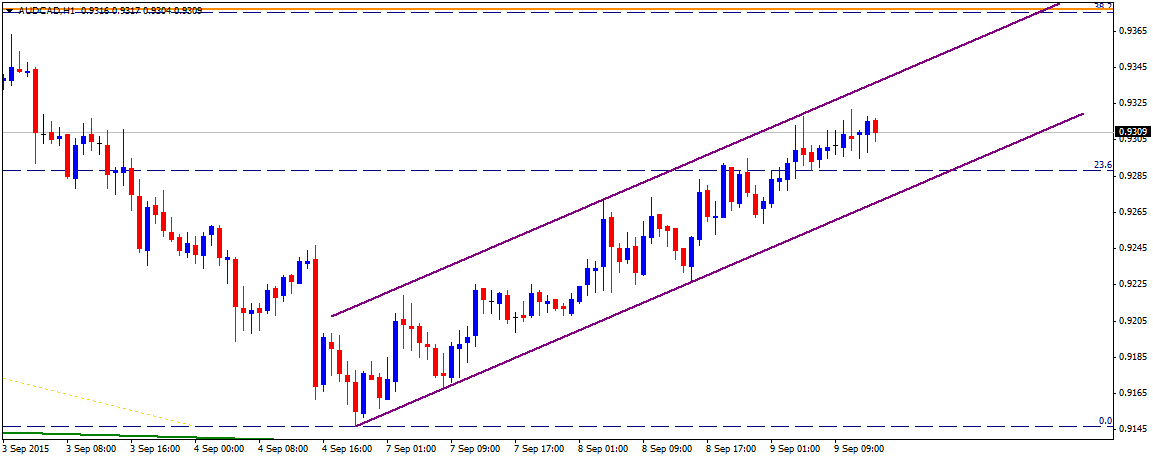
AUDCAD


The pair is attempting some recovery from its lowest level since July 2010, touched earlier in Sept., and has now moved within a short-term ascending trend-channel formation on 1-hourly chart. However, if taken in conjunction with its fall from August highs, the ascending channel could possibly constitute towards formation of a continuation Flag chart-pattern. However, considering that the pair has already cleared 23.6% Fib. retracement level of Aug.-Sept. downfall, it could possibly make an attempt to build on to it pull-back towards testing a support turned immediate strong resistance near 0.9375 level, comprising of the upper trend-line of the ascending channel and 38.2% Fib. retracement level. 23.6% Fib. retracement level, also coinciding with the lower trend-line support of the channel, near 0.9290 level now seems to protect immediate downside. A decisive weakness below this immediate support might trigger resumption of the weakening trend, thus dragging the pair immediately towards 0.9200 horizontal support.

CADCHF


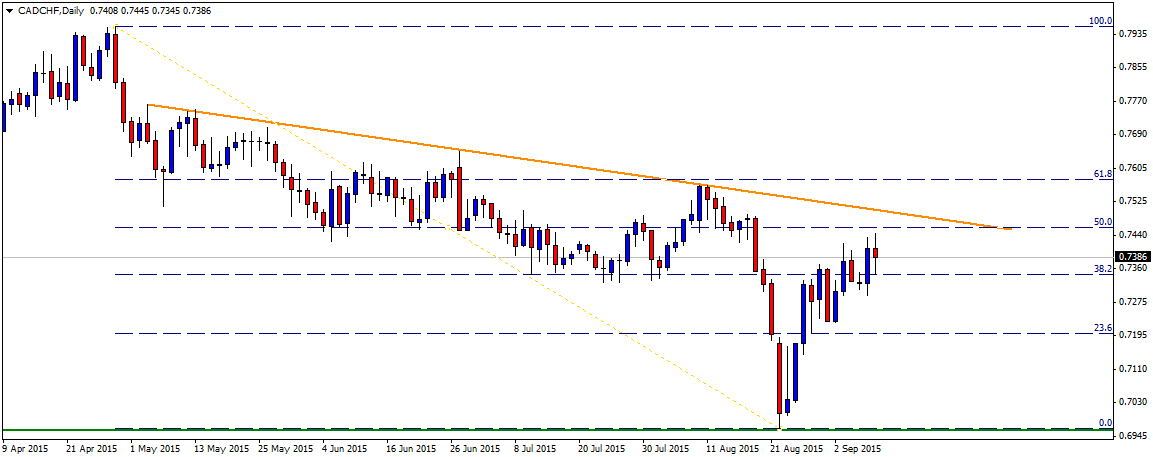
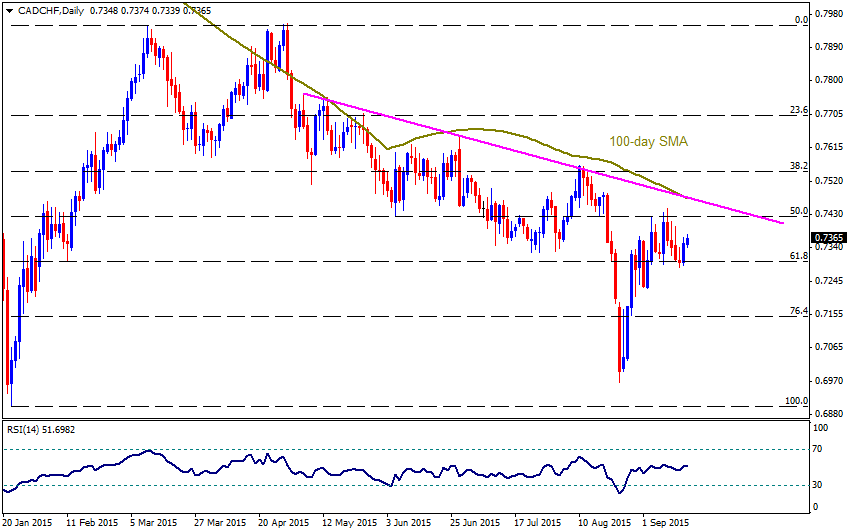
The pair managed to hold and bounce from an important support near 0.6970-50 area, marking 2015 daily closing lows. From current levels, the pair seems to be headed towards an intermediate resistance near 0.7450 representing 50% Fib. retracement level of April to August down-leg. The bounce could further get extended towards testing a descending trend-line resistance, currently near 0.7500 mark. Further, a decisive strength above 0.7500 mark now seems to trigger an immediate short-covering move towards 61.8% Fib. retracement level resistance near 0.7600 level. Meanwhile, a drop back below 38.2% Fib. retracement level immediate support near 0.7350-40 zone is likely to drag the pair back towards 0.7230 support area, nearing 23.6% Fib. retracement level. A sustained weakness below 0.7230 support, leading to a subsequent weakness below 0.7170 is likely to confirm retest of 0.7000 important psychological mark support.


“Original analysis is provided by Admiral Markets
 
Technical Update – Important GBP Pairs

GBPUSD


Having breached 1.5300 mark, the GBPUSD swiftly rallied towards the 1.5412 highs; however, 38.2% Fibo of its recent decline, capped the pair's further advance, signaling a pullback towards 1.5300, breaking which 1.5250, 1.5200 and the 1.5170-60 area, including recent lows previously tested in June, are likely supports that the pair could test during its continued downward trajectory. Moreover, extended declines below 1.5160 could make it vulnerable to test 1.5000 psychological magnet with 1.5080 being intermediate rest. On the upside, 1.5440-50 area becomes strong immediate resistance to limit the pair's advance on the break of 1.5415. Further, a decisive break above 1.5450 could fuel the pair's rally towards 1.5580 and the 1.5700 area; though, 1.5500 round figure mark can act as a buffer.

GBPAUD


Failure to break 2.2100 area seems pulling back the GBPAUD towards testing a month old ascending trend-line support, near 2.1700 round figure mark. Should the pair fail to stop its decline near 2.1700, it can quickly decline to 50% Fibo of its recent advance, near 2.1620, breaking which 2.1515-10 is likely intermediate support before the pair could plunge to 2.1410 – 2.1400 horizontal mark, including late August lows. Moreover, extension of downturn below 2.1400 confirms the pair's "Double-Top" formation, making it vulnerable to test sub-2.0900 area. Alternatively, 2.1900 is likely immediate resistance to restrict the pair's up-move, breaking which 2.2000 psychological magnet and the 2.2100 horizontal mark are likely consecutive resistances during the pair's extended upward trajectory. Given the pair's ability to break 2.2100 on a closing basis, it can target August highs, near 2.2400 area with 2.2275-80 being intermediate resistance.

GBPJPY


Break of 185.30 – 185.00 important support, including 50% Fibo of its April – June rally and July lows, magnified the GBPJPY decline towards 180.00 region; however, bounce from the lows, near 180.40, pulled the pair back to mentioned support-turned-resistance region that currently restricts it's near-term advance. Should the pair manages to close above 185.30, also surpassing the 200-day SMA, presently at 185.50, chances of its 187.30 re-test can't be denied, breaking which 38.2% Fibo, near 188 round figure mark, followed by the 189.50, are likely consecutive resistance that the pair could aim during its successive up-move. Meanwhile, 184.00 could act as an immediate support, breaking which 61.8% Fibo, near 182.80 and the 181.30 are expected downside supports that the pair could test. On a further decline below 181.30, the recent lows of 180.40 and the 179.00 can restrict the pair's additional downturn.

GBPCHF


GBPCHF's reversal from 1.5400 pulled it back towards 200-day SMA re-test during late August and early September; however, the pair's bounce from the moving average seems currently facing 1.5100 as an immediate resistance. Should it manages to break 1.5100 on a closing basis, the pair can quickly rise to 1.5300-10 resistance area with 1.5175-80 being intermediate resistance while further up-move beyond 1.5310 can be capped by the August highs, near 1.5400 mark. On the downside, 1.4900 is likely a nearby support for the pair, breaking which 38.2% Fibo of its May – August advance, near 1.4800 psychological mark, is likely buffer prior to the pair's re-test of 200-day SMA, presently near 1.4650. Given the pair's ability to close below 200-day SMA, it can plunge to 61.8% Fibo, near 1.4430 mark.


“Original analysis is provided by Admiral Markets
 
Technical Update - AUDNZD, AUDJPY and AUDCHF

AUDNZD

The pair once again managed to rebound from an important support near 1.0940-20 area, also nearing 100-day SMA, and move back to retest a short-term descending trend-line resistance, near 1.1220 region. A decisive break above this trend-line resistance now seems to set the stage for continuing the pair's near-term upward trajectory towards 2015 daily closing highs resistance near 1.1360-80 zone. Further, sustained strength above 1.1360-80 resistance might continue supporting the prospects of extending the near-term appreciating move towards 61.8% Fib. expansion level resistance near 1.1550 level. Meanwhile, reversal from current resistance level is likely to find strong support near 1.1050 level, which if broken seems to force the pair back towards retesting 1.0940-20 important support. Furthermore, a decisive break below this important support, seems to set the stage for a test of its next major support at 200-day SMA, currently near 1.0700-1.0680 zone.

AUDJPY

After nearly retesting 82.00 round figure mark support, the pair has been steadily attempting a recovery and is now moving close to its immediate resistance near 86.00 mark representing 38.2% Fib. retracement level of Aug. 11-24 sharp fall. Move above 86.00 mark resistance is likely to be followed by resistance at 50% Fib. retracement level near 87.30-40 zone. Sustained strength above 50% Fib. retracement level has the potential to boost the pair further towards testing a very important support break-point now turned important resistance near 89.40 level, also coinciding with 50-day SMA. Meanwhile on the downside, 23.6% Fib. retracement level near 84.60-50 area seems to have emerged as immediate support. Failure to hold this immediate support could possibly drag the pair back towards 82.00 round figure mark important support. Further, a decisive break below 82.00 mark support might now open room for extension of the weakening trend towards 61.8% Fib. expansion level support near 80.60-50 zone.

AUDCHF


The pair continues holding a short-term ascending trend-line support and is making an attempt to conquer a previous strong support now turned immediate strong resistance, near 0.6940-50 area. The combination of ascending trend-line and horizontal resistance seems to constitute towards formation of an ascending triangle, thus increasing the possibilities of a further up-move once the pair manages to clear 0.6950 resistance. A clear strength above this strong resistance seems to trigger an immediate short-covering rally towards 0.7100 mark resistance, also coinciding with 50% Fib. retracement level of April to August down-leg. The recovery could further get extended towards 61.8% Fib. retracement level resistance near 0.7240-50 region. Alternatively, should the pair starts reversing from current resistance level, it might continue finding support at the ascending trend-line, currently near 0.6820-0.6800 region, also coinciding with 23.6% Fib. retracement level. Failure to hold this support would make the pair vulnerable to drop back towards recent closing lows support near 0.6650 level.


“Original analysis is provided by Admiral Markets
 
Technical Outlook – NZDUSD, NZDJPY, GBPNZD and NZDCHF

NZDUSD


During its bounce from 100% FE, the NZDUSD retested the support breakpoint-turned-resistance, near 61.8% FE at 0.6425-30, ahead of RBNZ meeting; however, with the interest rate cut, the pair again struggles near 0.6300 area, indicating 100% FE, at 0.6250, as an immediate support, breaking which 0.6200 round figure mark can become a buffer prior to the pair's plunge to 0.6000 psychological magnet. On the upside, 0.6350 and the 0.6425-30 are likely immediate resistances that the pair have to tackle in order to aim at 0.6530 resistance-zone. Moreover, sustained break of 0.6530 can strengthen the pair towards 0.6650 and the 0.6700 mark in a quick up-move.

NZDJPY


Short-term descending trend-channel seems defining the NZDJPY's immediate down-trend with 74.00 round figure mark being support and the 77.40-50 mentioned as a resistance. However, 23.6% Fibo of its late-July-August decline, near 75.00 mark, is likely immediate support and the 38.2% Fibo, at 76.50, can provide intermediate stops to the pair's trading. Given the pair's ability to break 74.00 on a closing basis, it can quickly plunge to August lows, near 72.30 with 73.00 being a halt. Alternatively, sustained trading above 77.50 can immediately strengthen the pair to aim towards 79.00 and the 80.00 psychological levels on the upside.

GBPNZD


Even after failing to break 61.8% Fibonacci Retracement of its decline connecting 2008 highs to 2013 lows, near 2.5180, short-term ascending trend-line keep favoring the GBPNZD up-move. However, ascending trend-line, connecting recent highs, near 2.4550, and the 50% Fibo of the said move, also encompassing the said trend-line support, near 2.3750-40 area, can restrict the pair's near-term trading. Should the pair manages to close above 2.4550, the 2.4830-50 area can provide an intermediate resistance to the pair prior to its rally towards August highs and 61.8% Fibo, near 2.5180. On the downside, a close below 2.3740 is likely puling the pair back to 2.3370-50 area, breaking which 2.3000 psychological magnet becomes a strong support to restrict the pair's further decline.

NZDCHF


Having bounced from 61.8% FE of its May – July decline, the NZDCHF failed to break the 50-day SMA, forming a rectangle technical pattern on its D1 chart where in the upside is limited near 0.6300 round figure mark, encompassing 50-day SMA, while on the downside can be restricted by the 61.8% FE, near 0.6060-50 area. Though, comparatively stronger CHF and a downward slating SMAs keep favoring the pair's plunge to 0.5980 and the recent lows near 0.5770. Meanwhile, an upside break of 0.6300 on a closing basis could quickly fuel the pair to 0.6370, 23.6% Fibo, and ultimately to 0.6500 – 0.6510 horizontal mark, that includes 100-day SMA, restricting the pair's near-term advance.


“Original analysis is provided by Admiral Markets
 
Technical Outlook - CHF Pairs

USDCHF


Following its strength above 200-day SMA and a subsequent move above a near-term consolidation range, the pair once again is consolidating around a descending trend-line resistance near 0.9800-20 area. The descending trend-line extends from Jan. high through highs tested in March and in August and hence a decisive strength above this immediate resistance now seems to pave way for continuing the pair's near-term upward trajectory towards reclaiming parity mark. However, failure to conquer this immediate resistance and reversal back below 0.9700-0.9680 immediate support might force the pair back towards testing 200-day SMA support, currently near 0.9540-30 zone. Further, a decisive weakness back below 200-day SMA has the potential to continue exerting near-term pressure on the pair towards retesting the very important short-term ascending trend-line support near 0.9300 mark.

EURCHF


After sustaining its strength above 200-day SMA and subsequently clearing 61.8% Fib. expansion level resistance near 1.0900 level, the pair on Friday reclaimed 1.1000 mark for the first time since Jan. 15. From current levels the pair seems more likely to extend its near-term upward trajectory towards 1.1130 level, marking 61.8% Fib. retracement level resistance of it's big fall on Jan. 15. Meanwhile on the downside, 61.8% Fib. expansion level resistance break-point near 1.0920-1.0900 zone now seems to protect immediate downside. Failure to hold this immediate support, leading to a subsequent weakness below 50% Fib. retracement level support near 1.0860-50 area, seems to drag the pair back towards testing 200-day SMA, currently near 1.0730-20 region.

CHFJPY


The pair remains within a well-established down-trend, as depicted by formation of a descending trend-channel on daily chart. After testing the lower trend-line support the pair is witnessing a bounce back from near-term oversold conditions. From current levels, bounce above 124.00 mark is likely to confront strong resistance at its previous strong support turned resistance area near 125.00 mark. However, should the pair manage to conquer 125.00 mark, it seems more likely to further extend the bounce towards testing another important resistance confluence near 126.50-70 zone, comprising of the upper trend-line resistance of the channel and 200-day SMA. Meanwhile on the downside, weakness below 123.00 round figure mark support is likely to find strong support near 122.20-122.00 horizontal support area. Failure to hold this 122.00 mark support seems to exert further near-term pressure on the pair towards retesting the lower trend-line support of the channel, currently near 121.10-121.00 mark.


“Original analysis is provided by Admiral Markets
 
Technical Outlook - US Equity Indices

Dow Jones Industrial Average [DJI30]


Even if the index tested lowest level in nearly two years, during the Yuan devaluation plunge, the Dow Jones Industrial Average [DJI30] failed to break the longer term ascending trend-channel, connecting lows marked during 2009 and 2011. The equity gauge is currently witnessing a pullback towards 16800 horizontal mark, breaking which 17000 round figure mark and the 17200 are likely intermediate resistances that the index could test prior to targeting 17500 area. Should it manage to close above 17500 on a weekly basis, chances favoring the index rally towards 17900 and the 18000 psychological mark can't be denied. Alternatively, 16000 mark can act as an immediate support before testing the 23.6% Fibo of its 2009 – 2015 successive up-move, near 15500, closely followed by the mentioned channel support, presently near 15200. Moreover, extended declines below 15200 can make the indeed vulnerable to plunge towards 14500 support region.

Nasdaq [NQ100]


Having bounced from its 3900 mark plunge, the Nasdaq [NQ100] managed to re-test 4370 level; however, 200-day SMA, currently near 4385, restricted further up-move and made its trading limited near the 4330-40 horizontal support-turned-resistance area. Should it fail to surpass the 4340, the 4200 – 4190, encompassing 50% Fibo of its October 2014 – July 2015 rally, could provide immediate support to the index, breaking which 4130 and the 61.8% Fibo, near 4070 are likely consecutive rests during the index downward trajectory. On an extended decline below 4070, the index could aim towards testing sub-4000 mark. On the upside, a sustained break of 4340, also surpassing the 200-day SMA, near 4385, can quickly fuel the index towards 4450-60 resistance region, including 23.6% Fibo, while a successive rally beyond 4460 can make it test 4560 horizontal mark, a break of which indicates the index up-move towards 4650 resistance zone.

S&P 500 [SP500]


Following its plunge to the lowest level in a year, the S&P 500 [SP500] seems forming a short-term ascending triangle, bullish technical pattern, that signals 1930 as a support and 1970, followed by the resistance-line of the formation, near 1996 as strong levels to determine the near-term trend of the index. Should it manage to break 1996, also surpasses the 2000 round figure mark, the equity gauge may target 2030-40 horizontal resistance region with 61.8% Fibo of its May – August decline, near 2020 being intermediate cap. On a further advance surpassing 2040, the index can surpass 2100 area; though, 2065 may offer a rest place. On the downside break of 1930, the gauge becomes vulnerable test 1900 psychological mark, also encompassing 23.6% Fibo, breaking which 1860 can act as a buffer prior to its plunge to 1800 round figure mark.


“Original analysis is provided by Admiral Markets
 
Technical Overview: Important EUR Pairs

EURGBP


Ever since the EURGBP flipped from its August highs, near 0.7422, it kept marking a lower low formation, as indicated by the descending trend-line resistance that currently restricts its immediate up-move, near 0.7350-55; however, pair's downside have been limited by the 38.2% Fibo of its August rally, near 0.7250-40, plotted with horizontal support. Presently, 23.6% Fibo, near 0.7300 round figure mark can become a nearby support prior to the pair's test of 0.7250-40 support area, breaking which 50% Fibo, near 0.7180, 0.7150 and the 0.7100 round figure mark are likely consecutive supports for the pair before it can plunge to 0.7000 psychological magnet. On the upside, a sustained break of 0.7355 can quickly trigger the pair's up-move to August highs, breaking which 0.7450 horizontal mark could restrict further advances by the pair. Given the pair's ability to break 0.7450 on a closing basis, chances of its rally towards 0.7600 area can't be denied.

EURJPY


Failure to break 137.00 horizontal resistance pulled the EURJPY towards testing a lowest level in a week; however, 38.2% Fibo of its August decline, near 134.80-70, can provide immediate support to the pair. Moreover, a sustained break of 134.70, can make the pair test 134.20, 133.70 (23.6% FIbo) and the 133.00 round figure mark prior to targeting the August lows near 132.20. Alternatively, 136.50, near to 61.8% Fibo, becomes an immediate resistance before the pair can target 137.00 horizontal mark while a sustained break of 137.00 can quickly fuel the pair to 138.00 round figure. Should the pair successfully breaks 138.00, 138.90 – 139.00 horizontal region becomes an important resistance to limit the pair's up-move.

EURAUD


Short-term symmetrical triangle formation, with the support being 1.5760-50 and the 1.6050 as a resistance seems limiting the near-term trading of EURAUD. The pair currently heads towards the support re-test, breaking which it can quickly decline to 1.5580 and the 61.8% Fibo of its August advance, near 1.5430. Should it manages to extend the decline below 1.5430, the pair becomes vulnerable to test sub-1.5200 area, targeting the 76.4% Fibo, near 1.5160. Given the pair reverses from the mentioned support, 38.2% Fibo, near 1.5880 is likely intermediate barrier prior to the pair's run towards 1.6050 resistance line while a break of which can trigger the pair's immediate up-move towards 1.6150, 23.6% Fibo, and the 1.6300 round figure mark. On the sustained advance beyond 1.6300, the pair becomes capable of targeting August highs, near 1.6600 area.

EURNZD


On Monday, the EURNZD managed to rally towards 1.7997 but failed to break its well-established rectangle formation resistance, near 1.8000 round figure mark, observed since the pair reversed from 1.8730 spike on August 24. The pair now seems heading towards 38.2% Fibo of its July – August advance, near 1.7700, breaking which 50% Fibo, near 1.7380, and the formation support, near 1.7250, are likely important supports that could limit further declines of the pair. Should it manages to break 1.7250 on a closing basis, it can aim 1.6650 horizontal support, also encompassing 76.4% Fibo, while 61.8% Fibo, near 1.7050, can act as an intermediate support for the pair. Meanwhile, a sustained break of 1.8000 mark can witness 23.6% Fibo, near 1.8100 as an immediate resistance prior to targeting August highs, surrounding 1.8700 area. Should the pair extends the upward trajectory beyond 1.8700, the 61.8% FE of the said move, near 1.9000 psychological magnet can provide strong resistance to the pair.


“Original analysis is provided by Admiral Markets
 
Technical Update - EURUSD, AUDUSD, USDJPY and USDCAD

EURUSD


Barring its volatile movement during the last week of August, the pair continues to trade within a broad trading range as depicted by formation of a rectangle on daily chart. However, the pair has now moved back above 200-day SMA and unless it continues holding above this important MA it is likely to make a fresh attempt to move higher towards testing the upper end of the trading range. Hence, a move above 1.1340-50 immediate horizontal resistance is likely to trigger a follow-up buying interest, lifting the pair back towards 1.1440-50 trading range resistance. Meanwhile, a sustained weakness below 1.1280 level, leading to a subsequent drop back below 200-day SMA, currently near 1.1235 level, seems to drag the pair back towards 1.1120-1.1100 important horizontal support. Further, failure to hold 1.1100 support area now seems to open room for a retest of the lower end of the trading range support near 1.0820-1.0800 area. Intermediate support is pegged near 1.0880 level.

AUDUSD


The pair's recovery from its lowest level since April 2009, also coinciding with the lower trend-line support of a well-established trend-channel on daily chart, failed to lift the pair towards an important resistance confluence near 0.7200 mark. This 0.7200 level comprises of the upper trend-line resistance of the descending channel and 23.6% Fib. retracement level of the pair's down-leg from May high to Sept. low. Hence, a clear strength above 0.7200 strong resistance, marking a channel break-out, is likely to lift the pair beyond 50-day SMA intermediate resistance, currently near 0.7255-60 area, towards its next major resistance near 0.7390-0.7400 zone, marking 38.2% Fib. retracement level. Alternatively, should the pair continue witnessing selling pressure and sustains its weakness below 0.7100 mark, it is likely to fall back towards a very important support near 0.7020-0.7000 psychological mark. This 0.7000 region now seems to act as near-term strong support for the pair, which if broken has the potential to drag the pair, possibly even below 0.6900 round figure mark support, towards retesting the lower trend-line support of the channel, currently near 0.6820-0.6800 area.

USDJPY


Failure to move back above 200-day SMA and a subsequent break below 120.00 mark now seems to force the pair back towards retesting the very important support near 119.10-119.00 mark. Further, considering that the pair has dropped below 200-day SMA for the first time since Aug. 2014 and a subsequent failed attempt to move back above the very important SMA, the pair seems more likely to break below 119.00 mark important support. Hence, a decisive break below 119.00 mark is likely to trigger extension of the near-term corrective move back towards retesting 116.20-116.00 support marking 38.2% Fib. retracement level of Feb. 2014 to June 2015 big up-move. Meanwhile on the upside, 200-day SMA, currently near 120.80-121.00 region seems to continue acting as immediate strong resistance. Only a sustained strength back above 200-day SMA resistance region might negate the near-term expectations of a corrective move and lift the pair immediately towards 121.90-122.00 horizontal resistance zone.

USDCAD


Although the pair continues to hold the lower trend-line support of a well-established ascending trend-channel formation on daily chart, it has failed to clear a short-term descending trend-line resistance near 1.3300 mark. Moreover, the near-term trading range continues to narrow clearly indicating that the pair is ready to make a big move on either side once it breaks out of the trading range. Hence, a decisive weakness below the lower trend-line support of the channel, currently near 1.3240-30 area, could immediately drag the pair towards 200-day SMA support, currently near 1.3170-65 area. Further, a break below the ascending channel would confirm continuation of the near-term corrective move for the pair towards 1.3060-50 support area, representing 23.6% Fib. retracement level of June-August up-leg. Alternatively, should the pair continue to hold the trend-channel support and manages to conquer 1.3300 mark resistance, it might immediately aim towards retesting its recent highs resistance near 1.3350 level and possibly dart towards testing the upper trend-line resistance of the channel, currently near 1.3540-1.3550 area.


“Original analysis is provided by Admiral Markets
 
Technical Update - Important GBP Pairs

GBPUSD


On 4-hourly chart, the pair continues oscillating within a broad trading range as depicted by formation of a Rectangle and rebounded from the lower end of the trading range to move back above 1.5400 mark. From current levels the upper end of the trading range resistance near 1.5450-60 area seems to continue restricting any further up-move. However, a sustained momentum above this strong resistance, lifting the pair beyond 1.5500 mark, now seems to open room for continuing the near-term upward trajectory towards its next major resistance near 1.5650-70 horizontal zone. Alternatively, failure to break-out from the trading range and a subsequent weakness back below 1.5400 round figure mark immediate support is more likely to drag the pair back towards retesting the lower end of the trading range support near 1.5330-10 region. Further, decisive break below the lower end of the trading range has the potential to trigger extension of the near-term downward trajectory back towards its next major support near 1.5180-60 area.


GBPJPY


The pair rebounded from the lower trend-line support of a well-established trend-channel formation held since Oct. 2014. From current levels, move above 186.00 round figure mark intermediate resistance is likely to be followed by a further up-move towards its immediate strong resistance near 187.00-187.20 zone. A decisive strength above 187.00 mark seems to support extension of the near-term bounce back towards its next major resistance near 189.50 region, which could further get extended towards 191.50-60 resistance zone. On the downside, 184.20-184.00 area seems to have emerged as immediate support for the pair. Failure to hold this immediate support now seems to force the pair back towards retesting the lower trend-line support of the channel, currently near 180.50 area.

GBPAUD


The pair once again managed to bounce off its previous strong resistance now turned immediate support near 2.1400 mark, also coinciding with 50-day SMA. From current levels, a move above 23.6% Fib. retracement level resistance near 2.1580-2.1600 area is likely to accelerate the momentum back towards 2.1800 mark resistance. However, any up-move beyond 2.1800 mark now seems to be capped at a descending trend-line resistance near 2.1900 mark. This descending trend-line resistance when considered in conjunction with 2.1400 horizontal support now seems to constitute towards formation of a bearish Descending triangle. Hence, reversal from resistance and a subsequent close below 2.1460-50 support now seems to drag the pair below 2.1400 immediate important support confluence towards testing 38.2% Fib. retracement level support near 2.1100-2.1080 area. Considering that the drop below 50-day SMA would be backed by a bearish chart-pattern, the fall could further get extended towards its next major support near 2.0900 region.

GBPNZD


Although the pair seems to follow an ascending trend-line support extending from June but when taken in consideration along with another ascending trend-line resistance, seems to constitute towards formation of a bearish Rising Wedge chart-pattern. The bearish formation is however, not complete until the pair decisively breaks below the ascending trend-line support, currently near 2.3900 region. The same is likely to be reaffirmed if the pair immediately drops below 2.3795-2.3780 support confluence, comprising of 23.6% Fib. retracement level of April to August up-swing and 50-day SMA. Hence, on a decisive break below these support levels the pair is more likely to continue drifting lower initially towards 2.3370-50 intermediate support and eventually towards 38.2% Fib. retracement level support near 2.2900 level. Meanwhile, on the upside 2.4500 mark remains immediate resistance to conquer. However, major upside resistance is pegged at the upper ascending trend-line resistance, currently near 2.4650 area, and only a decisive strength above this strong resistance might negate the expectations of near-term bearish move for the pair.


“Original analysis is provided by Admiral Markets
 
Technical Outlook: EURCAD, GBPCAD, CADJPY and CADCHF

EURCAD


Following its failure to sustain 1.5550-60 break, the EURCAD plunged to 38.2% Fibonacci Retracement of its April – August advance; though, a bounce from the same seems currently being restricted by the 1.5060-80 horizontal resistance, signaling the pair's continued pullback towards the mentioned Fibo, near 1.4585-80 area that also encompasses five month old ascending trend-line support. However, a break of 1.4580 is likely to be followed by the 50-day SMA, near 1.4550, and a year old horizontal resistance-turned-support, near 1.4500 – 1.4490 area. Given the pair's ability to break 1.4490 on a closing basis, it becomes vulnerable to plunge towards 1.4100 area with 50% Fibo, at 1.4280, being intermediate rest. On the upside, 1.4950, representing 23.6% Fibo, followed by the 1.5060-80 horizontal region, could limit near-term advance by the pair while a sustained break of 1.5080 can fuel the pair's upward trajectory towards 1.5400 area prior to targeting the August highs near 1.5550-60 resistance-zone.

GBPCAD


Ever since the GBPCAD broke above its 50-day SMA, during later May, it managed to extend the upward trajectory towards the highest level in nearly eight years; however, a pullback from the same 2.0967 high made the pair re-test the mentioned MA, which seems currently providing immediate support, together with 23.6% Fibo of its April – August rally, near 2.0300 mark. Expecting another bounce from the 2.0300 level, the pair is expected to initially test 2.0520 and the 2.0600 resistances prior to targeting the August highs. Moreover, a sustained break of which could make the pair run towards 100% FE of its November 2013 to February 2015 up-move, near 2.1100 – 2.1120 area. On the downside close below 2.0300 mark is likely extending the current pullbacks to 61.8% FE, near 1.9980, followed by the 38.2% Fibo, near 1.9900 round figure mark. Should it manage to close below 1.9900, the 100-day SMA, near 1.9700 and the 50% Fibo, near 1.9550-40, are likely consecutive supports during the pair's decline, breaking which the pair becomes vulnerable to plunge towards 61.8% Fibo, near 1.9200 mark.

CADJPY


Bouncing from its August lows, near 87.30, the CADJPY seems trading in a well-established symmetrical triangle formation, with 92.00 being resistance at present and 89.50 acting as a strong support. Though, failure to break the 92.00, coupled with JPY strength, favors the pair's downside towards 88.70 and eventually to the August lows of 87.30. Should the pair continue extending declines below 87.30, 61.8% FE of its July – August decline, near 86.00 round figure mark, can provide strong support to limit further southward trading by the pair. However, pair's ability to break 92.00 can quickly make it capable to rally towards 38.2% Fibo, near 92.60 and then to the 94.00 horizontal mark that acts as a strong support-turned-resistance. Moreover, the pair's ability to break 94.00 on a closing basis, also surpassing 50% Fibo, near 94.25, can fuel it to 96.00 mark, as indicated by the 61.8% Fibo.

CADCHF


Even if the CADCHF managed to bounce from its August lows, near 0.6970, the four month old descending trend-line, coupled with 100-day SMA, could continue restricting the pair's near-term advance near 0.7480; though, 50% Fibo of its January – February advance, near 0.7425, can act as immediate resistance. Meanwhile, 61.8% Fibo, near 0.7300 round figure mark is likely immediate support for the pair prior to its plunge to 0.7200 mark. Should the pair stretches the decline below 0.7200, the 76.4% Fibo, near 0.7150, is likely intermediate support before the pair can aim to break 0.7000 mark and re-test August lows. Alternatively, a break above 0.7480, can quickly fuel the pair towards 0.7585 – 0.7600 multiple resistance area, breaking which 0.7750 and the 0.7850 are likely consecutive resistances that the pair could witness during its upward trajectory.


“Original analysis is provided by Admiral Markets
 
Back
Top