Technical Analysis by Admiral Markets

Technical Update - EURJPY, NZDCHF and CADCHF
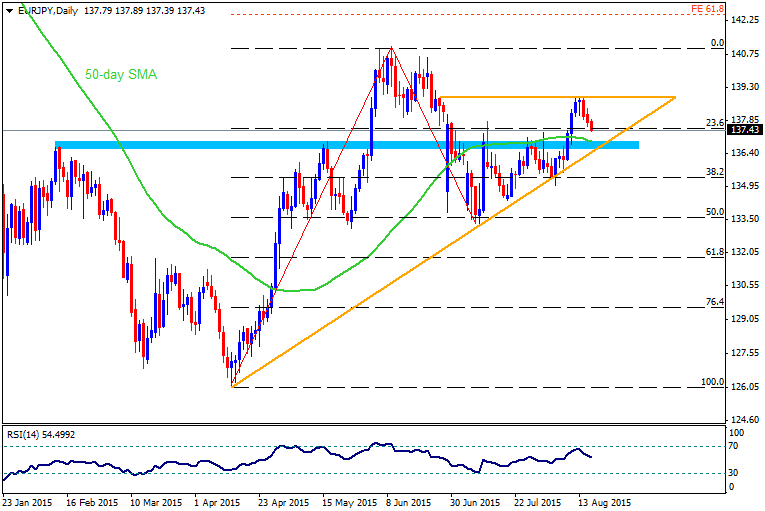
EURJPY

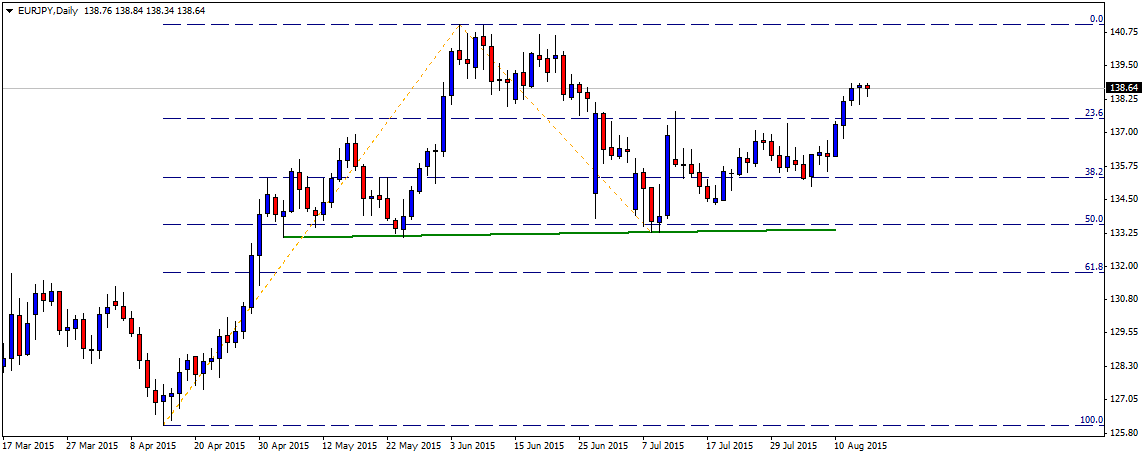
The pair's rebound from 133.30-50 support area representing 50% Fib. retracement level of April to June up-swing, extended beyond 137.50 strong resistance, also coinciding with 23.6% Fib. retracement level. From current levels, the pair seems more likely to move back and sustain its strength above 139.00 round figure mark and extend the near-term upward trajectory towards 2015 daily closing high resistance near 140.50-60 area. Further, a break through 2015 closing high resistance has the potential to provide the required momentum to continue boosting the pair in the near-term towards 61.8% Fib. expansion level resistance near 142.50 level. Meanwhile on the downside, previous resistance near 137.50 level now seems to protect immediate downside. Failure to hold this immediate support could drag the pair back towards testing 38.2% Fib. retracement level support near 135.20-135.00 area.
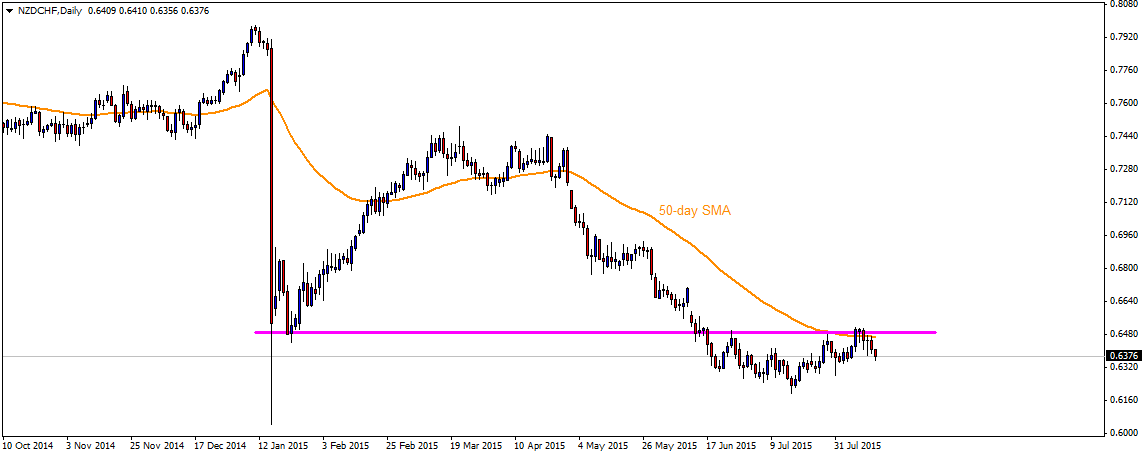
NZDCHF

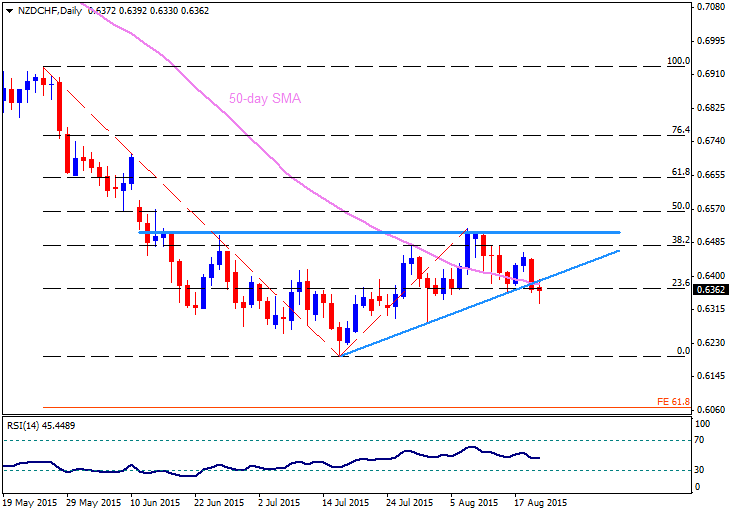
The pair once again failed to clear its previous support now turned immediate hurdle near 0.6490-0.6500 mark, also coinciding with 50-day SMA. Subsequently the pair dropped to retest 0.6350 intermediate support and is currently making an attempt to move back above 0.6400 mark. Should the pair fail to move back above 0.6400 mark and decisively weaken below 0.6350 support, it seems to move back towards retesting recent lows support near 0.6220-0.6210 area and possibly even drift lower towards Jan. 15 lows support near 0.6050-40 zone. Alternatively strength above 0.6400 mark is likely to confront immediate resistance near 0.6450 level, which is closely followed by a strong resistance near 0.6490-0.6500 area, nearing 50-day SMA. A decisive move above 0.6500 mark strong resistance now seems to continue extending support for further up-move for the pair towards its next major resistance near 0.6700 region.

CADCHF

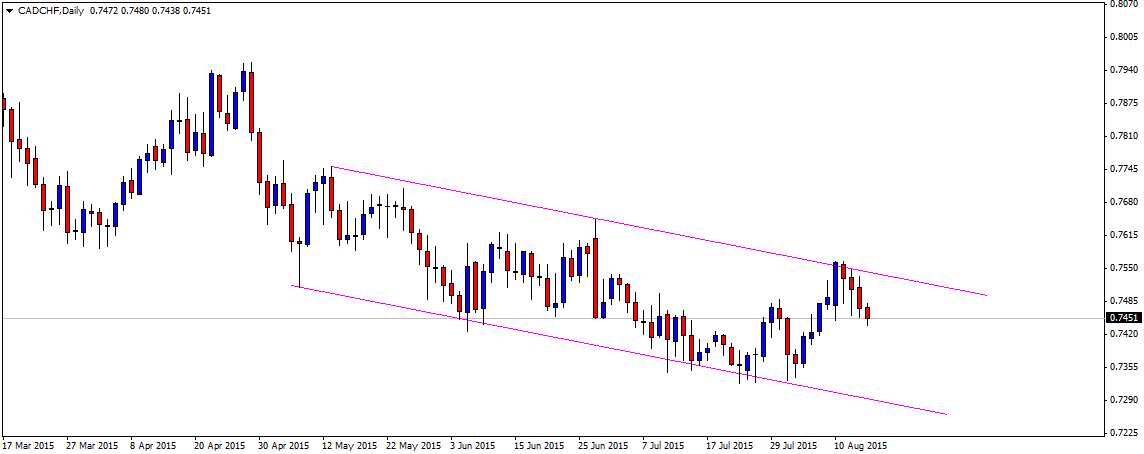
On daily chart, the pair seems to have moved within a short-term descending trend-channel and is drifting lower after testing the upper trend-line resistance of the channel. From current levels, the pair seems to continue drifting lower to test 0.7420-10 intermediate horizontal support, which if broken might force the pair back towards testing the lower trend-line support of the channel, currently near 0.7300-0.7290 area. However, should the pair manage to hold 0.7400 mark and subsequently strengthen above 0.7470 level, it might continue facing strong resistance at the upper trend-line resistance of the channel, currently near 0.7530 area. A decisive strength above 0.7530 resistance, marking a break-through the descending channel, is likely to trigger a short-covering rally immediately towards 0.7600 round figure mark resistance, which could further get extended towards its next major resistance near 0.7650-60 zone.


“Original analysis is provided by Admiral Markets
 
Technical Outlook - EURGBP, EURJPY, EURAUD and EURNZD

EURGBP

Having bounced from 0.6950-30 support region during last week, the EURGBP managed to rally towards a month's high; however, 100-day SMA and the resistance line of "falling-wedge" formation restricted further advance by the pair that presently trades near 0.7040-35 support-zone. From the current level, 0.6990 and the 0.6950-30 are likely immediate support to restrict the pair's decline, breaking which 0.6870-65 could limit the pair's additional downside towards 0.6830, 61.8% FE of its May – August decline. Meanwhile, 0.7115-20, quickly followed by the formation resistance, 38.2% Fibo and the 100-day SMA, near 0.7145-65 area, become strong barrier to cap the pair's near-term upside. Moreover, a daily close above 0.7165 confirms the bullish formation, fueling the pair towards 0.7390 – 0.7400 area with 0.7270-80 being intermediate resistance.

EURJPY

Failure to break the 138.85 – 139.00 horizontal mark seems dragging down the EURJPY towards re-test of 136.90-60 broad support-region, including 50-day SMA and the four month old ascending trend-line support. If the pair plunges below 136.60 on a closing basis, it can quickly plunge to 133.50-30 support area, including 50% Fibo of the April – June up-move, breaking which the 131.50-40 could become consecutive rest point for the pair. Alternatively, a sustained break of 139.00 is likely to be followed by the 140.00 – 140.10 resistance region, breaking which the pair can stand near 141.00 round figure mark prior to extending its upward trajectory towards 61.8% FE of the pair move, near 142.50-55 area. On an extended advance beyond 142.55, the pair can rally towards 144.60-70 resistance region that restricts the pair's medium-term up-move.

EURAUD

Even if the 1.5305-25 horizontal restricted the pair's surge during last week, the four month old ascending trend-channel keep favoring the pair's near-term up-move. Currently, 1.4900, followed by the 1.4770-50 support-zone, including 50-day SMA, channel support and the 50% Fibo of its January 2014 to April 2015 decline, could provide strong support to limit the pair's immediate declines. Should the pair closes below 1.4750, it becomes vulnerable to plunge towards 1.4550 and the 1.4400 support levels. On the upside, a break of 1.5325 favors the pair's upward trajectory towards 1.5485 – 1.5500 resistance-zone while an extension beyond 1.5500, also breaking the 1.5530-35, may provide the pair a strong support to target 1.5800 area.

EURNZD

Two month old ascending trend-channel favors the EURNZD up-move that is currently witnessing a pullback towards 1.6700 mark, breaking which mentioned channel support, near 1.6600 round figure, provides a strong support to restrict further declines by the pair. Given the pair's inability to stand near 1.6600, it can plunge to 23.6% Fibo of its April – August up-move, near 1.6330, prior to targeting 1.6150 and the 1.5850 levels. Should the pair reverses from the 1.6700 area, the 1.6935 is likely intermediate resistance before the pair could test the recent highs near 1.7100 round figure mark, that also includes the channel resistance. Further advances by the pair, above 1.7100 are likely to be capped by the 1.7270 horizontal mark, including the August 2013 highs.


“Original analysis is provided by Admiral Markets
 
Technical Overview - EURUSD, GBPUSD, AUDUSD and USDCHF

EURUSD

On 4-hourly chart, the pair seems to have moved within a short-term descending trend-channel with lower trend-line support near 1.1040 level. However, when considered along with the pair's up-move from 1.0850 level, the descending channel seems to constitute towards formation of a bullish Flag chart-pattern. Moreover, on daily chart, the pair has already broken through another short-term descending trend-channel resistance near 1.1040-50 level. The combination of a descending channel break-out on daily chart and a subsequent formation of a bullish flag chart-pattern suggests further upside in the near-term. From current level, a move above 1.1100 round figure mark is likely to confront resistance at the upper trend-line resistance of the 4-hourly descending channel, currently near 1.1140 area. A decisive move above the trend-channel resistance now seems to confirm extension of the near-term recovery move towards testing its next major resistance near 1.1400 mark, representing a descending trend-line resistance extending from Feb. 2015 highs through highs tested in May and June. On the downside, weakness below 1.1040 support area might negate the bullish Flag chart-pattern and drag the pair back below 1.1000 psychological mark support. The drop below 1.1000 mark could further get extended towards retesting the very important support near 1.08000 level with intermediate horizontal support near 1.0930-20 zone.

GBPUSD

Tuesday's data on UK inflation helped the pair to conquer a strong resistance near 1.5670-80 area. A subsequent strength above 1.5700-20 zone seems to further validate the break-out, thus opening room for continuing the upward trajectory, initially towards 1.5780-1.5800 round figure mark intermediate resistance and eventually towards 1.5880-1.5900 area, marking 50% Fib. retracement level resistance of the pair's downfall from July 2014 highs to a multi-year low tested in April 2015. Meanwhile, a drop back below 1.5650-40 immediate horizontal support, possibly negating the break-out, seems to drag the pair back below 38.2% Fib. retracement level support near 1.5560-50 area towards testing 1.5500 mark, representing the lower trend-line support of a short-term ascending trend-channel formation on daily chart. A follow-up weakness below 1.5500 level, marking a break-down from the ascending trend-channel, is likely to trigger an accelerated fall towards the very important 200-day SMA support, currently near 1.5400-1.5380 region.​

AUDUSD

The pair continues to face difficulty in clearing an important resistance near 0.7400-20 area, marking the upper trend-line resistance of a descending trend-channel formation on daily chart, held since May 2015. Reversal from an important resistance and a subsequent weakness below 0.7300 mark is likely trigger resumption of the pair's prior weakening trend, possibly even below its recent lows support near 0.7220 level and 0.7100 round figure mark support, towards testing the lower trend-line support of the channel, currently near 0.7050-40 zone. However, a decisive strength above 0.7400-20 strong resistance, marking a break-out of the descending channel, is likely to trigger an immediate short-covering rally towards 50-day SMA resistance near 0.7500 mark, which could further get extended towards its next major resistance near 0.7590-0.7600 zone.

USDCHF


Although the pair has given up around 150 pips from nearly 5-month high of 0.9901 touched in the week gone-by, the up-trend seems to remain intact as depicted by formation of an ascending trend-channel on 4-hourly chart. The pair, however, is currently trading near 0.9750 support area, marking the lower trend-line support of the channel. Hence, a sustained break below 0.9750 support is likely to accelerate the fall immediately towards 0.9700 mark horizontal support. Moreover, a decisive break and close below 0.9750 support would mark end of the established up-trend and thus open room for extension of the near-term weakening trend towards testing its next major support near 0.9560-50 zone. Alternatively, a bounce from current support area and a subsequent strength above 0.9800 round figure mark resistance seems to confirm the near-term up-trend and thus, setting the stage for the next leg of up-move for the pair, initially towards retesting 0.9900 round figure mark resistance and eventually towards reclaiming the parity mark (1.0000), also representing the upper trend-line resistance of the channel.


“Original analysis is provided by Admiral Markets
 
Technical Outlook - NZDUSD, USDCAD and USDJPY

NZDUSD


Short-term descending trend-channel keep favoring the NZDUSD decline that is currently testing the immediate ascending trend-line support, near 0.6560, breaking which 0.6510 – 0.6500 horizontal mark is likely intermediate support prior to the pair's plunge to 61.8% FE of its June-July decline near 0.6415. Moreover, an extended south-move below 0.6410, also surpassing 0.6400 mark, seems to be restricted by the channel support, at 0.6300 round figure mark. On the upside, a break of 0.6615-20 channel resistance, could trigger the pair's immediate rally towards 0.6740-50 resistance area, breaking which the pair can extend its upward trajectory to 0.6810 and 0.6880 levels. Given the pair's ability to surpass 0.6880, it can stretch its upward trajectory towards 0.7000 psychological magnet.

USDCAD


Ever since the pair broke above its 1.2810-30 horizontal mark, including January and March highs together with the 50-day EMA, short-term ascending trend-channel kept supporting the USDCAD up-move. However, the pair failed to break the 1.3200 mark and formed a descending trend-line, connecting recent highs, that forced it to test the channel support, currently near 1.3000 psychological mark. Should it break the said channel support, it can quickly witness a pullback towards 1.2810-30 re-test, breaking which the pair becomes vulnerable to plunge towards 1.2560-50 support area. Alternatively, a reversal from the current level can find the trend-line resistance, near 1.3140, as immediate cap to its up-move while a break of which could fuel the pair to 1.3200 – 1.3210 resistance-zone prior to targeting the channel resistance, near 1.3300 mark. Given the pair's ability to keep its rally intact above 1.3300, it could be well in the position to test 100% FE of its November 2014 to March 2015 up-move, near 1.3570.

USDJPY


Even if the USDJPY failed to break the 125.00 – 125.10 horizontal mark on a closing basis, immediate ascending trend-channel favors the pair's near-term up-move; however, the pair currently trades near the channel support, 123.80, breaking which it can quickly test 123.50, 23.6% Fibo of its January – June up-move before targeting 122.50 and the 122.00 – 121.80 important horizontal support. If it sustains the break of 121.80, the pair becomes vulnerable to plunge towards 120.00 mark with 120.80 being intermediate support. Meanwhile, the 124.60, quickly followed by the 125.00 – 125.10 horizontal mark, are likely immediate resistances for the pair prior to its move to June highs of 125.85 that also encompasses the upper line of channel. On a further up-move beyond 125.85 can witness 61.8% FE of the said move, near 126.60 as consecutive resistance.


“Original analysis is provided by Admiral Markets
 
Technical Update - GBPNZD, GBPJPY and GBPCAD

GBPNZD


Although the pair seems to face stiff resistance near 2.4000 psychological mark (forming multiple-tops), but has been able to hold a short-term ascending trend-line support extending from July. The combinations seems to constitute towards formation of bullish Ascending Triangle, indicating a possible resumption of the prior up-trend once 2.4000 resistance is conquered. From current levels, a move above 2.3900 round figure mark resistance is likely to lift the pair back towards testing 2.4000 strong resistance. A decisive strengthen above 2.4000 level now seems to open room for an immediate up-move towards its next major resistance near 2.4350-70 area. Alternatively, weakness back below 2.3700 mark is likely to be followed by the ascending trend-line support, currently near 2.3650-40 zone. Sustained weakness below the ascending trend-line resistance has the potential to immediately drag the pair back towards 2.3510-2.3500 horizontal support. The weakness could further get extended towards the next major support near 2.3200 mark with intermediate support near 2.3400-2.3380 zone.

GBPJPY


On 4-hourly chart, the pair seems to have moved within a short-term rectangular formation confined within a broader equidistant channel with slight positive inclination. The upper end of the rectangular formation coincides with 195.00 mark resistance, also nearing the upper trend-line resistance of the channel. Only a sustained strength above 195.00 mark, leading to a subsequent move above 195.50 level, would confirm a break-out, thus opening room for continuing the near-term upward trajectory towards 197.30-50 area. Meanwhile, drop below 194.50 level is likely to be followed by additional weakness towards 193.80 intermediate support and eventually towards the lower end of the rectangle support near 193.40 level. Follow-up weakness below 193.40 horizontal support now seems to increase the pair's vulnerability towards testing the lower trend-line support of the channel, currently near 192.00 mark.

GBPCAD

The pair maintains its near-term up-trend, as depicted by an ascending trend-channel formation held since the beginning of May 2015. The pair, however, is facing some resistance in moving above 2.0580-2.0600 area. A clear break-through this immediate resistance is likely to extend the pair's near-term up-ward trajectory towards testing the upper trend-line resistance of the channel, currently near 2.0900 mark. Meanwhile, a break below 2.4000 round figure mark might force the pair to test the lower trend-line support of the ascending channel, currently near 2.0300-2.0280 area. A decisive break below 2.2300 support, marking a break-down below the ascending channel, seems to accelerate the fall towards 2.0100 mark support with 2.0240-30 acting as intermediate support.


“Original analysis is provided by Admiral Markets
 
Technical Update - GBPAUD, AUDCAD, AUDJPY and AUDNZD

GBPAUD
Within a broader ascending trend-channel formation on daily chart, the pair continues facing strong resistance near 2.1500 mark also nearing the upper trend-line resistance of the channel, currently near 2.1550 region. Reversal from 2.1500 psychological mark resistance and a subsequent weakness below 2.1300 and 2.1200 mark round figure mark support seems to extend the near-term corrective move, initially towards testing sub-2.0900 support area and eventually towards 2.0400 mark horizontal support. Meanwhile, should the pair manage to sustain its move above 2.1500 mark, leading to a strength above the ascending trend-channel upper trend-line resistance near 2.1550, it seems to continue scaling higher levels towards testing next major resistance near 2.1700 mark. The ascending channel break-out momentum might continue support additional near-term upward trajectory towards 2.2000 mark psychological mark resistance.

AUDCAD
The pair continues to oscillate within a broad trading range between 0.9750 resistance on the upside and 0.9400 support on the downside, thus forming a rectangle chart pattern on daily chart. However, the pair now seems to find support at 100-day SMA support, currently near 0.9560-50 area. Failure to hold 100-day SMA support would reinforce range-bound moves, dragging the pair back towards testing the lower end of the trading range support near 0.9400 mark. Alternatively, till the pair continues holding above 100-day SMA and subsequently strengthens back above 0.9650 immediate horizontal resistance, it is likely to make a fresh attempt to retest the upper end of the trading range resistance near 0.9730-50 area. Considering the pair's immediate trading pattern, only a decisive break-out of the trading range would assist in determining its near-term move in either direction.

AUDJPY
The pair has repeatedly failed to register any significant recovery from 2015 lows, as depicted by another failed attempt to conquer 92.30-40 strong resistance area. Rejection from important resistance, which now also coincides with 50-day SMA, and a subsequent drop back below 90.00 psychological mark, now seems to force the pair back towards retesting the very important support near 89.50-30 area. Further, decisive weakness below 89.50-30 support area, held since Feb. 2015 is likely to extend the pair's weakness towards its next major support near 88.00 round figure mark. On the upside, move above 91.00 round figure mark is likely to confront resistance near 91.70 horizontal area. Major resistance, however, remains near 92.30-40 area, which if conquered sets the stage for some meaningful recovery for the pair towards its next major resistance near 94.50-60 region.

AUDNZD
After failing to conquer 1.1400 mark and a subsequent bounce from 38.2% Fib. retracement level support of April to July up-swing now seems to face resistance at a short-term descending trend-line, currently near 1.1300 mark. The pair has now dropped below 1.1100 mark support, representing 23.6% Fib. retracement level. From current levels weakness below 1.1020-1.1000 mark seems to accelerate the downward momentum towards a very important support near 1.0900-1.0880 area, coinciding with 38.2% Fib. retracement level. A decisive break below 1.0900 mark important support would confirm completion of a bearish Double-Top chart pattern, thus opening room for continuing the pair's near-term downward trajectory, possibly even below 100-day SMA support near 1.0820 level, towards a very important support confluence near 1.0700 mark, comprising of 50% Fib. retracement level and 200-day SMA. Meanwhile, a move back above 1.1100 mark support turned resistance might continue to face resistance at the descending trend-line, currently near 1.1250 region. Should the pair manage to conquer this trend-line resistance 1.1400 mark might again come into play as strong resistance. Sustained move above 1.1400 mark would suggest resumption of the pair's strong momentum, opening the room for a further up-move towards its next major resistance near 1.1550-60 area marking highs tested in Oct. 2013.


“Original analysis is provided by Admiral Markets
 
Technical Outlook - AUDCHF, NZDCHF, CHFJPY and GBPCHF

AUDCHF


Failure to counter 0.7280 – 0.7300 resistance-zone seems pulling back the AUDCHF towards 0.6950-40 support area and eventually to the 0.6850-40 region, encompassing January lows and the six month old descending channel support; however, the declines following 0.6840 are less likely. Should the comparative CHF strength triggers the 0.6840 break, the pair becomes vulnerable to plunge towards 61.8% FE of its September 2014 – January 2015 decline, below 0.6600 area. Alternatively, a bounce from the current levels can witness 0.7150 immediate resistance, breaking which 100-day SMA and the channel resistance, near 0.7250-65, quickly followed by the 0.7280 – 0.7300 mentioned resistance region, could restrict the pair's near-term up-move. Moreover, a sustained break of 0.7300 could initially trigger the pair's up-move towards 0.7470-80 area prior to targeting the 38.2% Fibo of, near 0.7570 that opens the door for the pair run above March high surpassing 0.7700 round figure mark.

NZDCHF


Having breached a month old ascending trend-line support, also including the 50-day SMA, on a closing basis, the NZDCHF becomes a strong contestant to extend its southward journey towards 0.6300 – 0.6280 support-region, while a break of which could compress the pair towards July lows near 0.6200 round figure mark. Moreover, extended declines below 0.6200 level could fuel the pair's plunge to 61.8% FE of May – July decline, near 0.6065. On the upside, a close above 0.6400 level, mentioned the support-turned-resistance line and the 50-day SMA, negates the pair's recent break and can immediately target 0.6470-80 mark prior to witnessing 0.6500 – 0.6510 horizontal resistance region, including highs marked in June and August. Should the pair successfully conquers the 0.6510, it is likely taking a halt at 0.6565, 50% Fibo. prior to its run above 61.8% Fibo, 0.6650 resistance.

CHFJPY


200-day SMA and the short-term descending trend-line support successfully stopped the CHFJPY declines during early August, fueling the pair towards 129.50-60 immediate resistance area while a break of 129.60 may support its upward trajectory to initially target 130.70 prior to testing 131.40-50 horizontal resistance-zone. Moreover, pair's further advance beyond 131.50 can witness 132.50 and 133.30 consecutive resistances before it could gather courage to counter the 134.50-60 double top region. Meanwhile, a break of 127.70 nearby support can call for the pair's decline to 126.80, quickly followed by the 200-day SMA, near 126.50, and the mentioned support-line, near 125.50 levels. On an extended southward trajectory below 125.50, that also includes the 61.8% Fibo of its March – June rally, the pair becomes vulnerable to target 123.50-40 support region, which also includes 76.4% Fibonacci Retracement level.

GBPCHF


Inability to surpass the short-term ascending trend-channel resistance, near 1.5400 area, pulled back the GBPCHF towards testing 1.5030 mark; however, the pair is less likely to extend its decline below the 1.5030 level as 23.6% Fibonacci Retracement, also including the channel support, could restrict further downside, signaling the bounce towards 1.5200 mark. With the stretched up-move beyond 1.5200, the pair is more likely to test 1.5300 – 1.5310 area prior to targeting its recent highs of 1.5408. However, further advances beyond 1.5410 round figure is likely to be capped by the channel resistance, presently near 1.5500 psychological mark. Should the pair breaks 1.5030 mark, it can quickly test the 38.2% Fibo level, near 1.4800 support level, breaking which 100-day SMA, nearly 1.4630, quickly followed by the 50% Fibo, near 1.4600 psychological level, could restrict the pair's additional declines.


“Original analysis is provided by Admiral Markets
 
Technical Outlook - US Dollar Index, Gold and Silver

US Dollar Index [I.USDX]


Having breached the 50-day & 100-day confluence, the US Dollar Index plunged to the lowest levels since June end; however, the 95.10 – 95.00 area, encompassing the horizontal support and the seven month old ascending trend-line, could restrict further declines of the index, failing to which, the index could target another horizontal support area, between 93.30-20. Moreover, an extended decline below 93.20 can make the greenback index vulnerable to fill the January gap of 90.50 mark. On the upside, the said confluence of SMAs, between 96.35-50 area, provides immediate resistance to the index, breaking which 97.00 round figure mark and the 98.30 are likely consecutive upside levels that the index watchers should take care of. Should it strengthens above 98.30, the index can initially rally towards 99.00 level prior to targeting the 100.00 – 100.15 horizontal mark.

GOLD


Reversal from $1080-70 support region, encompassing the descending trend-channel support on weekly chart, coupled with July lows, fueled the Gold prices to break $1147-48 horizontal mark and test the $1165-68 resistance area, including 100-day SMA, seven month old descending trend-line and the 38.2% Fibonacci Retracement of its January – July decline. Even if the yellow metal show resilience to break the mentioned resistance region, signaling a pull back towards $1147-48 and $1100 round figure mark support, a break of $1100 is likely to sustain below $1070 mark. Should it manage to break $1070, it becomes vulnerable to plunge towards $1000 psychological magnet prior to targeting $980-70 region. On the upside, a close above $1168, also surpassing the $1170, can trigger the metal's rally towards $1200 round figure mark, breaking which the May month highs, near $1230, are likely intermediate resistance for it prior to witnessing $1255 and the $1280 resistance marks.

SILVER


Alike Gold, bounce in Silver prices from the July lows fueled the white metal towards more than a month's high; however, $15.700 horizontal mark, quickly followed by the 100-day SMA and the 38.2% Fibonacci Retracement of its January – July decline, near $15.88 - $15.93 region seems restricting the metal's near-term advance. Should it successfully breaks $15.925, the silver prices can quickly rally to 50% Fibo, near $16.50, prior to targeting $17.00 - $17.10 and the $17.75-85 area. Should the prices start reversing from current levels, which is more likely, $15.20 - $15.00 becomes immediate support before it could test the $14.50 and the July lows near $14.30, breaking which the $14.00 and the $13.50 are likely consecutive supports that the silver prices may target on its continued downtrend.


“Original analysis is provided by Admiral Markets
 
Technical Overview - US Equity Indices

Dow Jones [DJI30]


On Thursday, the Dow Jones Index fell sharply to drop below 17,000 mark level for the first time since Oct. 2014. Also on Friday, the index future is indicating a weaker opening, just above 16,800 level, nearing 61.8% Fib. retracement level of Oct. 2014 to May 2015 strong up-move and also coinciding with an ascending trend-line support extending through lows tested in Oct. 2013 and Oct. 2014. With daily RSI below 30 already suggesting slightly oversold conditions, the index could possibly witness some bounce from 16,800 support level, possibly back towards 17,000 mark. Move above 17,000 level now seems to confront strong resistance at a previous strong support near 17,100 level, also marking 50% Fib. retracement level. Until the index continues trading below 17,100 strong resistance area, it seems to remain vulnerable to extend the ongoing weakness, possibly even below 16,800-750 support confluence support, towards its next major support near 16,300 with intermediate support near 16,600 level.

NASDAQ100 [NQ100]


With a relatively out-performer, the index just broke below 200-day SMA support for the first time since Oct. 2014 on Thursday. The index is also nearing its immediate support near 4310-4300 area, marking 38.2% Fib. retracement level of Oct. 2014 to July 2015 up-swing. Following a break below 200-day SMA, subsequent weakness below 4300 mark support now seems to accelerate the index fall towards its next round figure mark support near 4200-4190 area, also coinciding with 50% Fib. retracement level with a minor intermediate horizontal support near 4280-75 area. Meanwhile on the upside, 200-day SMA, currently near 4390-4400 mark, might now act as immediate resistance. Bounce from immediate support, leading to a follow-up strength back above 200-day SMA would pave way for resumption of the upward trajectory, initially towards 23.6% Fib. retracement level resistance near 4455-60 area and eventually towards a very strong resistance near 4550 horizontal region.

S&P500 [SP500]


After forming a bearish multiple-tops chart pattern near 2130-35 area, the index on Thursday broke below an important support near 2040 level to test 38.2% Fib. retracement level of Oct. 2014 to May 2015 strong up-move. However, considering that the index has broken below and important support, thus confirming the bearish tops pattern, it remains vulnerable to continue drifting lower in the near-term. Hence, decisive weakness below 38.2% Fib. retracement level support near 2000 psychological mark has the potential to weaken the index further towards testing 50% Fib. retracement level support near 1975-70 area. Moreover, failure to 50% Fib. level could open room for continuing the near-term downward trajectory towards its next major support near 1900 round figure mark. On the upside, important support break point near 2040 level now seems to provide immediate resistance. Strength above this immediate resistance is closely followed by resistance at 23.6% Fib. retracement level near 2060 level and at 200-day SMA region, currently near 2080 area. Only a decisive strength back above 200-day SMA could possibly negate the expected bearish move in the near-term.


“Original analysis is provided by Admiral Markets
 
Technical Outlook - Important GBP Pairs

GBPUSD


Although, the GBPUSD managed to close above 1.5730 horizontal mark on Monday, upbeat consumer confidence and durable goods orders provided considerable strength to the greenback during Tuesday and Wednesday, pulling back the pair towards breaking the short-term ascending trend-channel support. However, 200-day SMA, presently near 1.5370, can restrict the pair's immediate declines, breaking which 50% Fibo of April-June up-move, near 1.5250, and the 1.5180-70 are likely consecutive supports that the pair can witness during its extended downward trajectory. Should the pair manages to close below 1.5170, it can quickly plunge to 1.4900 area while 1.5100 – 1.5080 and the 1.4980-75 can act as an intermediate rest for the pair. Alternatively, a close above 1.5530 negates the recent break, fueling the pair towards 23.6% Fibo, near 1.5600 round figure mark prior to targeting 1.5730 and the 1.5800 resistances. Moreover, a sustained up-move beyond 1.5800 area could pave the way for pair's surge towards June highs, the 1.5930, breaking which channel resistance and the 61.8% FE of the said move, near 1.6170-75 area, is likely restricting extended rise by the pair.

EURGBP


Monday's swift rally above 0.7380 – 0.7400 horizontal region lost its vigor during the following trading days as the EURGBP failed to close above 200-day SMA and the 38.2% Fibonacci Retracement of its November 2014 – July 2015 decline. Present weakness on the part of the pair seems favoring a decline towards 0.7240-20 support-zone, breaking which 0.7150-40 support area can become an intermediate support before the pair could target the 0.7050-40 region. Moreover, a close below 0.7040 can quickly fetch the pair to 0.6980-75 and to the July lows of 0.6940 while a break of 0.6940 is likely making the pair vulnerable to break the 0.6800 round figure mark, testing 61.8% FE of the said move, near 0.6750-40 area. On the upside, 200-day SMA and the 38.2% Fibo, near 0.7350-60, could continue providing strong resistance to restrict the pair's immediate up-move, breaking which 0.7380 – 0.7400 region and the 50% Fibo, near 0.7480, are likely consecutive resistances on the pair's consecutive surge. Given the pair's ability to counter 0.7480, it becomes more likely to target 0.7600 mark before rallying to 0.7740-50 resistance-zone.

GBPJPY


Ever since the GBPJPY failed to surpass 195.00 mark, it kept running the decline towards 200-day SMA and with 50% Fibo of its April – June up-move, near 185.50-40 area. However, oversold RSI and inability to close below the said region keep favoring the pair's pullback towards 38.2% Fibo, near 187.80, breaking which 189.50-60 region can act as an intermediate resistance for the pair before it could rally to 23.6% Fibo, near 191.00 round figure mark. Moreover, a sustained trading above 191.00 can fuel the pair towards 192.00 and the 192.80 – 193.00 resistance-zone. On the downside, pair's inability to hold the support with a close below 185.40 could quickly fetch it towards 184.00 prior to testing 183.00 – 182.90 support area, including 61.8% Fibo. If the pair continues extending the decline below 182.90, it can plunge to 181.30 and the sub-180 mark, testing 179.80, encompassing 76.4% Fibo.

GBPAUD


Even if the GBPAUD failed to sustain the four-month old ascending trend-channel resistance, the pair is less likely to break the 2.1220 – 2.1200 support area, including the channel support while 2.1450-40, encompassing 23.6% Fibonacci Retracement of its January – August advance, could act as an intermediate support. Should the pair fails to stop the decline near 2.1200, it could plunge to 2.0860-50, 38.2% fibo prior to targeting the 2.0350-40 area that includes the 50% Fibo and the 100-day SMA. On the reverse side, a close above 2.1800 could flip the pair to 2.2000 round figure mark, breaking which the channel resistance, near 2.2130-40 becomes a strong level that could control the pair's advance. Should the pair manages to break 2.2140, recent highs near 2.2400 round figure mark is likely consecutive resistance during the pair's successive advance.


“Original analysis is provided by Admiral Markets
 
Back
Top