Technical Analysis by Admiral Markets

Technical Update CHF Pairs - USDCHF, CHFJPY and AUDCHF
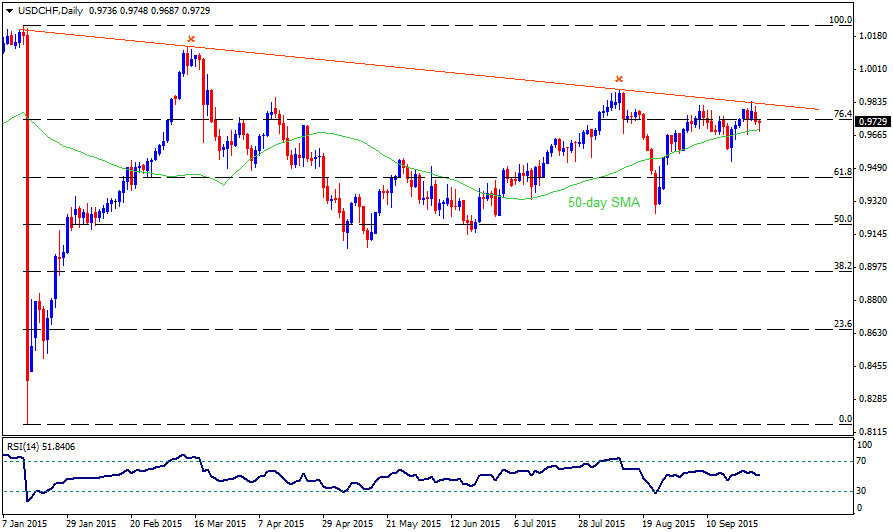
USDCHF


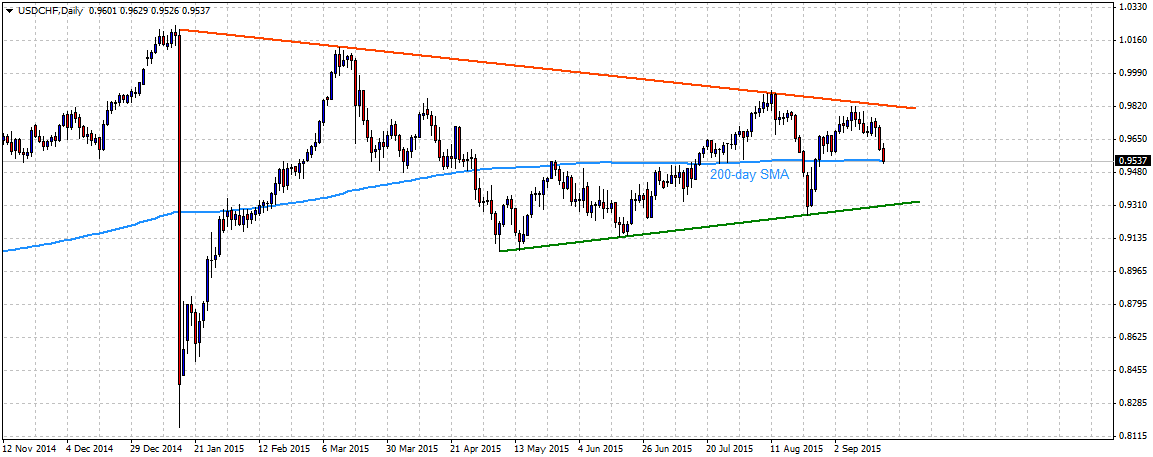
After failing to clear a descending trend-line resistance, the pair on Friday dropped back to retest 200-day SMA support, currently near 0.9540 region. A decisive drop below the 200-day SMA support now seems infuse additional near-term weakness towards retesting a very strong support marked by a short-term ascending trend-line, currently near 0.9300 level. However, should the pair manage to hold and register any recovery from 200-day SMA support, it is likely to confront a strong resistance near 0.9660-80 horizontal zone. Only a decisive move back above this immediate strong resistance might negate any near-term bearish expectations for the pair, thus boosting the pair further towards retesting the upper descending trend-line resistance, currently near 0.9800-0.9820 area. Furthermore, the medium-term direction is unlikely to be clear until the pair continues oscillating within the descending trend-line resistance and ascending trend-line support. Only a decisive break on either side would provide a clear picture of further near-term trajectory for the pair.

CHFJPY
CHFJPYDaily18092015.png


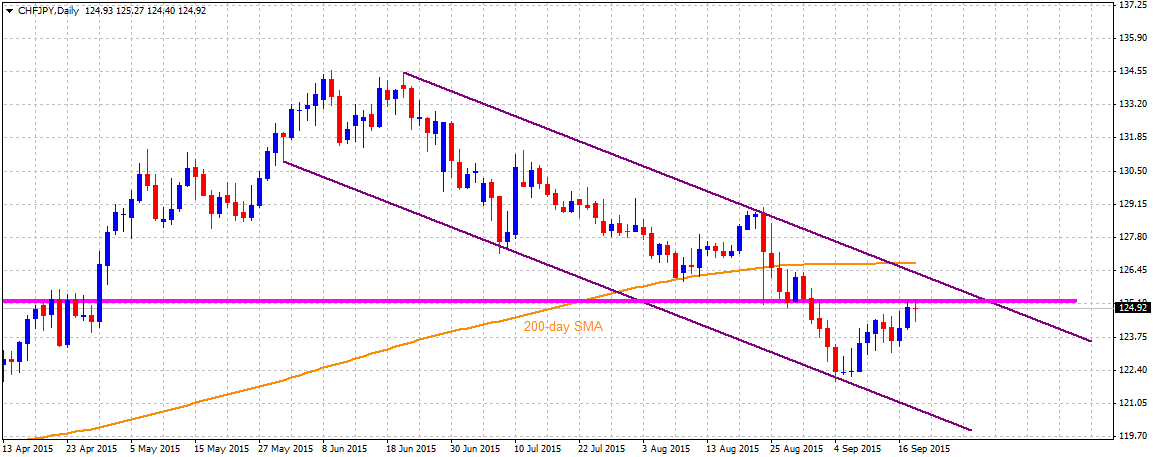
Rebound from the lower trend-line support of a well-established descending trend-channel now seems to confront strong resistance near 125.00-125.00 area. On a sustained strength above this immediate resistance, the pair is likely to register further recovery immediately towards testing the upper trend-line resistance of the channel, currently near 126.00-126.20 region. A move above this strong resistance is immediately followed by 200-day SMA resistance, currently near 126.60-70 area. Only a decisive break above 126.00 resistance, leading to a further strength above 200-day SMA would confirm a break-out above the channel, thus paving way for additional near-term up-move towards its next horizontal resistance near 128.80-129.00 region. Alternatively, reversal from current resistance area and a subsequent drop back below 124.20-124.00 mark immediate horizontal support, is likely to drag the pair back towards recent daily closing lows support near 122.30-20 region. The fall could further get accelerated towards testing the lower trend-line support of the channel near 121.00-120.80 region.
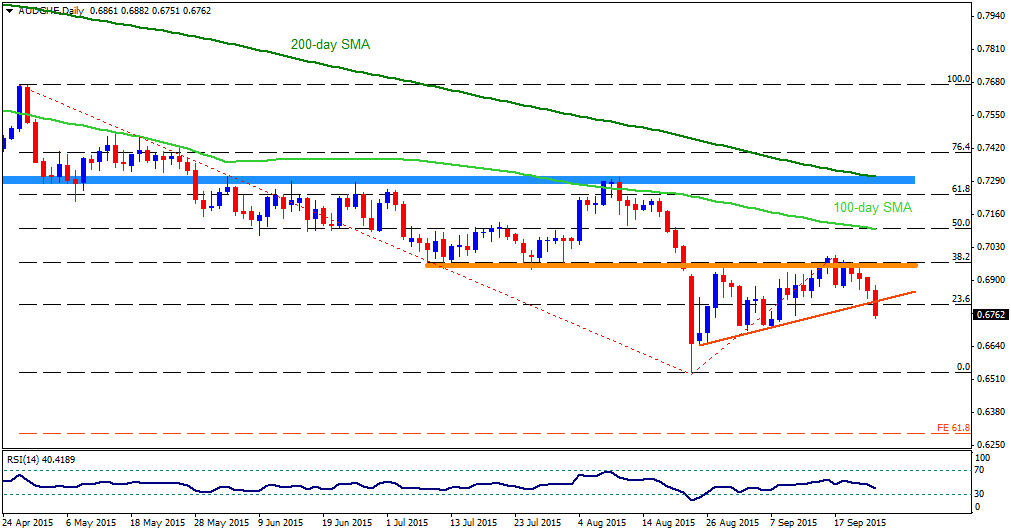
AUDCHF


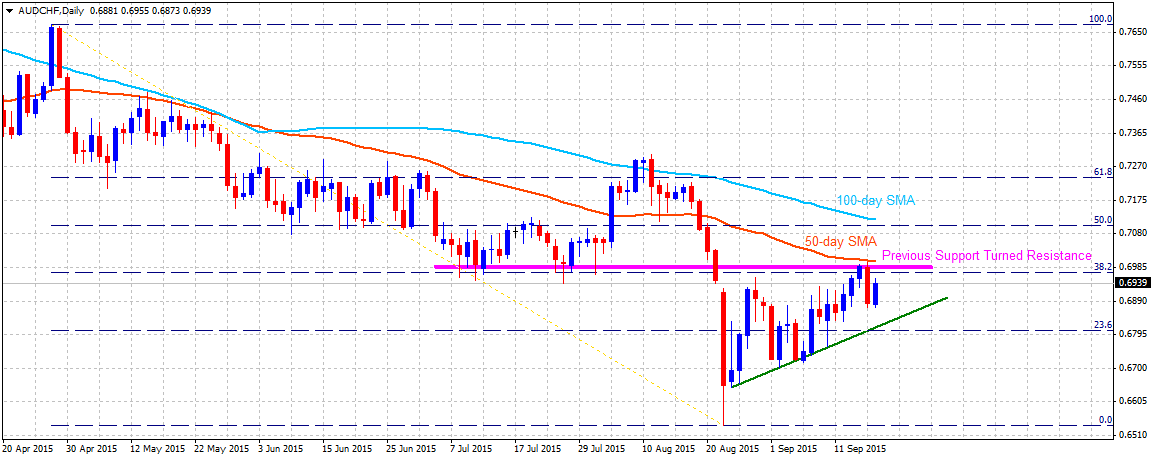
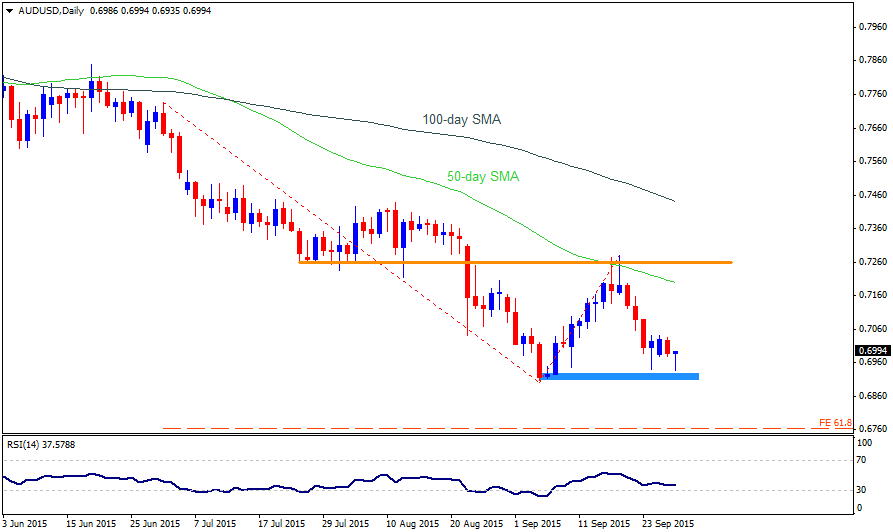
Although the pair is attempting a gradual recovery along a short-term ascending trend-line, it continues to face strong resistance at an important support turned resistance near 0.7000 psychological mark. Should the pair manage to clear this immediate resistance, marking 50-day SMA and also nearing 38.2% Fib. retracement level of April to August down-leg, it seems all set to continue with its recovery trend immediately towards another resistance confluence near 0.7100-0.7120 zone, comprising of 50% Fib. retracement level and 100-day SMA. Meanwhile, reversal from 0.7000 important resistance might find an intermediate minor support near 0.6880-70 zone. But major downside support is marked by the short-term ascending trend-line, currently near 0.6820-0.6800 region, also coinciding with 23.6% Fib. retracement level. Failure to hold this important support is likely to accelerate the fall back towards 0.6720 intermediate support with the downward trajectory expected to continue towards retesting August closing lows support near 0.6650 level.


“Original analysis is provided by Admiral Markets
 
Technical Traits: AUDCAD, AUDJPY and AUDNZD

AUDCAD


Although, short-term ascending trend-channel favors the AUDCAD up-move, more than a month old descending trend-line resistance, presently near 0.9510-15 area, that also encompasses 61.8% Fibo of its August – September decline, could continue restricting the pair's near-term advance. On the downside, 50% Fibo, near 0.9450, followed by the 0.9430 channel support, are likely immediate rests for the pair, breaking which the 0.9410 – 0.9400 horizontal region becomes crucial to determine the pair's further trend. Should the pair breaks the 0.9400 on a closing basis, chances of its plunge to 0.9250, with 0.9330 being intermediate support, can't be denied. Alternatively, a close above 0.9515 can fuel the pair's rally to 0.9580, breaking which 0.9675-80 is likely acting as buffer for its extended up-move towards 0.9745-50 important resistance-zone.

AUDJPY


Following its bounce from August lows, during last week, the AUDJPY seems observing short-term ascending trend-channel; however, 87.15 – 87.30 horizontal resistance, including 50% Fibo of its August decline, could limit the pair's immediate advance. Should the pair manages to break 87.30, the channel resistance, near 88.20, is likely another obstacle that it has to clear in order to test 89.20-25 crucial horizontal-zone, breaking which chances of its rally towards 90.50 and 92.00 can't be ruled out. Meanwhile, a break of channel support, near 85.50, can act as a nearby stop for the pair's decline, surpassing which 84.50, the 23.6% Fibo, and the 83.50 are likely consecutive rests that the pair could witness during its downtrend. Moreover, a sustained trade below 83.50 can make the pair vulnerable to plunge towards testing August lows, re-tested during early September, near 82.00 round figure mark, and ultimately test the 61.8% FE of its said move near 80.70 mark.

AUDNZD


Even after a sustained break of two-month old descending trend-line resistance, the AUDNZD seems finding difficult to break 1.1315-30 horizontal resistance, indicating a pullback to re-test the resistance-turned-support line near 1.1200 round figure mark. Should the pair fails to bounce from the 1.1200 area, and drifts lower, it can quickly plunge to 1.1100 – 1.1090 support prior to testing the 38.2% Fibo of its May – July advance, near 1.1000 psychological magnet. On an extended decline below 1.1000, the 50% Fibo, also encompassing May highs, near 1.0900 mark, becomes an important support to limit the pair's further declines. However, on the upside break of 1.1330, the pair becomes strong enough to target its July highs, near 1.1430 prior to testing the 61.8% FE of the said move, near 1.1550 and the August spike near 1.1700 mark.


“Original analysis is provided by Admiral Markets
 
Technical Update - EURUSD, USDJPY, USDCAD and AUDUSD

EURUSD


The pair once again failed to capitalise on its move above 200-day SMA and dropped back below 1.1200 mark but has held an intermediate support near 1.1150 area, marking a short-term ascending trend-line support. The broader picture reveals that the pair is oscillating within a well-established ascending trend-channel formation on daily chart. Hence, weakness below 1.1150 support could get accelerated but is likely to be limited at the lower trend-line support of the channel, currently near 1.1000 mark. On the upside, move above 200-day SMA region (1.1200-1.1220 zone) now seems to confront immediate resistance near 1.1300 mark. Momentum above 1.1300 mark resistance needs to provide the required momentum to further lift the pair beyond 1.1450 strong horizontal resistance, which if conquered sets the stage for continuation of the upward trajectory, initially towards 1.1620-40 intermediate resistance and eventually towards the upper trend-line resistance of the ascending channel, currently near 1.1800 mark.

USDJPY


The pair continues to oscillate within an ascending trend-line support near 119.20-119.00 zone and a descending trend-line resistance near 120.80-121.00 mark. Following the pair's sharp fall from 125.00 odd level, the combination of descending trend-line resistance and ascending trend-line support seems to constitute towards formation of a continuation pattern, Pennant, on 4-hourly chart, marking current move as consolidation before resumption of the previous depreciating move. Hence, a break below the ascending trend-line support (119.20-119.00 zone) is likely to confirm extension of the near-term corrective move back towards retesting August lows support near 116.20-116.00 area. On the upside, move above 120.60 immediate horizontal resistance might continue to confront strong resistance near 120.80-121.00 mark, also coinciding with 200-day SMA. Should the pair manage to decisively conquer this strong resistance, it might now negate expectations of any further near-term corrective move.

USDCAD


After failing to hold an ascending trend-channel support and a subsequent drop to 1.3000 mark, the pair rebounded sharply to move back towards 1.3250-70 resistance, comprising of the ascending trend-channel break point and a descending trend-line. Should the pair extends the momentum and manages to conquer this immediate resistance, leading to a subsequent strength above 1.3300 round figure mark, it seems all set to continue inching higher, possibly even beyond its recent highs resistance near 1.3350 level, towards testing its next major psychological mark resistance near 1.3500 level. Alternatively, reversal from current resistance confluence and a follow-up weakness below 1.3200 mark seems to drag the pair immediately towards 1.3100 mark intermediate support, which could further get extended towards retesting the very important 1.3000 mark support.

AUDUSD


Recovery momentum from the lowest level since April 2009 helped the pair to break-through a well-established descending trend-channel. The recovery, however, seems to have stalled at 50-day SMA intermediate resistance near 0.7250 region, forcing the pair back below 0.7100 mark, representing the descending trend-channel break-out point. Should the pair continue to witness selling pressure and drop below 0.7070-60 zone, it is likely to extend the weakness back towards a very important psychological mark support near 0.7020-0.7000 mark. However, considering that the pair has already broken through a descending trend-channel, the current pull-back could possibly be utilised by traders to initiate fresh long positions. Hence, rebound from current levels and a clear strength above 0.7160-70 immediate horizontal resistance now seems to provide the required momentum to lift the pair beyond 50-day SMA resistance towards testing its next major resistance near 0.7390-0.7400 zone, marking 38.2% Fib. retracement level of the pair's down-leg from May high to Sept. low.


“Original analysis is provided by Admiral Markets
 
Technical Outlook - Important GBP Pairs

GBPUSD


Following its bounce from the 1.5330-35 horizontal support, the GBPUSD marked new highs for the September month; however, 1.5650-60 resistance area restricted the pair's further advance, making it test the short-term ascending trend-channel support at present. Should the pair manages to break 1.5440 channel support, it can quickly re-test 1.5335-30, breaking which chances of its plunge to 1.5250 and 1.5200 can't be denied. Moreover, sustained decline below 1.5200 can extend the pair's downward trajectory towards 1.5130-25 support area. Alternatively, a close near 1.5475-80 can continue favoring the pair's 1.5555-60 test, surpassing which it could again target 1.5650-60 resistance region. However, the pair's ability to surpass 1.5660 can make its up-move towards 1.5800 area.

EURGBP


After observing the descending triangle formation for nearly a month, the EURGBP broke below its 0.7240-45 support line on Monday; however, 23.6% Fibo of its November 2014 – July 2015 decline, near 0.7195, quickly followed by the 100-day SMA, near 0.7175, seems restricting the pair's immediate downside. Given the pair's ability to break 0.7175 on a closing basis, it becomes liable to test 0.7050-45 support area while sustained trading below which could make it vulnerable to test 2015 lows near 0.6950. On the upside, a break of 0.7245 support-turned-resistance negates the recent triangle confirmation, indicating a pullback to 0.7300 round figure mark and to the descending trend-line resistance, near 0.7335. Should the pair breaks 0.7335 on a closing basis, also surpasses the 0.7355, 38.2% Fibo, it can stretch the up-move towards 0.7400 and the 0.7485-90 consecutive resistance levels.

GBPAUD


Failure to break 2.2115-20 horizontal resistance pulled back the GBPAUD towards the rectangle formation support, near 2.1380; however, the 50-day SMA restricted the pair's additional declines and triggered a bounce towards more than a week's high at 2.1760. Currently, 2.1850 and 2.1950 are likely immediate resistances that the pair could test prior to targeting the formation resistance, near 2.2115-20. Moreover, sustained break of 2.2120 can make the pair capable of challenging the August highs, near 2.2400 round figure mark. Meanwhile, 23.6% Fibo of its May – August advance, near 2.1580 and the 2.1500 can act as nearby supports for the pair, breaking which 50-day SMA, near 2.1445, and the formation support near 2.1380, are likely consecutive rests that the pair could test during its downturn. Should it fails to restrict the declines near 2.1380, chances of its plunge to 38.2% Fibo, near 2.1080 can't be denied.

GBPJPY


Even if the pair managed to break its 185.50 – 185.00 broad resistance-turned-support region, encompassing 200-day SMA, 50% Fibo and February highs, during last week, the 187.90 – 188.00, including the 38.2% Fibo of its April – June advance, restricted its up-move, pulling it back to the mentioned 185.50 – 185.00 zone. Should the pair manages to close below 185.00, it can quickly decline to 183.50-40 and the 61.8% Fibo, near 183.00 round figure mark while its inability to hold the declines near 183.00 can make the pair vulnerable to test 180.50 and the 180.00 round figure mark. Should the pair bounce from the 185.00 mark, also breaks the 185.50, the 187.30 and the 187.90-188.00 are likely consecutive resistance that it can face during its immediate advance. Moreover, an extended up-move beyond 188.00 can make the pair witness 189.50 and the 191.00 round figure, including 23.6% Fibo, during its successive rise.


“Original analysis is provided by Admiral Markets
 
Technical Overview – NZDUSD, GBPNZD, EURNZD and NZDJPY

NZDUSD


Having reversed from 0.6250-40 horizontal support area, the NZDUSD could mark fresh high of the month during last week; however, five month old descending trend-channel resistance stopped its further advance, making the pair re-test the 0.6250-40 support-zone at present. Should the pair manage to close below 0.6240, the 61.8% FE of its August – September downturn, near 0.6160, followed by the 100% FE, near 0.5980, are likely consecutive levels that the pair could witness during its successive decline. However, channel support, currently near 0.5850, may restrict the pair's additional downside after breaking 0.5980. Meanwhile, a bounce from the current levels can find 0.6330 and 0.6380 as immediate resistances prior to testing the upper line of the mentioned channel, near 0.6405. Given the pair's ability to break 0.6405 on a closing basis, 0.6480 – 0.6500 horizontal resistance-region, encompassing the 50-day SMA, becomes a strong cap to limit its near-term surge while a break of which can quickly fuel the pair's rally towards 0.6735-50 resistance area.

GBPNZD


Barring its August spike, GBPNZD seems following well-established "Rising-Wedge" bearish formation where the 2.4615-20, followed by the pattern resistance, near 2.4800 round figure mark, limit the pair's near-term advance. Though, successful break of 2.4800 can quickly pump the pair's surge to 2.5180 – 2.5200 area, encompassing the August highs and 61.8% Fibo of its October 2008 highs to April 2013 lows. Alternatively, 2.4080 and the 2.4000 become immediate supports for the pair, breaking which formation support and the 50-day SMA near 2.3900 area, quickly followed by the 2.3770-50 zone, including 23.6% Fibo of its January – August advance, together with the 50% Fibo of longer-term decline, are likely important level to determine the pair's downside. If the pair closes below 2.3750, chances of its plunge to 2.3370 and the 2.3100 can't be denied.

EURNZD


Following its sharp rally during late-August, the EURNZD kept following the rectangle formation with 1.8000 – 1.8020 acting as resistance and 1.7250-40 being the support. However, 1.7900 can become an immediate resistance for the pair prior to targeting the 1.8000 area, breaking which 23.6% Fibo of its August rally, near 1.8100 round figure mark, and the 1.8500 level are likely intermediate resistances to the pair prior to its run towards August highs, surpassing 1.8700 area. Alternatively, 1.7500 becomes nearby support for the pair before it could test the formation support while a break of which could extend the pair's downward trajectory towards 61.8% Fibo, near 1.7050, and the 1.6810 – 1.6800 support-zone.

NZDJPY


Alike NZDUSD, the NZDJPY also tests its important support region, 74.80 – 74.60, encompassing 23.6% Fibo of its August decline and multiple lows marked during early September. Should the pair bounces from the current level, 75.80 and the 38.2% Fibo, near 76.30, are likely immediate resistances that it could witness prior to testing a month old descending trend-line, currently at 76.70. On an extended advance following 76.70, the pair becomes capable of targeting 77.50 and the 78.70 resistances during its upward trajectory. On the downside break of 74.60, the 73.50 can stop the pair's ultimate decline to August lows, near 72.30 mark. Moreover, a trade below 72.30 is likely to witness 71.00 psychological mark as strong downside support to limit its further declines.


“Original analysis is provided by Admiral Markets
 
Technical Update - USDCHF, GBPCHF, EURCHF and NZDCHF

USDCHF


The pair's near-term direction remains indecisive as it once again managed to bounce back from 200-day SMA important support and has moved back towards a descending trend-line resistance, which it has repeatedly failed to conquer. The pair is again attempting a move towards the ascending trend-line resistance, currently near 0.9800-0.9810 zone. Should the pair now manage to clear this important resistance it seems to immediately aim towards testing August month high level resistance near 0.9890-0.9900 area, also coinciding with 61.8% Fib. expansion level. Meanwhile, reversal from current level now seems to find immediate support near 0.9740 area, which is closely followed by a strong support near 0.9700 mark. Failure to hold 0.9700 mark support seems to drag the pair towards 0.9600 intermediate support and eventually back towards the very important 200-day SMA support, currently near 0.9540 region.

GBPCHF


On 4-hourly chart, the pair has moved within a trading range as depicted by a Rectangular formation. The pair is currently near the lower end of the trading range support near 1.4910-1.4900 area. Should the pair fail to rebound from the trading range support, it is likely to immediately drop to test 1.4800 intermediate support (38.2% Fib. retracement level) before heading towards a very important support confluence near 1.4600 mark, comprising of 200-day SMA and 50% Fib. retracement level of May to August up-swing. Alternatively, a bounce from the trading range support is likely to confront immediate resistance at 23.6% Fib. retracement level near 1.5030 region. This is followed by the upper end of the trading range resistance near 1.5100 mark. A decisive break-through the upper end of the trading range clears the way for continuing the pair's near-term upward trajectory back towards August highs resistance near 1.5400 mark, with minor intermediate resistance near 1.5260-70 horizontal area.

EURCHF


After rising to its highest level since Jan. 15, the pair on 1-hourly chart seems to have moved within a descending trend-channel with 1.0900-1.0920 zone, marking the upper trend-line of the channel, acting as immediate resistance. A decisive strength above this immediate resistance, marking a break-through the descending channel, seems to boost the pair back towards 1.1000 round figure mark resistance. Meanwhile, on the downside, sustained weakness below 1.0880 is likely to find immediate support near 1.0850-40 zone. But major downside support is pegged at the lower trend-line support of the channel, currently near 1.0800 mark. Failure to hold the descending trend-channel support opens room for a retest of sub-1.0700 mark support, nearing the very important 200-day SMA.

NZDCHF


Similar to GBPCHF, the pair too has moved within a narrow trading range but near the multi-year low level tested in August. The lower end of the trading range support is pegged at 0.6060-50 area, which if broken decisively is likely to set the stage for a retest of the recent low level support near 0.5760-50 zone. On the upside, 0.6190-0.6200 area seems to act as immediate resistance and a move above this immediate resistance is likely to lift the pair back towards the top-end of the trading range resistance near 0.6270-80 area. A clear strength above this previous strong support, now turned strong resistance, has the potential to continue supporting the near-term recovery back towards another strong resistance near 0.6500 region.


“Original analysis is provided by Admiral Markets
 
Technical Outlook: AUDNZD, EURAUD and AUDCHF

AUDNZD


Having failed to break 1.1315-30 horizontal mark, the AUDNZD reversed during the early week days while a dip below 1.1170 on Wednesday left the doors open for the pair prices to currently test 100-day SMA, 1.1050-55 area. Should the pair continue extending its downward trajectory and closes below 1.1050, it becomes vulnerable to plunge towards 1.0900 – 1.0880 horizontal support, including 38.2% Fibo of its April – July advance; however, 1.1000 round figure mark can become intermediate support. Meanwhile, pair's bounce from the present level, can find 1.1170 as immediate resistance, breaking which it becomes strong enough to again target 1.1315-30 resistance region. Moreover, sustained break of 1.1330 can accelerate the pair's advance to surpass 1.1400 mark and target the 1.1575-80 crossing which brightens the chances of revisiting August highs around 1.1700 area.

EURAUD


EURAUD's bounce from 1.5600 – 1.5580 horizontal support enabled the pair to tackle a month old descending trend-line resistance, near 1.6100 round figure mark, paving its way for the accelerated rise towards 1.6285 – 1.6300 and ultimately toward the August highs near 1.6600. Should the pair manages to break 1.6600, 61.8% FE of its June – August advance, near 1.7000 area can become next landmark for the pair to test; though, 1.6800 is likely buffer during its up-move. On the downside, a close below 1.6100, also breaking 23.6% Fibo, near 1.6050, negates the recent break and can pullback the pair towards 1.5900 and the 38.2% Fibo, near 1.5720, prior to re-visiting the 1.5600 – 1.5580 support-zone. Moreover, a break of 1.5580 on a closing basis can make the pair vulnerable to plunge towards 1.5250-60 support region.

AUDCHF


Break of short-term ascending trend-line support, also encompassing the 23.6% Fibo of its April – August decline, near 0.6800 round figure mark, favors the brighter chances of the AUDCHF to re-test early September lows, near 0.6700 and the 0.6640-35 supports. Should the pair fails to stop its running decline near 0.6640, chances of its plunge to August lows, near 0.6540, can't be denied. Also, a sustained break of 0.6540 can call for the pair's decline to test 61.8% FE of the said move, near 0.6300 psychological mark. On the upside, a close above 0.6800 negates the break and can pull the pair immediately towards 0.6875-80 prior to targeting 0.6960-70 horizontal mark, encompassing 38.2% Fibo. Moreover, successful encounter of 0.6970 can enables the pair to target 0.7100 area, as signaled by the 100-day SMA and 50% Fibo, breaking which 0.7280 – 0.7300 region, encompassing 200-day SMA, becomes strong resistance to limit further upside by the pair.


“Original analysis is provided by Admiral Markets
 
Technical Check - EURJPY, AUDJPY and CHFJPY

EURJPY


The pair's recovery from 132.00 odd level to 137.00 mark failed to lift it beyond a short-term descending trend-line resistance. The pair subsequently dropped back below 200-day SMA support, near 135.00 mark, to retest 133.00 mark support and is currently trading above 134.00 mark. From current levels 135.00 mark, representing 38.2% Fib. retracement level of Dec. 2014 to April 2015 downfall, seems to provide immediate resistance. Move above this immediate resistance might provide further upside momentum towards its next major resistance near 136.70-80 zone. Any up-move beyond 136.70-80 resistance now seems capped at the very important descending trend-line resistance, currently near 138.00 mark, also coinciding with 50% Fib. retracement level. On the downside, weakness below 133.00 mark immediate support seems to drag the pair back towards 132.00 mark support, representing 23.6% Fib. retracement level. Decisive break below 132.00 mark now seems to trigger a fresh leg of downward momentum initially towards 129.00 mark support and eventually towards 127.00 mark support, marking daily closing low level earlier tested in April.

AUDJPY


Reversal from 50% Fib. retracement level of the pair's steep fall in August extended further taking the pair back towards 83.00 mark. From current levels the pair seems vulnerable to continue drifting lower to retest the very important support near 82.00 mark, earlier tested in Aug. and Sept. 2015. Should the pair. Should the pair fail to hold this important support, it seems more likely to extend its downward trajectory further towards testing 61.8% Fib. expansion level support near 80.60-50 zone. Alternatively, should the pair attempt any recovery from current level, it is likely to confront immediate resistance near 83.80 region. This is followed by resistance at 23.6% Fib. retracement level, near 84.50-60 zone. Only a decisive strength back above 23.6% Fib. retracement level resistance now seems to negate any near-term bearish outlook for the pair, thus paving way for further recovery initially towards 38.2% Fib. retracement level resistance near 86.00 mark and eventually towards the very important resistance near 87.40-50 region, marked by 50% Fib. retracement level.

CHFJPY


The pair remains within a well-established down-trend as depicted by formation of a descending trend-channel on daily chart. After failing to conquer 125.00 mark immediate strong resistance, the pair fell back to retest 122.30-20 immediate strong support. The pair, however, has managed to recover from those lower levels and is currently trading near 123.00 mark. Recovery from important support is likely to face immediate resistance near 123.40-50 area, which if conquered has the potential to lift the pair back towards retesting the very important 125.00 mark resistance, now also coinciding with the upper trend-line resistance of the descending channel. Meanwhile, a break below 122.20-122.00 mark important support opens room for extension of the pair's downward trajectory back towards its next major support near 120.00 psychological mark support, also coinciding with the lower trend-line support of the channel. Considering the pair's well-established downward momentum, only a decisive break-through above 125.00 mark might negate expectations of any further bearish momentum in the near-term.


“Original analysis is provided by Admiral Markets
 
Technical Update - Important GBP Pairs

GBPUSD


Following its sharp reversal from 1.5650-60 strong resistance and a subsequent drop back below 200-day SMA, the pair is now retesting a very important horizontal support near 1.5160-50 area. A decisive weakness below this immediate support is likely to be followed by an immediate drop towards testing sub-1.5100 level intermediate support, marking 61.8% Fib. retracement level of April to June up-swing. Further, considering a break below 1.5160-50 important support, held since early May, the pair could be vulnerable to continue drifting lower in the near towards retesting the very important 1.5000 psychological mark support. Meanwhile, a bounce from current support area, leading to a move above 1.5200 mark now seems to confront immediate resistance near 1.5240-50 region, representing 50% Fib. retracement level. Although a decisive strength above 1.5240-50 resistance is likely to provide additional support for further near-term up-move, the recovery could possibly be capped at the very important 200-day SMA resistance, currently near 1.5320-30 area.

GBPJPY


Although the pair remains within a well-established ascending trend-channel formation on daily chart, recovery from the lower trend-line support of the channel failed to sustain strength above 200-day SMA. The pair subsequently dropped back and is currently trading back close the lower trend-line support of the channel, near 181.20-181.00 mark. Sustained weakness below the trend-channel support now seems to trigger a fresh-leg of corrective move, initially towards 178.50 support area, marking 61.8% Fib. retracement level of the pair's up-move from Oct. 2014 lows to high touched in June 2015. The near-term corrective move could further get extended towards its next major support near 175.60-50 region. Alternatively, a bounce from current support area is likely to face immediate resistance near 183.00 round figure mark, which if conquered has the potential to further boost the pair back towards a very important resistance confluence near 185.00 mark, comprising of 200-day SMA and 38.2% Fib. retracement level.

GBPNZD


The pair finally broke-below a short-term ascending trend-line support near 2.4000 mark, also coinciding with 50-day SMA, to test its immediate support near 2.3770-50 area, marking 23.6% Fib. retracement level of April to August 2015 up-swing. Although the pair managed to rebound from this immediate support to retest the ascending trend-line support break-point but on daily chart, it seems to have confirmed break below a bearish Rising Wedge chart-pattern, suggesting resumption of near-term corrective move. Hence, from current levels the pair seems to retest 2.3770-50 immediate support and subsequent extend the corrective move towards its next horizontal support near 2.3400 round figure mark, which could further get extended towards its next major support near 2.3100 region, marking 100-day SMA and also nearing 38.2% Fib. retracement level. Any attempts of recovery from current level is likely to face immediate hurdle near 2.4000 mark and up-move beyond 2.4000 mark now seems to be capped near 2.4100 mark resistance. Only a decisive strength back above 2.4100 mark resistance might negate expectations of a near-term corrective move.

GBPCHF


After consolidating in a trading range, the pair finally confirmed a break-down, taking it back below 1.4800 intermediate support marked by 38.2% Fib. retracement level of May to August 2015 up-move. From current levels the pair seems to extend its near-term weakness towards an important support confluence near 1.4630-20 area, comprising of 200-day SMA and 50% Fib. retracement level. Failure to hold this important support seems to open room for further depreciating move in the near-term towards testing its next major support near 1.4400 mark, representing 61.8% Fib. retracement level. Meanwhile on the upside, 1.4800 mark, representing 38.2% Fib. retracement level seems to act as immediate resistance. Sustained strength above this immediate resistance is likely to extend but seems limited at a very important support break-point turned resistance near 1.4900 mark.


“Original analysis is provided by Admiral Markets
 
Technical Overview: EURUSD, USDJPY, AUDUSD and USDCHF

EURUSD


Having failed to break its 1.1450-60 resistance area during mid-September, the EURUSD plunged to its 1.1110 – 1.1100 support-zone during last week; however, the pair couldn't manage to close below its 50-day and 100-day SMA confluence, presently at 1.1150-60 region. A pullback from the said SMAs seems currently favoring the pair's 1.1330-40 area re-test prior to again targeting 1.1450-60 resistance-zone. Should the pair manage to break 1.1460 on a closing basis, it can gather enough of strength to aim 1.1680, encompassing 50% Fibo of its October 2014 – March 2015 decline; though, 1.1530 can become intermediate resistance. Meanwhile, a break of 1.1150 can trigger the pair's decline to 1.1110 – 1.1100 support before testing the 23.6% Fibo level, near 1.1030. Moreover, a sustained trading below 1.1030 can give rise to the pair's plunge to 1.0800 important horizontal support.

USDJPY


Even if the 200-day SMA and 50% Fibo of its December 2014 – June 2015 advance, near 120.70-80 restricts the USDJPY's near-term up-move, short-term ascending trend-line support, presently near 119.20, becomes an important support to limit the immediate downside of the pair. Should it manage to close below 119.20, chances of its quick decline to 118.50 and 118.00 round figure mark can't be denied. Moreover, break of 76.4% Fibo, near 118.00, may make the pair vulnerable to plunge towards 117.00 level. On the upside break of 120.80, the 121.50 is likely an intermediate resistance for the pair before it could re-test the 121.80 – 122.00 important horizontal resistance, including 50-day SMA and 38.2% Fibo. Given the pair's ability to successfully surpass 122.00, it becomes strong contestant to surpass 123.00 psychological mark.

AUDUSD


Following its failure to break 0.7250-60 horizontal resistance and 50-day SMA, the AUDUSD currently aims to re-test 0.6920 – 0.6900 broad support area. Should the pair manage to close below its 0.6900 round figure mark, chances of its plunge to 0.6750, including 61.8% FE of its July – September decline, can't be denied; however, 0.6800 and the 0.6850 area likely intermediate supports during its downturn. Alternatively, 0.7040, 0.7115 and the 50-day SMA, presently near 0.7200, are likely immediate resistances that the pair needs to tackle in order to re-test 0.7250-60 horizontal resistance-zone. Further, successful break of 0.7260 can quickly fuel the pair's up-move towards 0.7350 and the 100-day SMA, near 0.7440-50 resistance area.

USDCHF


A bounce from 0.9530 fueled the USDCHF towards testing the highest level in a month; however, nine-month old descending trend-line continue to provide strong resistance to the pair that currently rests near its 50-day SMA, 0.9690, immediate support. A closing break of 0.9690 can recall the pair's quick decline to 0.9530, which if broken, can make the pair test 61.8% Fibo of its January plunge, near 0.9450, before targeting 0.9300 round figure mark. Should the pair trades above the said SMA, 76.4% Fibo, near 0.9750, is likely an immediate resistance for the pair before it could re-test the 0.9835 trend-line resistance. On an extended advance beyond 0.9835, the pair becomes strong enough to target 0.9900 and the 1.000 psychological magnet.


“Original analysis is provided by Admiral Markets
 
Back
Top