Technical Analysis by Admiral Markets

Technical Outlook - EURGBP, EURJPY and NZDJPY
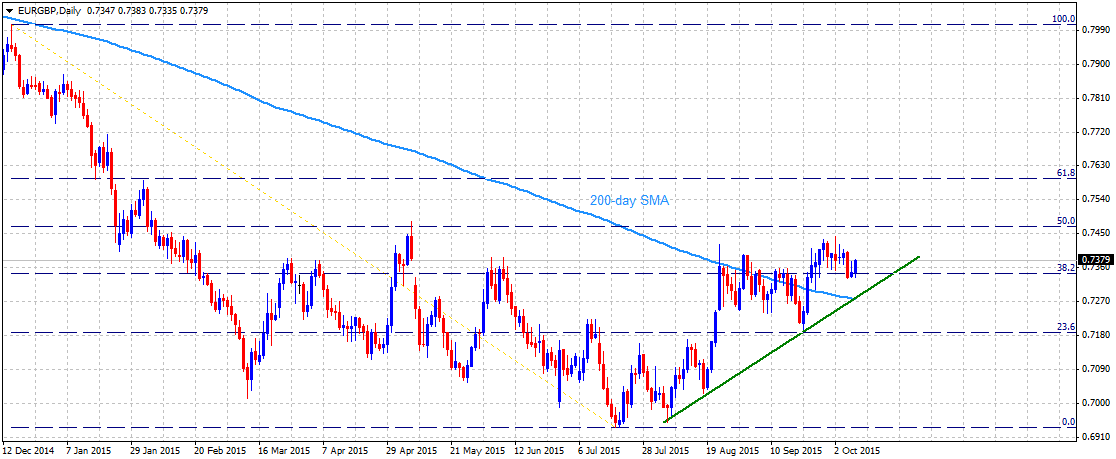
EURGBP


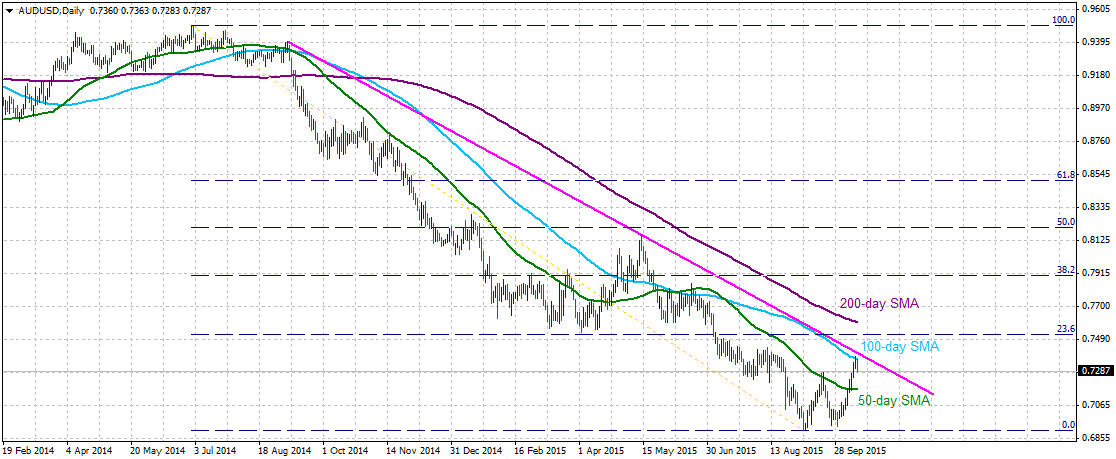
Extending its recovery along a short-term ascending trend-line support, the pair has decisively conquered the very important 200-day SMA hurdle for the first time since Oct. 2013 and subsequently moved above 38.2% Fib. retracement level. This 38.2% Fib. retracement level near 0.7340-30 area now seems to act as immediate support on the downside. Drop below this immediate support is likely to continue finding support at the ascending trend-line, near 0.7280-75 area, which now also coincides with 200-day SMA. Only a decisive weakness below this strong support confluence might negate expectations of any further near-term recovery and drag the pair immediately towards 23.6% Fib. retracement level support near 0.7200-0.7190 zone. Meanwhile, until the pair continues to hold its strength above 38.2% Fib. retracement level and manages to clear 0.7400 round figure mark, it is likely to extend its recovery immediately towards testing 50% Fib. retracement level. The near-term up-move could further get extended towards 0.7595-0.7600 resistance, marking 61.8% Fib. retracement level.

EURJPY


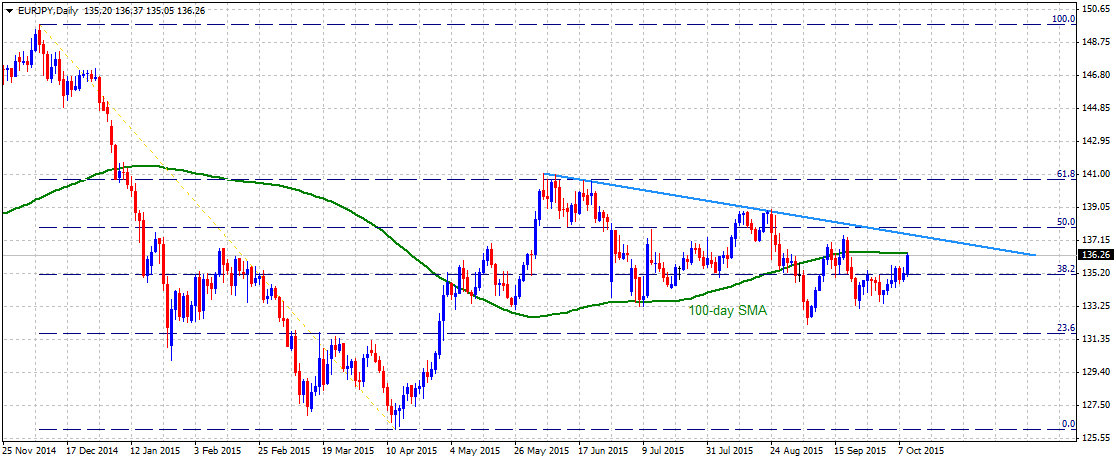
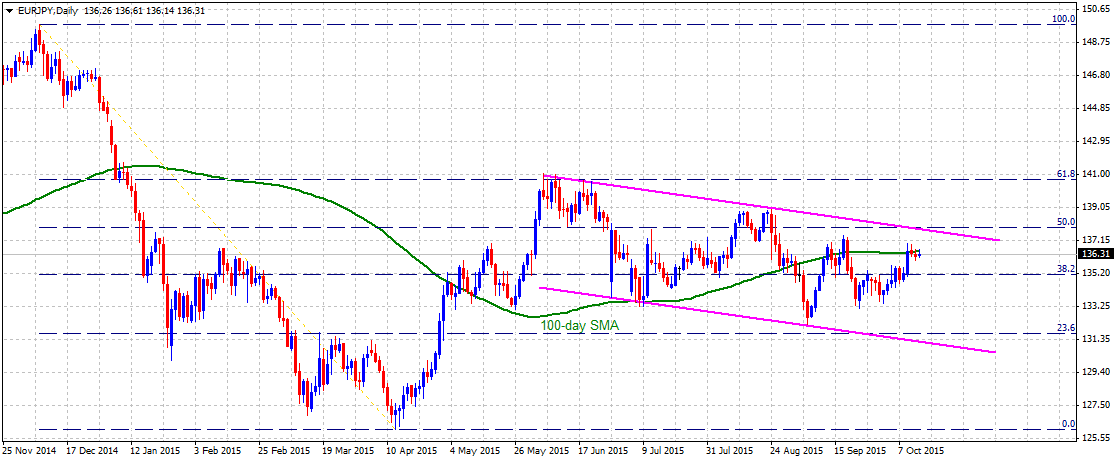
Even as the pair continues with its short-term descending trend, as depicted by a descending trend-channel formation on daily chart, it has managed to move back towards 100-day SMA immediate resistance, near 136.40. Continuing with its momentum, should the pair manage to move above 100-day SMA it is likely to aim back towards testing the upper trend-line of the channel, currently near 137.80-138.00 area, also coinciding with 61.8% Fib. retracement level of Dec. 2014 to April 2015 down-leg. Alternatively, should the pair fail to clear the 100-day SMA immediate hurdle, and drop back below 38.2% Fib. retracement level intermediate support near 135.00 mark, its is likely to resume it's near-term downward trajectory back towards testing 133.20-133.00 intermediate support before heading towards testing the lower trend-line support of the channel, near 131.50 region, also nearing 23.6% Fib. retracement level.

NZDJPY


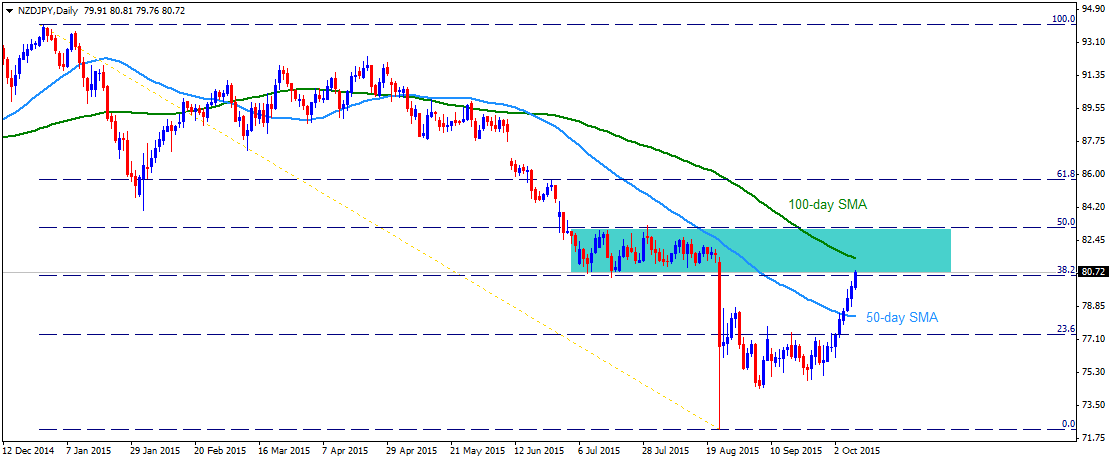
Although the pair has managed to register a meaningful recovery from August lows to move back above 50-day SMA for the first time since May 2015, it is yet to clear its previous trading range break-down point now turned immediate resistance near 80.80 level (close to 38.2% Fib. retracement level of Dec. 2014 to Aug. 2015 sharp fall). A move above this support turned resistance is likely to confront resistance at 100-day SMA, currently near 81.40-45 area, which if cleared has the potential to lift the pair back towards 83.00 mark resistance, coinciding with 50% Fib. retracement level. Meanwhile, reversal from current resistance area now seems to find immediate support near 80.00 psychological mark. Weakness below 80.00 mark seems get extended but is likely to be limited by 50-day SMA support, currently 78.40-20 area. The 50-day SMA now seems to have emerged as a strong support on the downside.


“Original analysis is provided by Admiral Markets
 
Technical Overview: Gold, Silver and US Dollar Index

GOLD


Irrespective of the yellow metal's failure to sustain $1142-45 important resistance break during early week, dovish FOMC minutes fueled the Gold prices on Friday towards the highest levels in more than a month, indicating an extended rally to 38.2% Fibo of its January - July decline, near $1165, and to the 200-day SMA, near $1178-80 area. However, the bullion is less likely to break the $1180, if at all it does, the metal prices can get a boost towards surpassing $1200 mark with 50% Fibo, near $1192, being intermediate resistance. On the downside, $1142-45 resistance-turned-support becomes crucial for the gold prices. Given a daily close below $1142, the prices could quickly test 23.6% Fibo, near $1130, and then declining to $1110 prior to revisiting the $1100 psychological magnet, also indicating the horizontal support. Moreover, inability to hold $1100 can make the metal prices vulnerable enough to plunge towards its July lows, near $1077 and ultimately testing $1030 support.

SILVER


Unlike Gold, which is heading towards its 200-day SMA test, the Silver prices couldn't surpass the said SMA during its early week rally and the same is restricting the while metal's immediate advance near $16.00 round figure mark. Should silver price successfully breaks the important SMA on a closing basis, chances of its quick up-move to $16.75, including 61.8% Fibo of January – August decline, can't be denied; though, 50% Fibo, near $16.25, can act as an immediate cap for the metal prices. On a further rise beyond $16.75, the metal's upward trajectory gets additional fuel to test $17.40 important resistance level, including 76.4% Fibo, breaking which prices can aim $18.00 on the upside. Alternatively, 38.2% Fibo, near $15.60, is likely nearby support that the metal prices can avail, breaking which 100-day SMA, near $15.25, becomes crucial to determine further moves of the white metal. If silver prices fail to stop its decline near $15.25, it can witness $14.90 and the $14.30 consecutive supports during its extended downturn.

US Dollar Index [I.USDX]


Ever since the greenback gauge reversed from its 93.30-20 important horizontal support, the 96.50-70 region kept restricting the upside of US Dollar Index. Currently, the index is near to the lowest level in three weeks, indicating further downside towards 94.50 and to the 94.00 round figure mark before re-testing the 93.30-20 horizontal mark. Should it fail to hold the crucial support area, it becomes vulnerable to quickly jump to the August lows, near 92.50, followed by the decline to 92.00 and 91.00 round figure marks. Extension of downside below 91.00 can magnify the index weakness to make it test the 90.00 psychological magnet. Meanwhile, the 95.40 can limit immediate advance by the index, breaking which the confluence of 50-day and 100-day SMA, near 96.00 – 96.10 area, quickly followed by the 96.50-70, are likely important upside levels that could control the index moves. Should it successfully breaks 96.70 on a closing basis, the 97.00 psychological level and the 97.80 are likely resistances that it could quickly aim for during its extended advance.


“Original analysis is provided by Admiral Markets
 
Technical Outlook: GBPUSD, EURGBP, GBPCHF and GBPNZD

GBPUSD


Lack of clear break above 200-day SMA, coupled with negative UK inflation reading, pulled back the GBPUSD to 1.5200 level, below 50% Fibo of its April – June rally, on Tuesday, indicating a quick test to 1.5150 support on a successive decline. Further, on a close below 1.5150, the pair may find it difficult to break 1.5100 – 1.5085 important horizontal support, also including 61.8% Fibo while inability to hold the 1.5085 can make the pair vulnerable to plunge towards 1.4985-80 multiple support-region. Meanwhile, on an upside break of the 200-day SMA, currently near 1.5325, the pair can rally to 38.2% Fibo, near 1.5400 round figure mark before extending its upward trajectory to 1.5485-90 important resistance-zone that constitutes 100-day SMA and nearly two month old descending trend-line. Given the pair's ability to surpass 1.5490, also surpassing the 1.5500 round figure mark on a closing basis, it becomes capable enough to aim at 23.6% Fibo level, near 1.5610.

EURGBP


On Tuesday, the EURGBP managed to surpass 0.7440-50 important horizontal resistance; however, 50% Fibo of its November 2014 – July 2015 decline, near 0.7485, followed by the 0.7525-30 ascending trend-line resistance, forming part of "Rising-Wedge" bearish formation, are likely important upside levels that the pair needs to clear before targeting 61.8% Fibo, near 0.7615, and 0.7700 round figure mark. Should the pair becomes capable of extending its up-move beyond 0.7700, it can easily look to break 0.7800 level and rest near 0.7825-30 area. On the downside, a close below 0.7440 may pull the pair back to 0.7350-45 support-zone, including two-month old ascending trend-line support and 38.2% Fibo. Though, a clear break of 0.7345 on a closing basis confirms the bearish technical formation, making the pair weaker enough to test 200-day SMA, near 0.7270, 0.7235-35 and the 23.6% Fibo, near 0.7200 round figure mark.

GBPCHF


Having repeatedly failed to break 1.5110-15 horizontal resistance during September, the GBPCHF ticked down below 1.4900 – 1.4890 support area and is currently resting near 1.4600 round figure mark, encompassing 200-day SMA and 50% Fibo of its May – August up-move. Should the pair manage to close below 1.4600 mark, it can quickly test 1.4540 and the 1.4500 supports during its consecutive downturn; however, a break of 1.4500 can make the pair vulnerable to plunge towards 1.4380 downside level. Alternatively, a close above 1.4600 can brighten chances of the pair's pullback to 1.4700 immediate resistance prior to testing 38.2% Fibo, near 1.4800 mark while further up-move beyond 1.4800 are likely being capped by 1.4890 – 1.4900 horizontal resistance region.

GBPNZD


Following its break of 2.3300 – 2.3290 horizontal support-turned-resistance, encompassing 100-day SMA, the GBPNZD aim at testing 2.2660-50 support-region. Should the pair breaks 2.2650 on a closing basis, it can quickly plunge to 2.2300 mark and to 50% Fibo of its January – August rally, near 2.2200 during its following downside. Moreover, a close below 2.2200 can make the pair vulnerable enough to fill the June gap near 2.1750. If the pair reverses from the current levels, 2.3100 can act as strong upside resistance for it to break in order to re-test 2.3290 – 2.3300 resistance area. On a further up-move beyond 2.3300, chances of the pair's near-term decline can be negated and the pair can rally to 2.3600 and 2.3770 prior to aiming 2.4000 mark surpass.


“Original analysis is provided by Admiral Markets
 
Technical Update - EURUSD, AUDUSD, NZDUSD and USDCAD

EURUSD


Although the pair continues to scale higher, briefly moving back above 1.1400 mark on Tuesday, but on 4-hourly chart it seems to be in the process of forming a bearish Rising Wedge chart-pattern with the upper ascending trend-line resistance near 1.1410 level. The formation, however, is not complete unless the pair decisively break below the lower ascending trend-line support, currently near 1.1320-15 region. A decisive break below 1.1320-15 support area now seems to drag the pair immediately towards 1.1250 intermediate support before making a dart towards its next important support near 1.1200 mark. Alternatively, a decisive strength above the upper trend-line resistance (currently near 1.1410-15 level), is likely to lift the pair immediately towards 1.1450-60 strong horizontal resistance. A sustained break above 1.1400 mark resistance and a subsequent strength above 1.1450 horizontal resistance should negate the bearish chart-pattern, thus opening room for further near-term up-move towards 1.1600-1.1620 resistance area.


AUDUSD


The pair is reversing from an important resistance confluence near 0.7380-0.7400 mark, comprising of 100-day SMA and a descending trend-line resistance extending from Sept. 2014 high through high touched in May 2015. Should the pair continue with its reversal from an important resistance confluence and weaken below 0.7260-50 immediate horizontal support, it seems to drop back towards testing 50-day SMA resistance turned support near 0.7170 level. Further, weakness below 50-day SMA seems more likely to continue dragging the pair lower towards its next major support near 0.7050 level. On the upside, 0.7380-0.7400 zone might continue acting as immediate strong resistance. Decisive strength above this strong resistance confluence now seems to open room for continuing the near-term recovery trend, initially towards 0.7500-0.7510 intermediate resistance and eventually towards 200-day SMA resistance, currently near 0.7600 mark.


NZDUSD


On 4-hourly chart, the pair clearly seems to oscillate within a well-established ascending trend-channel, with the lower trend-line support near 0.6660-50 area, also coinciding with 100-day SMA. Should the pair continue holding this immediate support and sustains its strength above 0.6700 round figure mark, it seems more likely to extend its near-term upward trajectory towards testing the upper trend-line resistance of the channel, currently near 0.6800 mark. However, should the pair fail to hold this immediate support it is likely to immediately drop towards 0.6600 round figure mark support, nearing 23.6% Fib. retracement level of its recovery from Sept. lows to high touched. Break below the short-term ascending trend-channel could further get extended towards its next major support near 0.6500 mark (50% Fib. retracement level) with intermediate support near 0.6550 level marking 38.2% Fib. retracement level.


USDCAD


Reversal from 61.8% Fib. retracement level of Jan. 2002 to Nov. 2011 big downfall dragged the pair below 1.3000 mark to test an important support confluence near 1.2900 mark, comprising of 100-day SMA and 38.2% Fib. retracement level of May to Sept. 2015 up-swing. The pair has managed to rebound sharply from 1.2900 mark support and is now headed close to 23.6% Fib. retracement level immediate resistance, near 1.3090-1.3100 mark. Momentum above this resistance is more likely to confront another resistance at 50-day SMA region, currently near 1.3180 level. Meanwhile, a drop back below 1.3000 round figure mark seems to drag the pair back towards 1.2900 mark important support. Failure to hold 1.2900 mark support now seems to continue dragging the pair in the near-term, towards testing its next major support (previous strong resistance) near 1.2800-1.2780 region.


“Original analysis is provided by Admiral Markets
 
Technical Update - EURCHF, EURJPY, EURCAD and EURNZD

EURCHF


The pair once again failed to clear its intermediate descending trend-line resistance and has now dropped back to the lower trend-line support of a short-term ascending trend-channel formation on 4-hourly chart. Should the pair decisively break below the lower trend-line support of the channel, currently near 1.0900-1.0890, it seems to accelerate the downfall immediately towards 1.0810-1.0800 round figure mark support. Failure to hold 1.0800 mark support might increase the pair's vulnerability to continue drifting lower, initially towards 1.0700 mark intermediate support and further towards testing the very important 200-day SMA support, currently near 1.0610-1.0600 area. Meanwhile, bounce from the lower trend-line support of the channel might continue to be restricted by the short-term descending trend-line, currently near 1.0940-50 area. A decisive break-through this immediate resistance now seems to provide the required momentum to surpass 1.1000 and 1.1050 intermediate resistance levels and test the upper trend-line resistance of the channel, currently near 1.1140-50 region.

EURJPY


The pair's strength above 135.00 mark, also representing 38.2% Fib. retracement level of Dec. 2014 to April 2015 down-leg, seems to face a strong resistance at 100-day SMA. Even if the pair manages to decisively move above 100-day SMA, currently near 136.50 level, it is likely to confront a strong resistance near 137.90-138.00 mark. This 138.00 mark resistance comprises of 50% Fib. retracement level and the upper trend-line resistance of a short-term descending trend-channel formation on daily chart. Meanwhile, weakness back below 136.00 round figure mark now seems to drag the pair back towards 135.00 mark. Failure to hold this 135.00 mark support is likely to trigger resumption of the pair's near-term downward trajectory, initially towards 133.30-10 intermediate support and eventually below 23.6% Fib. retracement level support (131.60-50) towards testing the lower trend-line support of the channel, currently near 131.10-131.00 mark.

EURCAD


Although in the near-term, the pair seems to have found support near 1.4600-1.4580 area, representing 38.2% Fib. retracement level of its April to August up-swing, any further up-move beyond 1.4900 mark is likely to face strong resistance near 1.4950 confluence zone, comprising of 23.6% Fib. retracement level and a short-term descending trend-line. Moreover, the combination of 38.2% Fib. retracement level support and the descending trend-line resistance seems to constitute towards formation of a bearish descending triangle. The formation, however, is not complete until the pair decisively breaks below 1.4600 mark strong horizontal support. Immediate downside support is pegged at 1.4700 round figure mark. Meanwhile on the upside, should the pair manages to decisively strengthen above 1.4950 strong resistance, it seems likely to resume its near-term upward trajectory back towards 2015 daily closing high resistance near 1.5400-20 region.

EURNZD


Following a sustained break below 50-day SMA for the first time since Feb. 2015, the pair dropped to test an important support confluence near 1.6850 area. The 1.6850 level support comprises of 100-day SMA and 38.2% Fib. retracement level of April to August up-move. Failure to hold this immediate support is likely to increase the pair's vulnerability to extend its near-term corrective move towards testing its next major support near 1.6340-20 zone, also nearing 50% Fib. retracement level, with intermediate support near 1.6600 horizontal level. Meanwhile, should the pair once again manage to bounce from current important support confluence and manages to climb back above 1.7000 psychological mark, it could possibly extend the bounce in the near-term. Momentum beyond 1.7000 mark is likely to confront resistance at 1.7150-70 area, which if cleared is likely to lift the pair back towards retesting an important resistance near 1.7300 mark, nearing 50-day SMA.


“Original analysis is provided by Admiral Markets
 
Technical Overview: Important CHF Pairs

USDCHF


Following its repeated failures to break a year old descending trend-line resistance, presently near 0.9800 round figure mark, the USDCHF seems obeying well-established descending trend-channel on its H4 chart. However, 0.9530 – 0.9510 important horizontal support region, also including the channel support, may limit the pair's immediate downside. Should the pair manage to break 0.9510 on a closing basis, also dipping below 0.9500 psychological level, it can quickly drop to 0.9385-80 support area prior to targeting the August lows, around 0.9250. Meanwhile, 0.9585 and 0.9650 are likely nearby resistances that the pair could witness during its bounce before testing the 0.9680 channel resistance. Further, a move beyond 0.9680 can extend the pair's upward trajectory towards 0.9760-65 area ahead of re-testing the mentioned resistance line level, near 0.9800.

CHFJPY


Even if the 122.20 – 122.00 straight line support-region again restricted the CHFJPY decline, short-term descending trend-channel resistance, coupled with 50-day SMA, currently at 124.80-85 area, seems limiting the pair's immediate up-move. However, a move beyond 124.85 can find 61.8% Fibo of its March – June advance, near 125.50, and the 125.80 level, as following resistances prior to marching towards 126.50 and 50% Fibo, near 127.25. Should the pair manage to break 127.25 on a closing basis, it becomes capable enough to rally towards 129.00 psychological resistance, also including the 38.2% Fibo. On the downside, 124.00 and 123.00 round figure marks can act as quick supports for the pair before it could re-test the 122.20 – 122.00 area. Moreover, a sustained break below 122.00 on a closing basis can make the vulnerable enough to plunge towards 121 and the March lows, near 119.80.

NZDCHF


Irrespective of the NZDCHF's break of more than a month old 0.6050 – 0.6300 trading range, also surpassing 100-day SMA, the pair failed to surpass long standing descending trend-line resistance, presently near 0.6475-80. The pair now seems capped between the 100-day SMA, near 0.6340, and the mentioned trend-line resistance while a move below 0.6340 can again pull it back to broad range with 0.6300, 0.6200 and 0.6140 acting as initial supports before testing the range support of 0.6050. During its extended decline below 0.6050, the 0.5990 may provide an intermediate support to the pair before it can aim for August lows, near 0.5780. Alternatively, an upside break of 0.6480 can quickly fuel the pair towards 0.6600 – 0.6615 resistance region, also including 38.2% Fibo of its January – August decline, breaking which the pair becomes capable enough to target 0.6780 and 0.6930 during its successive up-move.

AUDCHF


AUDCHF's slow and steady up-move from 0.6730-40 support area strengthened the pair towards breaking the 0.7000 round figure mark during early October and also surpass the 100-day SMA, currently at 0.7040; however, seven month old descending trend-line resistance, near 0.7080 at present, restricted its further advance, resulting a pullback to sub-0.6900 region. Considering the current situation, the pair is more likely to test 0.6830 and 0.6795 immediate supports prior to re-testing the short-term ascending trend-line, near 0.6750. Should the pair breaks 0.6750 on a closing basis, it can immediately drift lower to 0.6700 and can further aim towards testing August lows, near 0.6540. Given the pair's reversal from current level, 0.7000 and the 0.7040 are likely nearby resistances that it could witness before re-testing the mentioned trend-line resistance, near 0.7100 psychological level. Moreover, a successful rise above 0.7100 can enable the pair towards testing 38.2% Fibo of its January – August decline, near 0.7250 with 0.7125-30 being intermediate stop.


“Original analysis is provided by Admiral Markets
 
Chart Of The Day: USDJPY Pulls Back From Range Support


Following its break of 119.85, encompassing 38.2% Fibo of its June – August downturn, on Tuesday, the USDJPY plunged to the lowest levels in a month during its decline on Wednesday; however, short-term trading range support, near 118.60, triggered the pair's pull back during early hours of trading on Thursday, signaling a quick test to 119.50 immediate resistance prior to re-joining the 119.85 mark. On a successive move beyond 119.85, the 120.50 and the range resistance near 120.90 – 121.00, including 200-day SMA and 50% Fibo, are likely tough levels to limit the pair's further up-move. Alternatively, a break below 118.60, also surpassing the 23.6% Fibo, near 118.45, can make the pair vulnerable enough to plunge towards testing the August lows, near 116.00 round figure mark.


“Original analysis is provided by Admiral Markets
 
GBPCAD, CADJPY, CADCHF and AUDCAD: Technical Update

GBPCAD


Even if the descending trend-line resistance, forming part of "Falling-Wedge" bullish technical pattern, pulled the GBPCAD towards three month lows, the 1.9750-45 horizontal support, including 38.2% Fibo of its January – August rally and lower line of the formation, helped the pair's bounce toward 1.9970-80 area. From the current level, 2.0075-80 is likely an immediate resistance that it could test prior to re-visiting the formation resistance, coupled with the 23.6% Fibo, near 2.0200 mark. Should the pair manage to break 2.0200 on a closing basis, chances of its quick rally towards 2.0550 can't be denied while 2.0350 can act as an intermediate resistance. Alternatively, 1.9900 and 1.9800 may limit the pair's near-term decline before it could test the 1.9750-45 support area. Moreover, a break below 1.9750 can witness 1.9690, formation support, as a strong downside level restricting its decline, dipping below the same can make the pair vulnerable to plunge towards 1.9500 and the 1.9365-70 support level, including 50% Fibo and 200-day SMA.

CADJPY


CADJPY's effort to break the six week old 88.70 – 92.50 trading range were capped by the three month old descending trend-line resistance, presently near 93.00 round figure mark, pulling it back to the mentioned range area. The pair currently struggles near 50-day SMA, with 91.40, being immediate support, breaking which 23.6% Fibo of June – August downturn, near 90.60, and the 90.00 psychological magnet, are likely consecutive supports for the pair before it could re-test the 88.70 mark. Should the pair fails to hold the 88.70, it can quickly plunge to August lows near 87.40. On the upside, 92.50, the 38.2% Fibo, near 92.65 and the trend-line resistance, near 93.00 are likely important resistances that could restrict the pair's near-term advance while a successful break above 93.00 on a closing basis can trigger the pair's rally towards 50% Fibo, near 94.30.

CADCHF


Following its failure to break five month old descending trend-line resistance, the CADCHF's declines were limited by the 61.8% Fibo of January - March advance and the short-term ascending trend-line, connecting lows marked in August and September. As the pair recently bounced from the support, the 0.7400 area is likely providing immediate resistance prior to its run towards 50% Fibo, at 0.7430 and the mentioned trend-line resistance, at 0.7445-50 zone. If the pair manage to break 0.7450, it can immediately rise to 0.7500 round figure mark prior to visiting the 200-day SMA, near 0.7530 and the 38.2% Fibo, near 0.7550. Moreover, a close above 0.7550-60 can enable the pair to rally towards 0.7625-30 resistance region. On the downside, the said support-line, currently at 0.7315, is likely strong support for the pair, breaking which it is expected to plunge towards 0.7260 and the 0.7205 – 0.7200 horizontal support area. Should the pair fails to withstand near 0.7200, it can extend the downward trajectory towards August lows, near 0.6940 and then to the late-January lows, near 0.6900 round figure mark.

AUDCAD


During its recovery rally from 0.9250-45 horizontal support, the AUDCAD managed to break the 0.9415 – 0.9430 horizontal mark; however, the 200-day SMA, near 0.9590 at present, capped the pair's following up-move, making it currently trade near the 0.9415 – 0.9430 resistance-turned-support-zone. On the upside, 0.9505, encompassing the 38.2% Fibo of its January – September decline, and the 200-day SMA can limit the pair's near-term advance, breaking which the pair becomes capable enough to rally towards 0.9680 and the 61.8% Fibo, at 0.9730, resistance levels before surpassing the 0.9800 mark. Meanwhile, a close below 0.9415 can quickly test 23.6% Fibo, near 0.9370 and then the 0.9300 before re-testing the 0.9250-45 support. Given the pair's inability to hold 0.9245, the pair can aim for September lows, near 0.9150 with 0.9200 being intermediate support.


“Original analysis is provided by Admiral Markets
 
Technical Check - Important AUD Pairs

EURAUD


On daily chart, the pair has clearly broken below its near-term trading range and a subsequent rebound from 1.5400 round figure mark now seems to confront immediate resistance at 50-day SMA. Considering the break-down, the pair, from current levels, seems vulnerable to resume its near-term corrective move initially towards 1.5500-1.5480 intermediate support, marked by 38.2% Fib. retracement level of April to August up-swing. On a sustained weakness below this immediate support, the pair is likely to extend its near-term corrective move towards testing its previous strong resistance now turned support near 1.5300-1.5280 zone. However, should the pair manage to move back above 50-day SMA immediate resistance near 1.5680-1.5700 mark, it seems to witness further up-move towards 1.5900 mark resistance area, coinciding with 23.6% Fib. retracement level.

GBPAUD


The pair's reversal from 2.2100 mark and a subsequent drop below 2.1400 mark strong support now seems to have found some support near 2.0800 mark, representing 38.2% Fib. retracement level of Jan. to Aug. 2015 strong up-move. The pair is currently hovering around 100-day SMA and should it continue holding above 100-day SMA support 2.1060-50 area, it seems to make an attempt to retest 2.1400 mark immediate strong resistance, also coinciding with 23.6% Fib. retracement level. Alternatively, weakness back below 100-day SMA is likely to drag the pair back towards retesting 38.2% Fib. retracement level support near 2.0800 mark. Moreover, break below 100-day SMA for the first time since May 2015 and inability to sustain rebound strength above 100-day SMA would suggest extension of the near-term weakening trend towards testing its next major support near 2.0350 level, represented by 50% Fib. retracement level and also nearing 200-day SMA region.

AUDNZD


Failure to hold its previous strong resistance turned important support near 1.0870-50 zone, also coinciding with 50% Fib. retracement level of April to August appreciating move, triggered a sharp fall on Wednesday. The downfall dragged the pair below 200-day SMA to test its next support near 1.0660-50 area, marking 61.8% Fib. retracement level support. Weakness below this immediate support seems to accelerate the fall towards 1.0570-1.0550 horizontal support, which if broken sets the stage for continuation of the near-term downward trajectory back towards its next major support near 1.0350-40 area. Meanwhile, bounce from current support level now seems to face immediate resistance at 200-day SMA, currently near 1.0760 level. Any further up-move beyond this immediate resistance now seems to be restricted by a historic resistance area near 1.0870-50 zone (50% Fib. retracement level.

AUDJPY


The pair's recovery from its lowest level since Nov. 2012 and a subsequent move above 50-day SMA for the first time since June 2015 fizzled at 61.8% Fib. retracement level of its sharp fall in August. The pair has now moved back to 50-day SMA support near 86.70 level. Failure to hold 50-day SMA support, leading to a weakness below 86.00 mark (38.2% Fib. retracement level), is more likely to continue dragging the pair back towards its next major support near 84.60-50 area, marking 23.6% Fib. retracement level. On the upside, 87.30-40 area (50% Fib. retracement level) now seems to have emerged as immediate resistance. Decisive strength back above this immediate resistance has the potential to lift the pair back towards 61.8% Fib. retracement level resistance near 88.60-65 region.


“Original analysis is provided by Admiral Markets
 
Technical Outlook: US Dollar Index, EURUSD and Euro Index

US Dollar Index (I.USDX)


Following its break of 95.30, the US Dollar Index (I.USDX) stretched the declines toward the lowest level in nearly six weeks; however, better that forecast Core CPI numbers from US, triggered the index pullback from 50% Fibonacci Retracement of its November 2014 – March 2015 advance. The greenback gauge seems now capable of extending its bounce to 95.00 and the mentioned 95.30 immediate resistance levels; however, 100-day and 200-day SMA confluence, 95.90 – 96.00, becomes a strong upside level that the index needs to tackle in order to rally towards 96.45-50 important horizontal resistance level. Should it becomes capable enough to surpass 96.50 on a closing basis, chances of its quick rally towards 97.70-80 becomes brighter. On the downside, 50% Fibo near 93.75, quickly followed by the 93.30 crucial horizontal support, are likely levels that could limit further downside of the gauge. If the index fails to hold 93.30, it becomes vulnerable to plunge towards 92.00 round figure mark.

EURUSD


Even if the two month old ascending trend-line depicts the EURUSD up-move to recently marked two month high, the long standing 1.1460-90 strong horizontal resistance region, restricted the pair's further advance during Thursday. Given the pair's recent pullback from important resistance, coupled with improved USD, the pair is more likely to re-test 1.1280 immediate support before resting near the 1.1230-25 area, encompassing 38.2% Fibonacci Retracement of its December 2014 to March 2015 and said trend-line support. In case the pair fails to hold 1.1225, it can immediately drift lower to 1.1100 round figure mark. Alternatively, a reversal from the currently 1.1350 area may reach out to 1.1400 psychological mark prior to facing 1.1460-90 area. If the pair manage to break 1.1490, also surpasses the 1.1500 mark, chances of its extended upward trajectory towards 1.1650 can't be denied.

Euro Index (I.EURX)


Failure to surpass the 100.00 psychological magnet on a daily basis pulled back the Euro gauge to the week's low on Friday, indicating further downside towards 98.50 and the 23.6% Fibo of its March 2014 – March 2015 decline, near 98.25, quickly followed by the 100-day SMA, near 98.00 round figure level. Even if the index is more likely to reverse from the said SMA, as it did during August and September, a break of which can make the index weaker enough to directly plunge to 97.00 and then to the seven month old ascending trend-channel support near 96.40. Meanwhile, a closing break of 100.00 mark could strengthen the index towards rallying to 100.50 and the 38.2% Fibo, near 100.95 while further up-moves can find it difficult to break channel resistance, near 101.60.


“Original analysis is provided by Admiral Markets
 
Back
Top