Technical Analysis by Admiral Markets

Technical Update: GBPCAD, GBPCHF and CADCHF
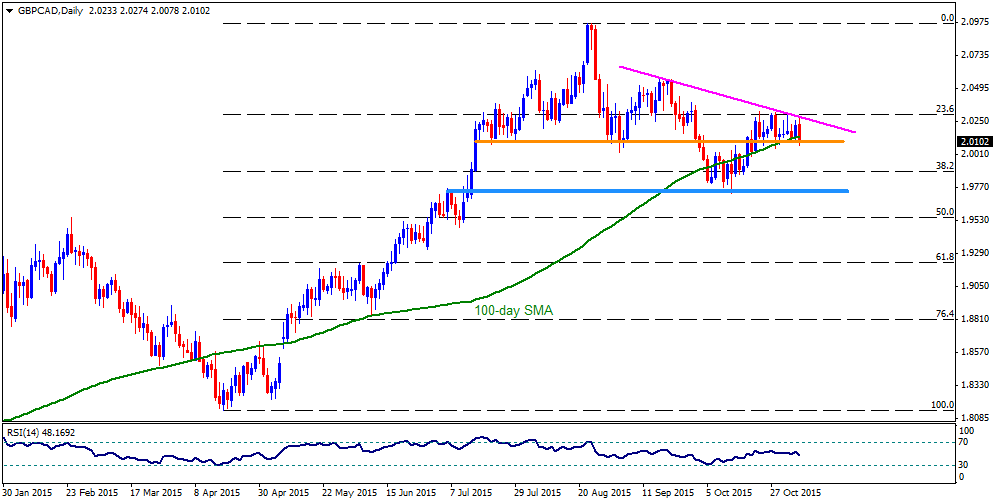
GBPCAD


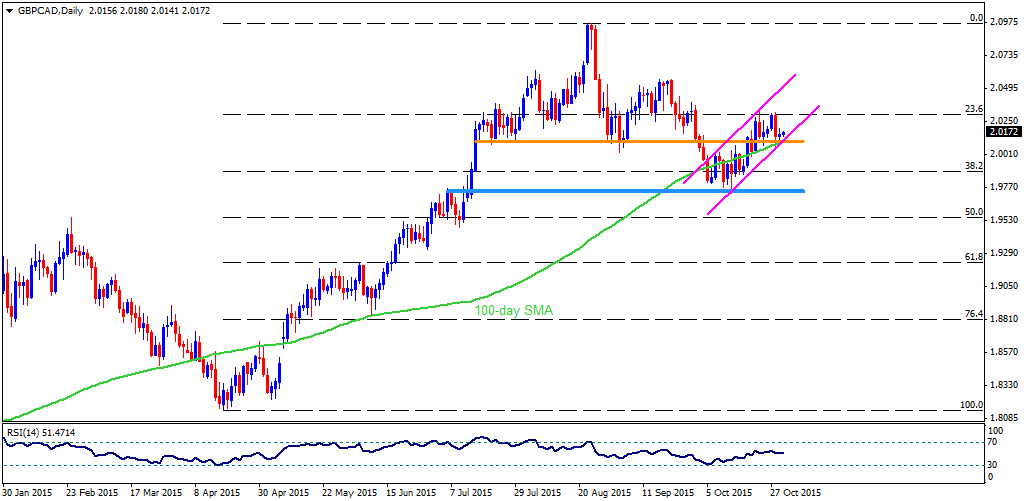
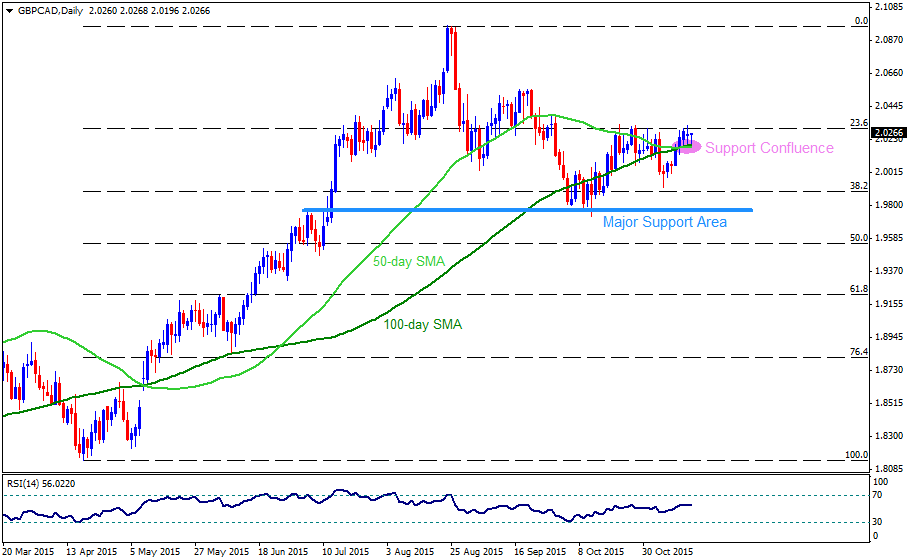
Although, GBPCAD failed to break 2.0300 round figure mark, also encompassing 23.6% Fibo of its April – August rally, the 2.0110 – 2.0100 support area, including 100-day SMA, horizontal support region and lower line of the short-term ascending trend-channel, provides strong downside support to limit the pair's further decline. On the upside, the 2.0300 is likely immediate resistance that the pair can witness during its pullback move, breaking which 2.0500, including the channel resistance may restrict the pair's advance. Should it manage to break 2.0500 on a closing basis, chances of the pair's rally towards 2.0970, including August highs, can't be denied; though, 2.0600 is likely an intermediate resistance for the pair. Alternatively, a daily break below 2.0100 can quickly pull the pair back to 2.0000 psychological magnet and then to 38.2% Fibo, near 1.9900 mark, breaking which 1.9730-50 support-zone may stop the pair's down-turn.
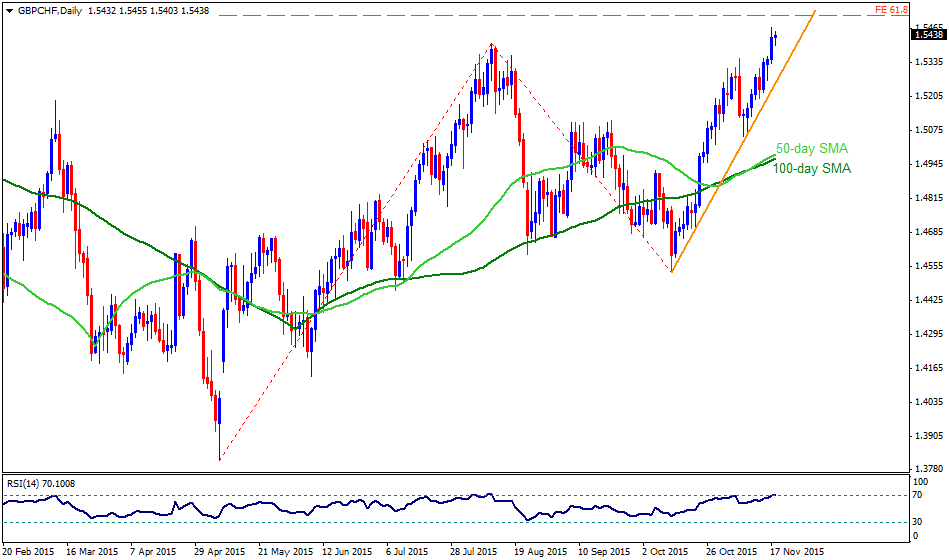
GBPCHF


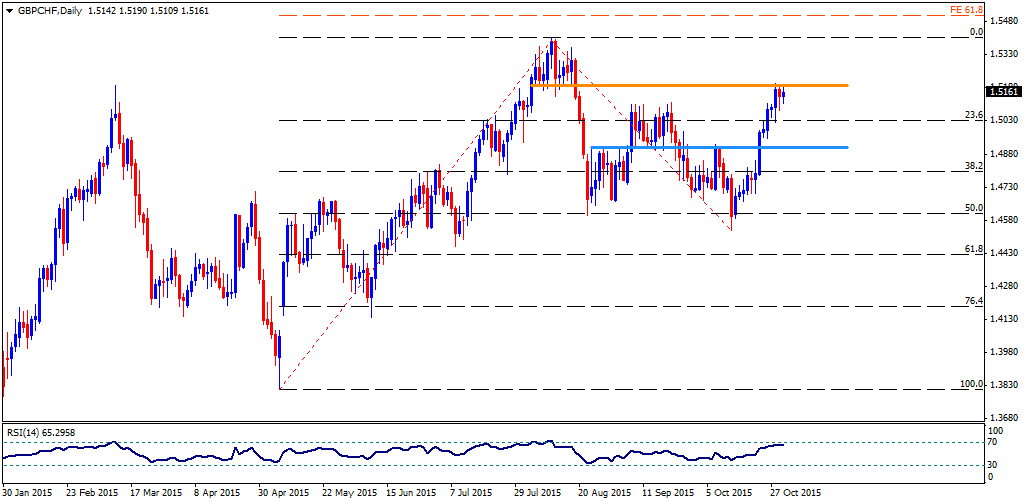
Following its reversal from 1.4500 area, the GBPCHF managed to register considerable up-move, fueling the pair towards highest levels in more than two months during early weekdays; however, 1.5185 – 1.5200 horizontal resistance region restricted its further advance. Should the pair fails to break the 1.5200 mark on a daily closing basis, it can quickly decline to 23.6% Fibo of its May – August up-run, around 1.5030, breaking which the pair becomes weaker enough to aim for 1.4910 – 1.4900 horizontal support region and to the 38.2% Fibo, near 1.4800 round figure mark. Meanwhile, pair's ability to surpass 1.5200 can trigger immediate run to 1.5310, breaking which 1.5400, near the August highs, and the 61.8% FE of the said rally, around 1.5500 round figure mark, are likely consecutive resistances that the pair should witness during its successive advance.
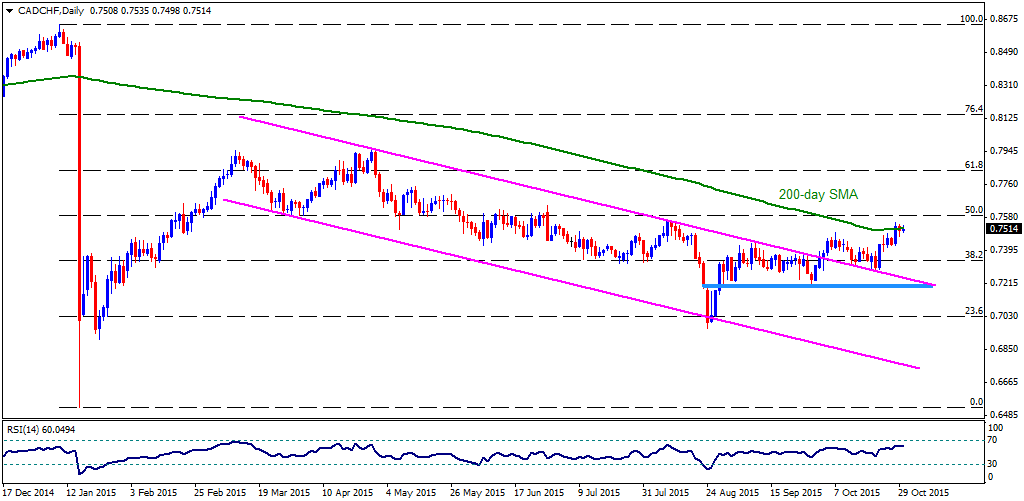
CADCHF


Sustained break of seven month old descending trend-channel favored the CADCHF rally towards the highest levels since early August; though, 200-day SMA, presently near 0.7520, limits the pair's additional rise, indicating the pair's pullback to 0.7400 round figure mark. Should the pair keep trading down below 0.7400, 38.2% Fibo of its January plunge, near 0.7330 and the channel resistance-turned-support, near 0.7245, are likely following supports that it could witness during its down-turn. Moreover, a break below 0.7245 can witness 0.7200 – 0.7195 as strong horizontal support to limit the pair's further downside, breaking which chances of its quick plunge to 23.6% Fibo, near 0.7020, can't be denied. On the other hand, a daily close above 0.7520, can make the pair witness 50% Fibo, near 0.7585, and the 0.7655-60 resistance area before it could rally to 0.7750 and the 0.7830 levels.


“Original analysis is provided by Admiral Markets
 
Technical Traits of EURUSD, GBPUSD and USDCHF

EURUSD


Ever since the EURUSD dipped below 1.1100 round figure mark, also encompassing 200-day SMA and a horizontal support-turned-resistance, the pair kept trading southwards in a gradual manner, favoring extended declines toward 1.0820 – 1.0800 crucial support area. Though, 23.6% Fibonacci Retracement of its December 2014 – March 2015 down-leg, near 1.0945-40, can offer immediate support to the pair. Should it break the 1.0800 on a closing basis, chances of the pair's plunge towards 1.0650 and to the March lows, around 1.0450, become stronger. On the upside, 1.1100 – 1.1110 region can keep limiting the pair's near-term advance, breaking which it can quickly move upwards to 1.1250, the 38.2% Fibo level. On a further rise beyond 1.1250, the 1.1330 and the 1.1400 are likely consecutive resistances that the pair might aim before going to test the 1.1485 – 1.1500 pivotal resistance-zone, including 50% Fibonacci.

GBPUSD


The 100-day SMA seems again playing a critical role in limiting the GBPUSD up-move, signaling the pair's pullback to 1.5330 prior to testing the 1.5250-40 support-zone, comprising of a month old ascending trend-line and 50% Fibonacci Retracement Level of its April – June rally. Further, inability to hold the 1.5240 mark can trigger the pair's renewed downside towards 1.5160 and to the crucial 1.5100 – 1.5085 support area, including 61.8% Fibo. Alternatively, a sustained break above 1.5485, encompassing the 100-day SMA, may find nearly five month old descending trend-channel resistance, around 1.5525-30 area, as another obstacle to propel its northward journey. Moreover, successful encounter of 1.5530 can strengthen the pair's rise towards 1.5600 – 1.5610, break of which may propel the pair to aim for 1.5800 resistance-zone; though, 1.5675-80 can act as a buffer.

USDCHF


USDCHF's break above 0.9800 descending trend-line resistance triggered the pair's rally to the highest level in more than seven months; however, a pullback from 0.9955-60 area stalled its further up-move. The pair currently bounced back from 0.9830 and is likely heading to 0.9955-60 mark again, breaking which six month old ascending trend-channel resistance, around 1.0050-55, and the 1.1100 – 1.1110 horizontal resistance region, may limit the pair's up-ward trajectory to January highs near 1.0240. Meanwhile, 0.9830 is likely immediate support for the pair, breaking which the 0.9750-45 zone, including the 76.4% Fibo and the mentioned trend-line resistance-turned-support, becomes a tough level to limit the pair's downside. If the pair fails to hold 0.9740, the recent breakout gets negated and the pair can become vulnerable to plunge towards 200-day SMA, near 0.9560-50.


“Original analysis is provided by Admiral Markets
 
Technical Outlook: Important JPY Pairs

USDJPY


Bounce from 118.00 triggered USDJPY's gradual price improvement, as depicted by the short-term ascending trend-channel; however, the pair currently witnesses 121.40-50 horizontal-zone as important nearby resistance, breaking which 121.80, 61.8% Fibo of August decline, is likely an intermediate stop that it needs to clear before rallying towards 122.80, encompassing the said channel resistance line. Moreover, a sustained up-move beyond 122.80, may find 123.20, 76.4% Fibo, and the 124.00 mark as consecutive resistances. Should the pair failed to break 121.50 and reversed from the current level, as it did recently, 50% Fibo and the channel support, near 120.70, becomes an important support level for the pair trader to watch, breaking which the pair renew its downside towards 120.00 and the 38.2% Fibo, near 119.60. On a further downside below 119.60, the pair is likely to test 119.00, 118.50 and the current month lows of 118.00.

EURJPY


Even if the EURJPY plunged to the lowest levels in six months during last week's plunge, it failed to close below the broader "Falling-Wedge" bearish formation support, also encompassing 61.8% Fibonacci of the pair's April – June rally, near 131.75. However, short-term descending trend-line, connecting the recent highs, keep limiting the pair's immediate upside, signaling another attempt by the pair to test the mentioned 131.75 important support level. If the pair breaks 131.75 on a closing basis, chances of it quick plunge to 130.60-50 can't be denied, breaking which the 76.4% Fibo, near 129.50 becomes the following support for the pair. On the upside, a break above descending trend-line resistance, near 133.00 round figure mark, may click the pair's tick to the 50% Fibo level of 133.50, breaking which 134.50 and the 38.2% Fibo, near 135.30, may provide the buffer to the pair's upward trajectory before it could test the formation resistance, also including the 100-day SMA, near 135.80 – 136.00 area.

AUDJPY


Following its reversal from 85.60-50 support confluence, comprising 50-day SMA, 23.6% Fibonacci Retracement Level of the pair's May – September decline, short-term descending trend-channel support and a month ascending trend-line support, the AUDJPY currently trades near a week's high. However, the said channel resistance and the 38.2% Fibo, near 87.90, can limit the pair's immediate rise. Should the pair manage to break 87.90, also closes above 88.00 round figure mark, the pair could rally to 88.60 and then to the 50% Fibo, near 89.50-60 resistance area. Meanwhile, 86.30 can act as immediate support for the pair, breaking which said 85.60-50 support confluence comeback becomes sure. Furthermore, the pair's closing break of 85.50 can quickly pull the pair towards 85.00 mark prior aiming for 83.60-50 support area.

CADJPY


A close above four month old descending trend-line resistance, presently around 92.00, fueled the pair to test the highest levels in three weeks; though, the pair currently struggles near 38.2% Fibo of its June – August downside. Given the pair's inability to sustain the break, coupled with the daily closing below 92.00, the recent breakout gets negated and the pair can again aim for 91.30 and the 23.6% Fibo near 90.50 mark. Further, extended declines below 90.50, also breaking the 90.00 can make the pair vulnerable enough to plunge towards 88.80-70 horizontal support area. Alternatively, successive close above 93.30 immediate resistance and the 100-day SMA level of 93.70, can fuel the pair's upward trajectory towards 50% Fibo, 94.30. Should the pair manage to surpass 94.30 on a closing basis, it could rise towards 96.00 round figure mark.


“Original analysis is provided by Admiral Markets
 
USDCAD, EURCAD, GBPCAD and CADCHF: Technical Forecast

USDCAD


Even if the USDCAD managed to bounce from 1.3040-30 horizontal mark, the 50-day SMA, presently at 1.3170, quickly followed by the 1.3230 descending trend-line resistance, connecting highs marked in September and October, may restrict the pair's near-term up-move. Given the ability to surpass 1.3230 on a closing basis, 1.3300 and 1.3350 are likely consecutive resistances that the pair could witness during its northward trajectory to September highs of 1.3450. Meanwhile, 23.6% Fibonacci Retracement of its May – September surge, around 1.3090, can act as immediate support for the pair, breaking which the 1.3040-30 horizontal support area can limit the pair's further downside. Should it fail to hold 1.3030, nearly six month old ascending trend-line support, at 1.2950-45 currently, becomes pivotal to stop the pair's south-move while consecutive decline below which can find 38.2% Fibo, near 1.2870, and the 1.2770-50 support-zone as following downside levels.

EURCAD


EURCAD's dip from the descending trend-line resistance, joining highs marked in August, September and October, triggered the pair's considerable declines that broke six month old ascending trend-line support on Tuesday, indicating further downside towards 200-day SMA, near 1.4120 at present. If the pair continue its south-run below 200-day SMA, the 1.4000 psychological magnet, encompassing 61.8% Fibonacci Retracement of its April – August up-move, becomes a strong support to limit the pair's further plunge. On the upside break of 1.4400 immediate resistance, mentioned by the ascending trend-line, negates the pair's recent breakdown and can pull it back to 1.4450-60 area before witnessing 38.2% Fibo, near 1.4590, followed by the 1.4660 resistances. Though, pair's further up-move beyond 1.4660 can be restricted by 1.4750 important resistance mark, comprising 50-day SMA and the said descending trend-line resistance. Moreover, a sustained break above 1.4750 can open the room for the pair's upward trajectory towards 1.5000 area.

GBPCAD


Ever since the GBPCAD surpassed 2.0100 horizontal mark, also including the 100-day SMA, it kept on trading between the 2.0300 and the 2.0100 area wherein the 2.0300, encompassing 23.6% Fibo of its April – August rally and two month old descending trend-line, limits the pair's up-move. If the pair surpasses the 2.0300 level on a closing basis, it can quickly rise to 2.0400 and the 2.0550-60 consecutive resistance while sustained trading above 2.0560 can enable the pair to aim for August highs of 2.0950; though, 2.0600 and the 2.0680 may act as intermediate resistances. Alternatively, a daily break below 2.0100 can be followed by the 2.0000 psychological magnet and the 38.2% Fibo, near 1.9880, before the pair can test 1.9760-50 important horizontal support area. If the pair dips below 1.9750, chances of its 1.9550 re-test, comprising 50% Fibo, can't be denied.

CADCHF


Following its reversal from two month old ascending trend-channel, the CADCHF managed to register a breakout above 200-day SMA; however, the said channel's resistance line, presently at 0.7610, limited the pair's further up-move while 200-day SMA level, around 0.7520 now, acts as an immediate support. Given the pair's inability to hold 200-day SMA, it could plunge to 50% Fibo of its April – August downside, near 0.7450. Moreover, a sustained downtrend below 0.7450 may find 0.7380 as an intermediate support before it could test the 38.2% Fibo, also including the channel support, near 0.7340, that can limit the pair's further downside. However, the pair's capacity to close above 0.7610 can strengthen the pair to aim for 0.7700 mark and the 76.4% Fibo, near 0.7740, breaking which chance of its rally to 0.7830 becomes brighter.


“Original analysis is provided by Admiral Markets
 
Technical Check: EURCHF, AUDCHF and GBPCHF

EURCHF


With the short-term descending trend-channel supporting EURCHF downside, the pair becomes more likely to test the 1.0750-40 important support confluence, encompassing 38.2% Fibonacci Retracement of its May – September advance, 100-day SMA and the lower line of the mentioned channel. However, the pair's break of 1.0740 on a closing basis can trigger its quick decline towards 50% Fibo level, around 1.0660, breaking which 1.0570, the 61.8% Fibo, is likely an intermediate support for the pair before it could test the 1.0500 multiple support area. On the upside, 1.0850 and 1.0870, including 23.6% Fibo, are likely immediate resistances for the pair before it could test the 1.0900 round figure mark, also comprising 50-day SMA and the channel resistance. Should the pair manage to surpass 1.0900 on a closing basis, chances of its 1.0950 and the 1.1000 psychological level can't be denied.

AUDCHF


Ever since the AUDCHF reversed from its August lows, the pair kept on marking the higher highs in a gradual manner; however, short-term "Rising-Wedge" resistance, that also includes 200-day SMA presently, around 0.7190 – 0.7200 area, can keep limiting the pair's up-move. Given the pair's pullback from the current levels, 0.7050 and the 38.2% Fibonacci Retracement Level of its March – August downside, at 0.7000 round figure mark, are likely immediate support levels that the pair could test. Moreover, a dip below 0.7000 can fetch the pair to the mentioned bearish formation support, near 0.6970, breaking which the pair becomes vulnerable to plunge towards 23.6% Fibo, near 0.6830 prior to targeting the 0.6700 mark. Alternatively, an upside break above 0.7200 on a closing basis can immediately propel the pair towards 0.7300 mark, surpassing which 0.7350 and the 76.4% Fibo, near 0.7450, are expected upside levels that the pair can aim for.

GBPCHF


Inability to surpass a year old descending trend-line resistance, also encompassing the upper-line of short-term ascending trend-channel, seems pulling the GBPCHF towards important support confluence, including 50-day and 100-day SMA together with the channel support, near to 1.4915 – 1.4900 area. If the pair break the 1.4900 on a closing basis, it could immediately drop to 1.4670 mark, comprising 76.4% Fibo of its January plunge. On a further downside below 1.4670, the pair can test 1.4500 round figure mark prior to test the 1.4250 support level. Meanwhile, a bounce from the important support, which is more likely, can have 1.5100 and the 1.5200 as consecutive resistances before witnessing the 1.5350-70 important resistance area, encompassing the channel upper-line and the descending trend-line. Given the pair's ability to surpass 1.5370, it becomes capable enough to target the 1.5550 mark, near to January highs.


“Original analysis is provided by Admiral Markets
 
Technical Update - EURUSD, GBPUSD, AUDUSD and USDCHF

EURUSD


Following a break below a short-term ascending trend-channel, the pair extended its downward trajectory and dropped below 1.0800 mark important support. From current levels the pair seems to continue drifting lower towards testing an intermediate support near 1.0650 level, marking a short-term descending trend-line support. However, considering that the daily RSI, reading below 30, has already dipped into oversold territory, the pair could possibly witness some short-covering bounce from 1.0650 support area. Any bounce-back is likely to confront immediate resistance at the 1.0800 support break-point, which if conquered could provide some additional momentum to lift the pair back above 1.0900 mark. However, considering the pair's break below a well-established short-term ascending trend-channel, any short-covering bounce is likely to be limited and the pair seems more likely to extend the near-term weakness towards testing its next major support near 1.0560-50 area.

GBPUSD


The pair continues to oscillate within a short-term descending trend-channel formation, visible on daily charts and the current reversal from the upper trend-line resistance could possibly drag the pair below 1.5000 important psychological mark support, towards testing the lower trend-line support of the channel, currently near 1.4950 level. On the upside, 1.5180-1.5200 horizontal zone now seems to provide immediate resistance, which is closely followed by an important resistance near 1.5250 region. A sustained strength above 1.5250 strong resistance has the potential to provide the required momentum to lift the pair back towards 1.5480-1.5500 important resistance area, also coinciding with the upper trend-line resistance of the channel. Intermediate resistance on the upside is pegged at 200-day SMA region, currently near 1.5340-50 area.

AUDUSD


Reversal from an important resistance confluence near 0.7370-80 area, comprising of 100-day SMA, a descending trend-line resistance and 50% Fib. retracement level of June to Sept. down-leg, dragged the pair close to retesting the very important 0.7000 psychological mark support. Sustained weakness below 0.7000 mark (0.7000-0.6980 support area) could increase the pair's vulnerability to continue drifting lower, initially towards 0.6900 mark support (earlier testing in Sept. 2015) and further towards testing sub-0.6800 level, represented by 61.8% Fib. expansion level. On the upside, 23.6% Fib. retracement level, also coinciding with 50-day SMA, near 0.7120-30 area now seems to act as immediate resistance on the upside. On a sustained strength back above 50-day SMA, could possibly be aiming back towards retesting the descending trend-line resistance, currently near 0.7330-40 area.

USDCHF


After breaking-through an important resistance near 0.9800 mark, representing a descending trend-line resistance extending through the beginning of 2015, the pair moved back to reclaim parity for the first time since March 2015. The pair is now within striking distance of retesting 1.0100-1.0120 resistance, highs tested in March this year. Should the momentum help the pair in decisively clearing March highs, it seems all set to extend its upward trajectory towards testing its next major resistance near 1.0280-1.0300 zone, marking 61.8% Fib. expansion level. Meanwhile on the downside, 0.9980-60 area seems to restrict immediate weakness. Failure to hold this immediate support could possibly trigger a short-term corrective move, initially towards 0.9820 level support, which could further get extended towards retesting the descending trend-line strong resistance break-point now turned support, currently near 0.9740-30 area. This 0.9740-30 support area might now act as near-term strong support for the pair.

Original analysis is provided by Admiral Markets
 
Technical Update - EURGBP, EURCAD, EURJPY and EURAUD

EURGBP


Although the pair has given-up majority of its gains registered from lows tested in July and August, it has managed to hold a descending trend-line support on daily chart. This descending trend-line support along-with another descending trend-line seems to constitute towards formation of a bullish reversal, Falling Wedge chart pattern. The pattern, however, is confirmed only once the pair decisively strengthens above the upper descending trend-line resistance, currently near 0.7110-15 area. Hence, sustained strength above 0.7100 mark resistance would confirm the bullish formation, thus paving way for further near-term appreciating move towards its next major resistance near 0.7240-50 horizontal area. Meanwhile on the downside, the lower descending trend-line, currently near 0.7020-0.7000 mark, might continue to provide immediate support. Failure to hold this immediate strong support, thus negating the bullish chart-pattern, might now open room for extension of the near-term descending trend, initially towards 0.6950-40 intermediate support and eventually towards testing 0.6830-20 support area, marked by 61.8% Fib. expansion level.

EURCAD


On daily chart, the pair has clearly broken below a descending triangular formation support, also coinciding with 38.2% Fib. retracement level of April to August upswing. The pair is currently hovering around 1.4300 mark, representing 50% Fib. retracement level. From current levels the pair seems to resume its near-term downward trajectory towards retesting 200-day SMA support, currently near 1.4110-1.4100 mark, which if broken has the potential to drag the pair further towards testing sub-1.4000 psychological mark support, coinciding with 61.8% Fib. retracement level. Alternatively, should the pair continue holding above 1.4300 mark and manages to strengthen back above 1.4350-70 resistance area, it seems to extend the bounce back towards 1.4500 round figure mark resistance. The bounce could further get extended towards retesting the horizontal support break-point, turned strong resistance, near 1.4590-1.4600 area.

EURJPY


The pair remains within a well-established short-term descending trend, as depicted by a descending trend-channel formation on daily chart. The pair is currently holding 23.6% Fib. retracement level support near 131.60-50 area below it is likely to accelerate the fall immediately towards testing the lower trend-line support of the descending channel, currently near 130.50-30 area. On the upside, 133.00 round figure mark seems to have emerged as immediate strong resistance. This is closely followed by another resistance near 133.50-70 horizontal zone. Sustained strength above 133.00 mark, leading to a move above 133.50-70 resistance area, is likely to set the stage for extension of the near-term upward trajectory back towards 135.00 psychological mark resistance, coinciding with 38.2% Fib. retracement level of Dec. 2014 to April 2015 downfall.

EURAUD


The pair on Thursday dropped to its lowest level since August 11 and is currently trading below 50% Fib. retracement level of April to August 2015 up-move. Moreover, on daily chart the pair has decisively broken below a short-term descending trend-channel, thus making it vulnerable to continue drifting lower towards testing its next major support confluence near 1.4800 mark, comprising of 61.8% Fib. retracement level and 200-day SMA. Meanwhile on the upside, a sustained strength above 1.5140-50 area might now confront a strong resistance at the descending trend-channel support break-point now turned immediate strong resistance, currently near 1.5250 region. Only a decisive strength back above 1.5250 strong resistance might negate the near-term bearish expectations. However, considering the pair's decisive break below a descending trend-channel, it seems more likely to remain vulnerable to continue drifting lower in the near-term.


“Original analysis is provided by Admiral Markets
 
Technical Check - Important JPY Pairs

USDJPY


In the short-term, the pair clearly seems to be trending up as depicted by an ascending trend-channel formation on 4-hourly chart. The pair, however, seems to face immediate resistance near 123.50 region, which if conquered is likely to set the stage for continuing the pair near-term upward trajectory towards testing the upper trend-line resistance of the channel, currently near 124.60-70 zone. Alternatively, failure to clear its immediate hurdle and a subsequent drop below 123.00 round figure mark immediate support seems to drag the pair back towards testing the lower trend-line support, currently near 122.60-50 area. Further, decisive weakness below 122.50 support, marking a break below the ascending trend-channel, now seems to trigger a fresh leg of corrective move, possibly towards 121.50 important support, marking 38.2% Fib. retracement level of its up-swing from Oct. lows to Nov. highs.

EURJPY


Extending its near-term weakness within a descending trend-channel formation on daily chart, the pair has now moved closer to its historic support near 131.00 round figure mark. Weakness below 131.00 mark might continue finding support at the lower trend-line support of the descending channel, currently near 130.30-25 area. Decisive break below the descending trend-channel support now seems to open room for an accelerated and continuous downfall towards testing its next major support near 127.20-127.00 mark in the near-term. Meanwhile, a bounce from current support area is likely to face immediate resistance near 132.30-50 horizontal zone. This is followed by another strong horizontal resistance near 133.50 region and a decisive break-through this strong resistance is likely to extend the bounce from important support, initially towards 135.00 psychological mark resistance and eventually towards testing the upper trend-line resistance of the channel, currently near 136.50-60 area.

AUDJPY


Although on short-term chart, the pair is oscillating within an ascending trend-channel formation on daily chart, it is yet to clear 100-day SMA important resistance, currently near 88.00 mark. A break-out move above 100-day SMA, for the first time since early July, has the potential to continue boosting the pair in the near-term, initially towards 89.50-70 intermediate resistance before heading towards testing the upper trend-line resistance of the ascending trend-channel, currently near 90.50-60 zone. Meanwhile, failure to conquer 100-day SMA resistance and reversal back below 87.30-25 immediate support seems to find support at the lower trend-line support of the channel, currently near 86.80-70 level. Further, a decisive weakness below the ascending trend-channel is likely to drag the pair back below 50-day SMA support (currently near 86.20-15 area) towards testing an important support near 84.60-50 region.

GBPJPY


After managing to hold an important support near 180.60-40 area, the pair, on 4-hourly chart, has moved within a short-term ascending trend-channel formation. The pair is currently trading close to its immediate resistance near 187.50 level, which if cleared is likely to provide the required momentum towards testing the upper trend-line resistance of the short-term ascending trend-channel, currently near 188.60-70 area. Meanwhile on the downside, 187.00 mark could provide some intermediate support for the pair but immediate strong downside support now seems to have emerged near 186.20-186.00 area. Failure to hold 186.00 mark support could easily drag the pair towards testing the lower trend-line support of the channel, currently near 185.30-20 area. Further, a decisive weakness below the ascending channel, might now trigger resumption of the near-term downward trajectory back towards 182.50 important support, with 184.00 round figure mark acting as intermediate support.


“Original analysis is provided by Admiral Markets
 
Technical Overview: Important CAD Pairs

USDCAD


Failure to break the short-term ascending trend-channel support triggered the USDCAD advance to the highest level in more than six weeks; though, the pair couldn't surpass the 1.3360-70 horizontal resistance, including August highs, and is currently trading negatively around 1.3300 round figure mark. Should it close below the mentioned support, chances of its quick decline to 1.3200 and the channel lower-line, around 1.3180 presently, become brighter. However, a break below 1.3180 is likely to be capped by 1.3100 – 1.3090 important support region, including 100-day SMA, six month old ascending trend-line support and 23.6% Fibonacci Retracement of its May – September up-move. On the upside, a clear break above 1.3370 is likely to be followed by last month high of 1.3456 while further advances beyond previous high can be confined by the channel resistance, around 1.3500 round figure mark. Moreover, a sustained break above 1.3500 could find multiple resistances between 1.3600 – 1.3610 resistance area.

EURCAD


Ever since the EURCAD reversed from 1.4900, it kept the declines running and tested the four month's low during last week; however, the support-line of a "Falling-Wedge" bullish formation restricted the pair's further downside. Though, inability to surpass 1.4385 – 1.4400 resistance area again pulled the pair back and is currently indicating the re-test of 1.4120-15 important support, including 200-day SMA and the mentioned lower-line of the formation. Should the pair breaks 1.4120 on a closing basis, it can immediately plunge to 1.4000 – 1.3985 support region, including 61.8% Fibonacci Retracement of its April – August rally. Moreover, an extended decline below 1.3985 can make the pair vulnerable enough to test 1.3800 multiple support-zone. Alternatively, 50% Fibo level, around 1.4300 round figure mark and the 1.4385 – 1.4400 resistance area can limit the pair's immediate advance while a break of 1.4400 can strengthen the pair towards witnessing 1.4500 and the 1.4580-85 level, encompassing 38.2% Fibo, before it could aim for 1.4640-50 which comprises of the 50-day SMA and the resistance line of the bullish formation. Moreover, a closing break of 1.4650 confirms the bullish chart pattern and can fuel the pair's rally towards 1.4900 area.

GBPCAD


Although the 23.6% Fibonacci Retracement of April – August advance restricts the immediate rise of GBPCAD, the 2.0180 – 2.0200 support confluence, including 50-day and 100-day SMA, limits the pair from falling down at present. Considering the comparative weakness of the CAD and repeated tests to the Fibonacci resistance, around 2.0300, the pair is more likely to advance towards 2.0400 on a close above 2.0300 while an extended up-move beyond 2.0400 can trigger the pair's rally towards 2.0550-60 horizontal resistance region. Meanwhile, a close below 2.0180 can quickly pull the pair to 2.0080 and to the 38.2% Fibo, near 1.9900 level and failure to hold 1.9900 may further weaken the pair to test 1.9765-80 major support area.

CADJPY


Following its dip to the lowest levels in more than three years, during late August, the CADJPY kept rising in a gradual manner; though, the highs marked portrays a bearish technical formation called "Rising-Wedge" and a break below 91.50 pattern support, also including the 50-day SMA, could confirm the pair's quick decline to 90.60, 23.6% Fibonacci Retracement of its June – August downside. Should the pair maintains the decline intact below 90.60, the 89.85 – 90.00 support-area is likely an intermediate rest during the pair's downward trajectory towards 88.80-75 horizontal support. Moreover, a sustained downtrend below 88.75 can make the pair vulnerable to re-test August lows, around 87.30. On the flipside, a successive advance can find 93.25-30 as immediate resistance prior to testing the formation resistance and the 50% Fibo, around 94.20 – 94.30, while a sustained break of which negates the bearish formation and can fuel the pair to 96.00 resistance, including 61.8% Fibo with 95.30 acting as intermediate resistance.


“Original analysis is provided by Admiral Markets
 
Technical Traits Of USDCHF And GBPCHF

USDCHF


Following its sustained break above 1.0080 – 1.0100 important resistance confluence, encompassing upper-line of the ascending trend-channel and horizontal-line stretched since January, the USDCHF seems accelerating its advance to 1.0215-20 resistance area prior to aiming for the 61.8% FE of its January lows to March highs, around 1.0300 round figure mark. Should the pair manage to surpass 1.0300 on a closing basis, chances of its test to August 2010 highs, above 1.0620, become brighter. On the downside, a daily close below 1.0080 negates the pair's recent break and can pull it back to 0.9980 and the 0.9950 downside levels, breaking which 0.9820-10 horizontal-line becomes strong support to limit the pair's further decline. Given the pair fails to hold 0.9810, also closes below 0.9800 mark, chances of its near-term advance gets negated and the pair becomes vulnerable to test 0.9670-50 multiple support area.

GBPCHF


On Tuesday, the GBPCHF surpassed it August highs and marked fresh high since January, indicating further up-move towards 61.8% FE of its May low to August high, around 1.5515; however, 1.5540-50 area, including multiple highs marked during January, may limit the pair's further upside. Given its ability to surpass 1.5550 on a closing basis, the February 2011 highs, around 1.5700, is likely an intermediate resistance before the pair could rally towards 1.6000 psychological magnet. Alternatively, a pullback from the current levels may witness 1.5360-50 as immediate support, breaking which steeply rising ascending trend-line support, near 1.5250, becomes an important support to consider. If the pair closes below 1.5250, it can quickly plunge to 1.51000 support-zone, breaking which 50-day and 100-day confluence, around 1.4985-70, is likely strong region to stop further declines by the pair.

“Original analysis is provided by Admiral Markets
 
Back
Top