Technical Analysis by Admiral Markets

Technical Update - GBPJPY, NZDJPY and NZDCAD
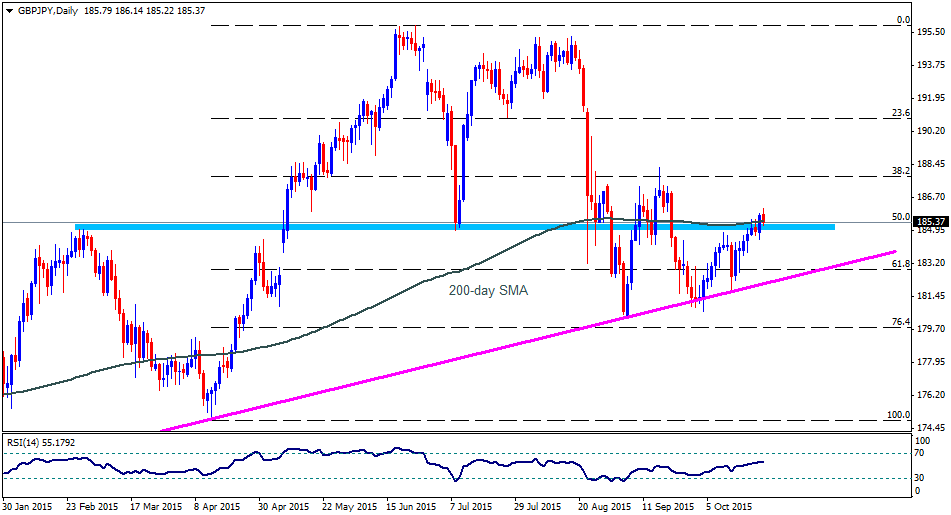
GBPJPY


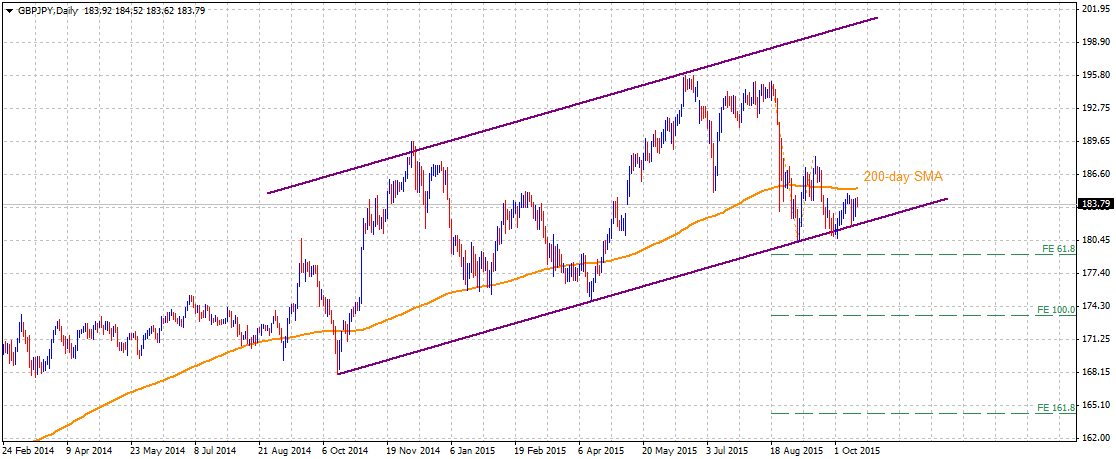
The pair continues to hold the lower trend-line support of a well-established ascending trend-channel formation on daily chart. However, rebound from the lower trend-line support, currently near 182.00 mark now seems to face strong hurdle at 200-day SMA region, currently near 185.00-20 area. A decisive strength back above 200-day SMA now seems to reaffirm the prospects of extending the bounce back towards 188.00 mark horizontal resistance. Alternatively, a decisive break below the lower trend-line support seems to immediately drag the pair below its immediate strong support near 180.70-50 area and also below 180.00 psychological mark towards testing 179.00 mark support. Moreover, the break below the ascending trend-channel, held since the last quarter of 2014, is likely to increase the pair's vulnerability to continue drifting lower in the near-term.

NZDJPY


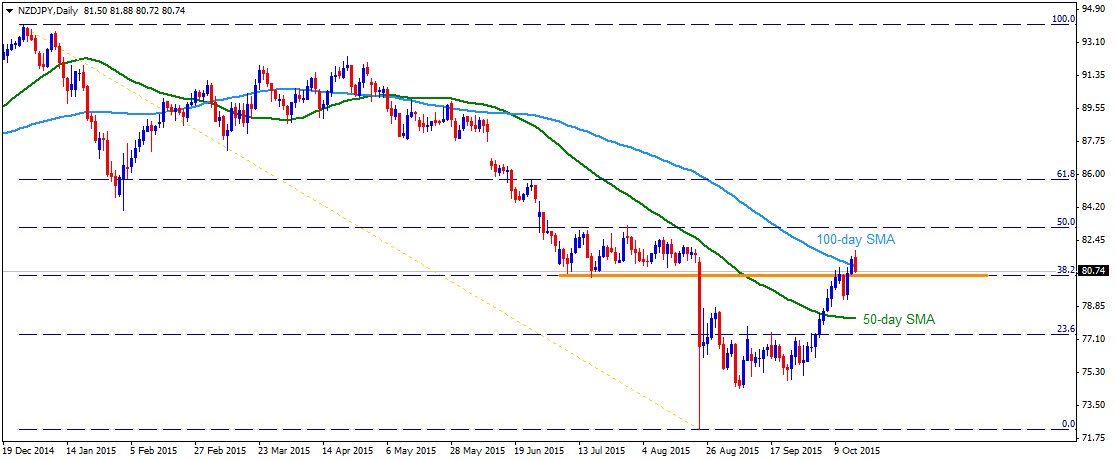
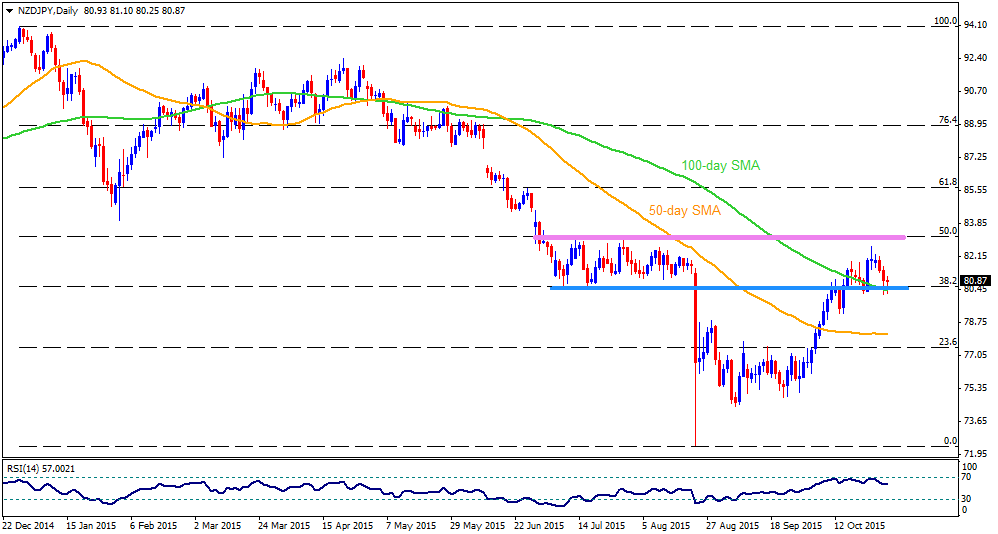
The pair's recovery momentum from its lowest level since Jan 2013 lifted the pair beyond 50-day SMA for the first time since May 2015. The pair subsequently cleared an important resistance near 80.50 level marking 38.2% Fib. retracement level of Dec. 2014 to Aug. 2015 down-fall. The pair, however, is now facing difficulty in sustaining its strength above 100-day SMA and now seems to be headed back to 80.50 resistance turned immediate support level. Should the pair fail to hold this immediate support, it could possibly be headed back towards testing 79.30-20 horizontal support, which now seems to have emerged as important downside support for the pair. Meanwhile, rebound from 80.50 support area and (or) a sustained strength above 100-day SMA region, near 81.00 mark, now seems to open room for continuation of the near-term upwards trajectory towards its next major resistance near 83.00-10 area, marking 50% Fib. retracement level.
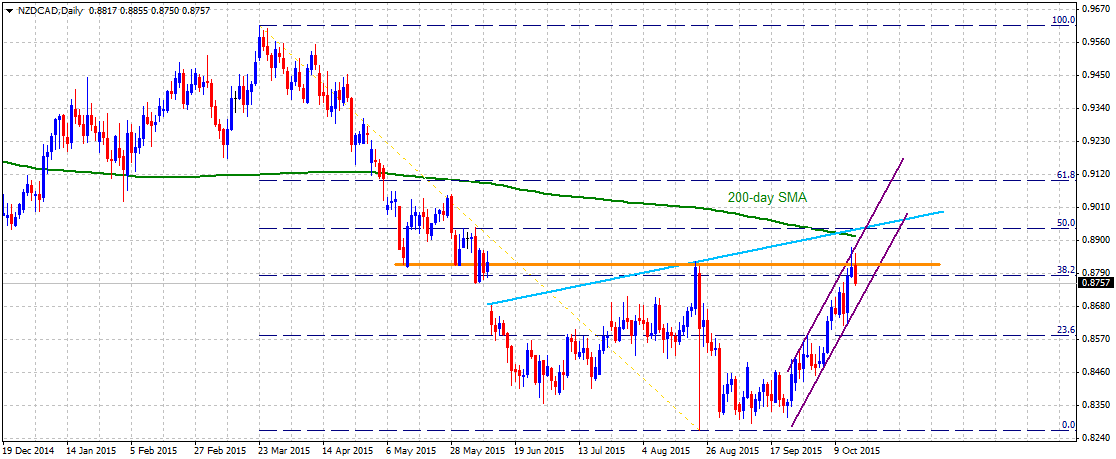
NZDCAD


Although on short-term chart the pair seems to move higher within an ascending trend-channel formation, but the momentum still failed to provide the required strength to conquer 0.8800-0.8820 previous support turned strong resistance area. From current level, the pair seems to extend its reversal from a strong resistance area towards its next major support near 0.8720-0.8700 area, marking the lower trend-line support of the channel. Failure to hold this immediate strong support seems to trigger renewed near-term weakness for the pair and drag it to retest sub-0.8600 level support, marked by 23.6% Fib. retracement level. Intermediate support is pegged near 0.8650 horizontal area. Meanwhile on the upside sustained strength above 0.8820 strong resistance now seems to pave way for extension of the near-term ascending trend, towards testing the very important resistance confluence near 0.8930-0.8950 zone. This strong resistance confluence comprises of 50% Fib. retracement level, an ascending trend-line resistance, the upper trend-line resistance of the channel and also nearing 200-day SMA.


“Original analysis is provided by Admiral Markets
 
Technical Overview - EURUSD, GBPUSD, USDCHF and USDCAD

EURUSD


Barring its unusually sharp up-move on Aug. 24, the pair has repeatedly failed to extend its strength beyond 1.1500 mark. However, on daily chart the pair now seems to have found an intermediate strong support near 1.1300 mark, representing 23.6% Fib. retracement level of May 2014 to March 2015 big fall. Moreover, on 1-hourly chart that pair has now decisively broken-through a descending trend-channel formation, suggesting a possible retest of 1.1400 round figure mark resistance. A follow-up strength beyond 1.1400 mark seems to assist the pair to move back towards 1.1480-1.1500 strong resistance. A subsequent strength above 1.1500 mark now opens room for continuing the near-term up-move towards 1.1600-1.1620 resistance area. Meanwhile on the downside, the descending trend-channel resistance break-point near 1.1350-40 area now seems to act as immediate support. This is followed by a strong support near 1.1300 mark. Failure to hold 1.1300 mark support is likely drag the pair immediately towards 1.1200 round figure mark intermediate support before aiming towards its next major support at 200-day SMA, currently near 1.1130 level.

GBPUSD


After conquering 200-day SMA, the pair is finding some intermediate resistance near 1.5500 psychological mark. A sustained strength above 1.5500 resistance is likely to extend the pair's near-term momentum but is likely to be restricted by a strong resistance confluence near 1.5570-80 zone. This 1.5570-80 resistance confluence comprises of the upper trend-line resistance of a short-term ascending trend-channel formation on daily chart and 38.2% Fib. retracement level of July 2014 to April 2015 depreciating move. However, a decisive strength this strong resistance confluence, marking a break-through the descending trend-channel, seems to pave way for continuing the near-term appreciating move further towards 1.5750-70 horizontal resistance with 1.5650-60 acting as intermediate resistance. Alternatively, should the pair starts reversing from 1.5500 mark resistance and drops below 1.5430-20 immediate support, it could possibly continue drifting lower towards retesting 1.5340-30 important resistance support, marked by 200-day SMA.

USDCHF


After failing to clear a descending trend-line strong resistance and a subsequent weakness back below 23.6% Fib. retracement level of Jan. to Mar. 2015 recovery, dragged the pair back below 0.9500 mark support, nearing the very important 200-day SMA. Sustained weakness below 0.9500 mark has the potential to drag the pair further towards testing its next important support confluence near 0.9380-70 area, comprising of 38.2% Fib. retracement level and an ascending trend-line support. Meanwhile, a move above 0.9500 mark now seems to confront immediate hurdle near 0.9570-75 area, which if cleared is likely to lift the pair back towards 23.6% Fib. retracement level support break-point, now turned resistance, near 0.9660 level. Furthermore, any follow-up strength above 0.9660 should continue to struggle in conquering the descending trend-line resistance, extending from Jan. high through highs tested in Mar., Aug. and Sept., currently near 0.9790-0.9800 mark.

USDCAD


Although the pair broke below 100-day SMA, it managed to rebound from 1.2850-30 support area, marking 38.2% Fib. retracement level of May to Sept. up-swing and also coincides with a short-term ascending trend-line support extending from lows tested in May and June 2015. The rebound lifted the pair back above 100-day SMA and the very important 1.3000 psychological mark. Should the pair manages to sustain its strength above 1.3000 mark, it could possibly make an attempt to test its next resistance near 1.3090-1.3100 mark, representing 23.6% Fib. retracement level. However, should the pair starts giving up its recent gains, it is likely to find immediate support at 100-day SMA, currently near 1.2920-25 area. This is closely followed by a strong support confluence near 1.2850 level, which if broken seems to open room for continuing the pair's near-term corrective move towards its next important support near 1.2680-60 area, marking 50% Fib. retracement level and also nearing the very important 200-day SMA.


“Original analysis is provided by Admiral Markets
 
NZDUSD, EURNZD, NZDJPY and AUDNZD: Technical Overview

NZDUSD


Ever since the NZDUSD managed to reverse from 0.6250 – 0.6235 horizontal support region, during late September, the pair kept following well orchestrated ascending trend-channel on its H4 chart. Though, pair's recent weakness to surpass the channel resistance, also marked by the short-term descending trend-line, presently near 0.6840, is likely limiting any further up-move, suggesting a pullback to 0.6780 horizontal support, quickly followed by the channel lower line, near 0.6760 mark. Should the pair fails to hold 0.6760, it can come down to 0.6735, including 23.6% Fibo of its September – October advance, breaking which 0.6640 and the 0.6580 are likely consecutive lower levels that it can witness during its extended downward trajectory. Meanwhile, a break above 0.6840 can trigger its immediate advance to current month high, near 0.6900 round figure mark while a sustained move beyond 0.6900 is likely to be capped by the channel resistance, near 0.6950 at present. Moreover, a closing break above 0.6950 may fuel the pair towards important descending trend-line resistance, connecting July 2014 highs to April 2015 highs, near 0.7100 level.


EURNZD


Following its failure to break 1.8000 psychological magnet, the EURNZD formed a descending trend-channel for nearly a month. During last weekend, the pair bounced from the channel support; however, it couldn't break 1.6770, needless to say the 1.6880 short-term important resistance, encompassing 100-day SMA and the 38.2% Fibo of its April – August up-move. The pair currently seems witnessing a pullback towards 1.6500 support area prior to visiting the 1.6300 crucial support that could limit its near-term downside, including 50% Fibo and the said channel lower line. Moreover, a sustained break below 1.6300 could open doors for the pair's plunge to 200-day SMA, near 1.5850. Alternatively, a break above 1.6880, can trigger the pair's run to 1.7000 round figure mark, also including the channel resistance, breaking which it could quickly rally to 1.7250 horizontal resistance.


NZDJPY


Break of 80.45-60 horizontal resistance, coupled with sustained trading above 100-day SMA, currently at 80.90, continue favoring the NZDJPY advance to 83.00 – 83.10 horizontal mark, including 50% Fibo of its December 2014 – August 2015 decline; though, recent highs, near 82.00, can act as intermediate resistance for the pair. Should it manage to break 83.10 on a closing basis, chances of its rise to 84.50 and the 61.8% Fibo, near 85.80 can't be denied. On the downside, a break below 80.90 SMA, can find 80.45-60 as important support. Should the pair dips below 80.45, it can immediately decline to 79.20 and to the 78.80 prior to visiting the 23.6% Fibo, near 77.50-40 area.


AUDNZD


Sustained trading below 1.0900 – 1.0880 horizontal support-turned-resistance, including 38.2% Fibo of its April – August rally, suggests the AUDNZD's extended downside towards another important horizontal support, near 1.0550 – 1.0560, encompassing 61.8% Fibo. If the pair breaks 1.0550 on a closing basis, it becomes vulnerable to plunge towards 76.4% Fibo, near 1.0350. On the upside, 50% Fibo, near 1.0720, seems restricting the pair's near-term up-move, breaking which 1.0825 can act as an intermediate resistance for the pair before it could rally to 1.0900 – 1.0880 mentioned resistance area. Moreover, an extended rise beyond 1.0880 can fuel the pair to 1.1000 and can ultimately signal 1.1080 – 1.1100 area, including 100-day SMA and 23.6% Fibo.


Original analysis is provided by Admiral Markets
 
Technical Check - EURCHF, CHFJPY, GBPCHF and AUDCHF

EURCHF


On short-term chart, the pair decisively weakened below an important support confluence near 1.0880 region, comprising of the lower trend-line support of a short-term ascending trend-channel formation and 50-day SMA support. Although, the pair seems to have found some intermediate support near 1.0800 round figure mark, but considering its break-down below an important support, it seems vulnerable to extend its near-term weakness towards testing 100-day SMA support, currently near 1.0700 level. On the upside, 1.0880-1.0900 zone, marking an important support break-point, now seems to restrict immediate upside for the pair. Failure to clear this immediate hurdle and a subsequent break below 1.0800 round figure mark support is likely to confirm the near-term bearish move for the pair. However, should the pair manage to conquer this immediate support turned resistance area, it seems to resume its recovery trend back towards 1.0990-1.1000 recent daily closing highs resistance, which could further get extended towards 1.1100-1.1120 resistance area in the near-term.

CHFJPY


Although the pair has decisively moved above a descending trend-channel formation on daily chart and has subsequently strengthened above 124.80-125.00 mark strong resistance confluence, comprising of 23.6% Fib. retracement level of June to Sept. down-fall and 50-day SMA, it has failed to gain momentum beyond 126.00 mark intermediate resistance. However, considering the break-out the pair seems more likely to extend its near-term recovery trend beyond 126.00 mark resistance towards testing its next major resistance near 128.40-50 area, nearing 50% Fib. retracement level. 38.2% Fib. retracement level, near 127.00 mark also seems to provide some intermediate resistance on the upside. Alternatively, should the pair decisively drops back below an important resistance confluence, turned immediate support, near 124.80-70 area, it seems to drift back towards retesting the descending channel break point (now turned support) near 123.50 level.

GBPCHF


The pair continues to hold and rebound from the very important 200-day SMA support near 1.4600 mark, also coinciding with 50% Fib. retracement level of May to August up-swing. It would be prudent to see if the repeated rebounds from an important support helps the pair to surpass a descending trend-line strong resistance, currently near 1.4880-1.4900 zone. A decisive break-through this immediate strong resistance might negate any near-term bearish expectations for the pair, immediately boosting the pair to reclaim 1.5000 psychological mark resistance, also coinciding with 23.6% Fib. retracement level. Meanwhile, 1.4700 mark seems to provide immediate downside support for the pair, which is followed by 1.4600 mark strong support. Failure to surpass immediate strong resistance and a subsequent break below a strong support now seems to trigger an accelerated downfall towards 61.8% Fib. retracement level support, near 1.4420-1.4400 mark.

AUDCHF


The pair failed to sustain its strength above 100-day SMA and started reversing from an important resistance confluence near 0.7090-0.7100 area, comprising of 50% Fib. retracement level of its fall from April to August 2015 and the upper trend-line resistance of a short-term ascending trend-channel formation on daily chart. Reversal from a strong resistance confluence dragged the pair back below 50-day SMA, towards testing the lower trend-line support of the channel, near 0.6860-50 area. Should the pair fail to bounce from the current support area, it is likely to immediately drop towards 0.6800 mark support, representing 23.6% Fib. retracement level, before heading towards testing its next major support near 0.6750 level. On the upside, 38.2% Fib. retracement level, near 0.6965-70 zone, seems to have emerged as immediate resistance. Although, up-move beyond this immediate resistance is likely to confront resistance at 100-day SMA region, currently near 0.7020 level, but would still reinforce near-term movement within the ascending trend-channel formation. Hence, a sustained move above 0.7000 mark seems to continue supporting further near-term up-move, initially towards 0.7100 mark resistance (50% Fib. retracement level) and eventually towards testing the upper trend-line resistance of the channel, currently near 0.7130 region.

"Original analysis is provided by Admiral Markets"
 
Technical Overview: GBPCAD, EURCAD, AUDCAD and CADJPY

GBPCAD


Following its bounce from 1.9750-30 important horizontal support, also including lower line of the "Falling-Wedge" bullish formation, the GBPCAD rallied towards the highest level in nearly three weeks; however, resistance line of the formation, coupled with 2.0100 – 2.0120 horizontal resistance, limited the pair's further advance. The pair now struggles between the 2.0100 – 2.0120 immediate important resistance and 100-day SMA support, presently at 2.0020. Though, considering the nearness to BoC meeting, chances are higher that the pair breaks the 2.0120 mark and could rise to 2.0440-50 resistance area. Should the pair manage to sustain its up-move beyond 2.0450, it becomes capable enough to challenge 2.0550 and the 2.0700 upside levels prior to targeting the August highs of 2.0970. On the downside, a dip below 2.0020 can quickly pull the pair to 1.9860-50 support-zone, breaking which the mentioned 1.9750-30 and the formation support, currently at 1.9650 are likely important levels that could limit the pair's downside. Given the pair's inability to hold 1.9650, it becomes vulnerable to plunge towards 200-day SMA, near 1.9400 round figure mark.

EURCAD


Ever since the EURCAD reversed from August highs of 1.5560, the 1.5100 – 1.4580 rectangle formation keep restricting the pair's move. The pair recently tested the range support and has bounced to 1.4815 immediate resistance. Should it manage to extend its pullback above 1.4815, it could test the 1.4900 round figure mark prior to targeting 1.4960, the 23.6% Fibo of its April – August rally. Further, subsequent up-move beyond 1.4960 by the pair is likely being tamed by the 1.5100 range resistance, breaking which chances of its run to 1.5430 can't be denied. Alternatively, the 1.4650 and range support, near 1.4580, also encompassing the 38.2% Fibo, are likely nearby supports that the pair should test. If the pair fails to stop its downturn near 1.4580, chances of its quick decline to 1.4490-80 horizontal resistance-turned-support becomes brighter. Moreover, a clear break below 1.4480 may open room for the pair's plunge to 50% Fibo, near 1.4300 round figure mark and then to the 200-day SMA, near 1.4100 support area.

AUDCAD


Although short-term ascending trend-channel keep favoring the AUDCAD advance, the pair recently reversed from the confluence of 200-day SMA and channel resistance and plunge below the 0.9430 – 0.9400 broad support region. From the current moves, it is more likely that the pair can test 23.6% Fibo of its January – September decline, near 0.9360 before testing the channel support, near 0.9300 psychological level. Should the pair fails to hold 0.9300 mark, it can quickly come down to 0.9240 and the September lows, near 0.9150 support levels. On the upside, a reversal from the current level should close above 0.9430 in order to aim at 38.2% Fibo, near 0.9500 mark, breaking which 200-day SMA, near 0.9575 and the channel resistance, currently near 0.9615, that also includes 50% Fibo, are likely important upside levels that the pair traders need to seriously observe.

CADJPY


Irrespective of the CADJPY's genuine observance to three month old descending trend-line, the 50-day SMA, near 91.50 at present, could continue limiting the pair's downside. If the pair breaks the 91.50 on a closing basis, the 23.6% Fibo of its June – August decline, near 90.60, and the 90.00 psychological magnet are important support levels that could restrict the pair's downturn before it could test the 88.85 – 88.80 horizontal support. Meanwhile, the said descending trend-line and the 38.2% Fibo, near 92.70-75 area becomes immediate important resistance for the pair to break to witness 93.30 and the 50% Fibo, near 94.30. Moreover, pair's ability to surpass 94.30 on a closing basis can direct the pair's upward trajectory towards 96.00 round figure mark.


“Original analysis is provided by Admiral Markets
 
Technical Update - AUDUSD, EURAUD, AUDJPY and GBPAUD

AUDUSD


After failing to conquer an important resistance confluence near 0.7370-80 area, comprising of 100-day SMA, a descending trend-line and 38.2% Fib. retracement level of May to Sept. 2015 down-leg, the pair dropped back below 0.7200 mark to nearly test 50-day SMA immediate important support. The pair has managed to recover from sub-0.7200 level and is currently holding comfortably above 0.7200 mark, representing 23.6% Fib. retracement level. Should the pair start trading back below 0.7200 mark and subsequently decisively weaken below 50-day SMA support, currently near 0.7150 level, it seems vulnerable to extend the weakness towards retesting a very important support near 0.7050-40 area. Alternatively, should the pair manages to extend its bounce beyond 0.7250 immediate resistance, it could possibly be aiming back towards retesting the descending trend-line resistance, currently near 0.7330-40 area, which also coincides with 100-day SMA. Further, a decisive break-through this important resistance now seems to set the stage for extending the pair's near-term recovery towards testing its next major resistance near 0.7500 mark, nearing 50% Fib. retracement level.

EURAUD


The pair's rebound from the lower trend-line support of a short-term descending trend-channel now seems to face strong resistance around 50-day SMA region, currently near 1.5750 level. Reversal from an intermediate support and a subsequent weakness below 1.5620-1.5600 immediate horizontal support is likely to continue dragging the pair, initially towards 1.5490-80 support (38.2% Fib. retracement level of April to August up-swing) and eventually towards retesting the lower trend-line support of the channel, currently near 1.5380-70 zone. Meanwhile on the upside, 50-day SMA might continue to act as immediate resistance, which if conquered is likely to lift the pair immediately towards testing 23.6% Fib. retracement level resistance near 1.5900 round figure mark. The up-move could further get extended, even beyond 1.6000 psychological mark resistance, towards testing the upper trend-line resistance of the channel, currently near 1.6050-60 area.

AUDJPY


On 4-hourly chart, the pair seems to extend its near-term recovery mode within a well-established ascending trend-channel. Following a test of the upper trend-line resistance of the channel, the pair reversed some of its gains and is currently hovering around 50-day SMA support, near 0.8620-0.8600 zone. On a sustained weakness below 50-day SMA, the pair seems to extend the reversal back towards testing the very important lower trend-line support of the channel, currently near 84.70-60 zone. On the upside, 87.00-87.20 area seems to have emerged as immediate resistance and a sustained move back above 87.00 mark is likely to continue extending support for extension of the near-term recovery move towards testing the upper trend-line resistance of the channel, currently near 89.00 mark, also near 100-day SMA resistance.

GBPAUD


Although the pair managed to rebound from 38.2% Fib. retracement level support and move back above 100-day SMA, but it is yet to decisively clear an important resistance near 2.1450-70 region, marking 23.6% Fib. retracement level. Should the pair fail to conquer this immediate resistance and starts drifting lower, it would point towards formation of a bearish Head and Shoulders chart-pattern. The pattern, however, will be completed only once the pair decisively weakens below 2.0800 descending trend-line support, forming neck-line support of the bearish pattern. From current levels, 2.1330-10 horizontal area, followed by 100-day SMA near 2.1135-30 area, seems to act as immediate support levels on the downside. Alternatively, should the pair manages to clear 2.1450-70 strong resistance, thus negating the bearish pattern formation, it seems to immediately rally towards 2.1780-2.1800 area immediate horizontal resistance.


“Original analysis is provided by Admiral Markets
 
Technical Update: EURJPY, GBPJPY and EURGBP

EURJPY


Repeated failures to break four month old descending trend-line, coupled with dovish statement from ECB, seems pulling the EURJPY towards 133.20 – 133.00 horizontal support region; though, a break below which becomes less expected as next week's BoJ could weaken the JPY and may provide a bounce to the pair. On the upside, 200-day SMA, presently near 134.50, is likely immediate resistance for the pair, breaking which 38.2% Fibonacci Retracement of its April – June rally, near 135.30, and the mentioned descending trend-line resistance, currently at 136.50, can possibly limit the pair's consecutive up-move. Further, pair's ability to manage a closing break above 136.50, could immediately trigger its advance towards 23.6% Fibo, near 137.50 and ultimate rise to August highs, around 139 psychological level. Meanwhile, a close below 133.00 can be followed by the 132.20 and the 61.8% Fibo level of 131.80 while sustained trading below 131.80 can make the pair vulnerable enough to plunge towards sub-130.00 region.

GBPJPY


Following its bounce from a year old ascending trend-line support, presently near 182.10 – 182.00 area, the GBPJPY managed to surpass the 185.00 – 185.30 important resistance region, encompassing 200-day SMA and 50% Fibo of its April – June rally; however, failure to sustain a tick above 186.00 seems pulling the pair back to 185.30 – 185.00 zone. Given the pair's inability to hold 185.00, it can come down to 183.60-50 support-zone and then to 183.00 round figure mark, including 61.8% Fibo, before testing the said trend-line support at 182.10 – 182.00. Moreover, extended declines below 182.00 can further weaken the pair to test 76.4% Fibo, near 179.70. Alternatively, sustained trading above 186.00 signals the pair's march to 187.30 and the 38.2% Fibo, near 187.80. If the pair surpasses 187.80, chances of its rally to 189.00 and the 23.6% Fibo, near 191.00 round figure mark can't be denied.

EURGBP


On Thursday, the EURGBP extended its declines below 0.7300 area and confirmed the "Rising-Wedge" bearish technical formation; however, the 23.6% Fibo of its November 2014 – July 2015 decline and 100-day SMA, near 0.7190 - 0.7215 seems restricting the pair's immediate moves. Should the pair closes below 0.7190, it can extend the downtrend to 0.7110 – 0.7100 intermediate support area prior to testing the 0.7000 psychological magnet. Moreover, a daily close below 0.7000 can make the pair vulnerable enough to look for 0.6800 region test. On the upside, a tick above 0.7215 can be restricted by the 200-day SMA, near 0.7250, breaking which 0.7300 round figure mark and the 38.2% Fibo, near 0.7350, are likely consecutive resistances that it could witness during successive up-move. Though, 0.7450-60 horizontal area becomes strong upside resistance to limit the pair's rise beyond 0.7350.


“Original analysis is provided by Admiral Markets
 
Technical Outlook: EURUSD, GBPUSD, USDCAD and USDCHF

EURUSD


Failure to break 1.1470-90 important horizontal resistance, coupled with dovish comments from ECB President, dragged down the EURUSD towards breaking 200-day SMA and seven month old ascending trend-line support during last week. However, the pair bounced back from its 1.1000 round figure mark on Monday and is currently struggling to regain the trend-line support at 1.1060. Should the pair manage to close above 1.1060, the recent break can be negated; though, 200-day SMA, presently near 1.1125-30, can limit its immediate advance. On a further up-move beyond 1.1130, the pair can quickly rise to 38.2% Fibo of its December 2014 – March 2015 decline, near 1.1250, and to the 1.1390 – 1.1400 resistance region before targeting the 1.1470-90 re-test. Given the pair's ability to surpass 1.1490, also tick above 1.1500, chances of its rally towards 1.1630 and to the 61.8% Fibo, near 1.1730 can't be denied. Meanwhile, 1.1000 can act as an immediate downside support for the pair, breaking which 23.6% Fibo, near 1.0940, and the 1.0830-20 horizontal mark, are likely consecutive levels that the pair could witness during its successive decline. Moreover, inability to hold 1.0820 could make the pair vulnerable enough to plunge towards 1.0600 support-area.

GBPUSD


Even if the GBPUSD decisively strengthened above 200-day SMA, the follow-up advance found it difficult to break the 100-day SMA, also including short-term descending trend-line resistance, near 1.5500 round figure mark. The pair currently trades near 200-day SMA at 1.5330 and a closing break of the same can quickly pull it back to 50% Fibo of its April – June rise, near 1.5250, prior to witnessing 1.5170 and the 1.5090 – 1.5100 horizontal support. However, pair's consecutive declines below 1.5090 are likely to be restricted by the four month old descending trend-channel support, near 1.5000. Alternatively, 38.2% Fibo, near 1.5400, followed by the 1.5500 resistance, encompassing 100-day SMA and said trend-line, are likely nearby resistances that the pair could witness before rallying to the 1.5530 channel resistance. Given the pair's ability to close above 1.5530, it can swiftly rise to 23.6% Fibo, near 1.5610, prior to targeting 1.5700 and the August high of 1.5820 level.

USDCAD


Ever since the USDCAD broke above 1.3070 horizontal resistance-turned-support-mark, also including the 38.2% Fibo of its September – October decline, the pair kept trading northwards, with due respect to short-term ascending trend-channel; however, 61.8% Fibo, near 1.3220, can limit the pair's immediate advance. Should the pair breaks above 1.3220, it can easily test the 1.3265-70, channel resistance area, breaking which 76.4% Fibo, near 1.3300 round figure mark, and 1.3355-60, are likely consecutive upside resistances that it could witness during sustained up-move. On the downside, 50% Fibo level at 1.3140 and the channel support, near 1.3100 psychological level, are likely supports to restrict the pair's near-term decline. Given the pair's inability to hold 1.3100 on a closing basis, the 1.3070 horizontal support again comes into picture to save the pair while a closing break of which can make the pair vulnerable enough to plunge towards 23.6% Fibo, near 1.2980-75.

USDCHF


Following its bounce from 200-day SMA, presently near 0.9530, the USDCHF managed to register successful rise. On Monday, the pair surpassed its year-long descending trend-line resistance and it now seems rallying towards the 0.9890 – 0.9900 horizontal resistance region, encompassing August highs. Should it breaks the mentioned 0.9900 level on a closing basis chances of its rally to 1.000 psychological magnet, followed by the March highs of 1.0130, can't be denied. However, a pullback from the current level can quickly witness the said resistance-turned-support-line, near 0.9770, and the 76.4% Fibo of its January plunge, near 0.9740. If the pair's pullback stretched longer and breaks 0.9740, the recent break gets negated and the pair can immediately plunge to 0.9650 and to the 0.9530, including 200-day SMA.


“Original analysis is provided by Admiral Markets
 
Technical Check – Important AUD Pairs

AUDUSD


Even if short-term descending trend-channel, formed after the pair's failure to break 100-day SMA, caused the AUDUSD decline below 50-day SMA, the 0.7100 round figure mark, also encompassing the channel support, seems currently restricting the pair's further decline. However, a pullback from current level has limited upside as 0.7200, followed by the channel resistance near 0.7265 and the important resistance confluence near 0.7320-30, including 100-day SMA and more than a yearlong descending trend-line, could limit the pair's near-term advance. Though, a decisive break-through this important resistance can set the stage for extending the pair's near-term recovery towards testing its next major resistance near 0.7500 mark, including 23.6% Fibonacci Retracement of its down-leg from September 2014 to September 2015. Meanwhile, a daily close below 0.7100 may find short-term ascending trend-line, around 0.7050-45, as immediate support, breaking which chances of the pair's fresh downside towards 0.6970 and the 0.6900 psychological level can't be denied.

EURAUD


Following its failure to break 1.6145-75 horizontal area, the EURAUD seems obeying the short-term descending trend-channel formation. The pair recently bounced from the mentioned channel support, also including 50% Fibo of its April – August rise, and is currently struggling near 38.2% Fibo level around 1.5500 round figure mark. Should the pair manage to break 1.5500 on a daily closing, it can swiftly move to 1.5650-60 resistance area prior to testing the channel resistance, near 1.5750 at present. Further, pair's ability to surpass 1.5750 on a closing basis can accelerate its rise towards 1.5900 level, including 23.6% Fibo, before targeting 1.6145-75 area. Alternatively, a daily close below 1.5500 can continue signaling the pair's test to 100-day SMA, presently near 1.5280, the 50% Fibo, around 1.5130, and re-test the channel support near 1.5100 level. However, pair's inability to hold the 1.5100 level can make it vulnerable to plunge towards 1.4800 region, near to 61.8% Fibo level.

AUDNZD


A month old descending trend-channel formation keep favoring the AUDNZD downside; however, the pair currently rests near 1.0550-60 important horizontal support, including 61.8% Fibo of its April – July surge, indicating a quick bounce to channel resistance, near 1.0700 mark. Should the pair breaks 1.0700, also surpasses the 50% Fibo, near 1.0720, it stretch northward journey towards targeting 1.0875 – 1.0890 horizontal resistance area, including 38.2% Fibo, with 1.0800 being intermediate resistance. On the downside, pair's attempt to break 1.0550 can find the lower line of the mentioned channel, around 1.0430, as a strong downside support to limit the pair's further decline, breaking which it can immediately plunge to 76.4% Fibo level, near 1.0350 before targeting 1.0200 support area.

AUDJPY


Having reversed from 87.80 – 88.00 resistance confluence, encompassing 38.2% Fibo of its June – September decline and a four month old descending trend-line, the AUDJPY currently trades near the 23.6% Fibo and a 50-day SMA area, signaling a bit of pullback into the pair prices towards 86.85 – 87.00 resistance region. However, pair's further rise beyond 87.00 is likely to be restricted by 87.70-75 level, including the said 38.2% Fibo and trend-line confluence. Should the pair manage to break 87.75 on a closing basis, chances of its quick up-run to 89.50, including 50% Fibo, becomes brighter; though 88.50 can act as intermediate resistance. On the other hand, pair's inability to hold 85.50, 23.6% Fibo, may find 85.00 round figure mark, including short-term ascending trend-line, as a strong downside support. Moreover, extended downturn below 85.00 can make the pair's test 86.30 mark.


“Original analysis is provided by Admiral Markets
 
NZDUSD, EURNZD, NZDCHF and NZDJPY: Technical Overview

NZDUSD


Inability to conquer 0.6900 mark, pulled the NZDUSD back to 0.6600 region, as aptly indicated by the short-term descending trend-channel; though, lower line of the channel, coupled with 38.2% Fibo of its September – October rally, near 0.6645, recently provided a bounce to the pair prices. During its short-term profit booking moves, the 0.6700 and 23.6% Fibo, near 0.6740, are likely upside levels that the pair could witness before targeting the channel resistance, presently near 0.6800 round figure mark. Should the pair manage to sustain 0.6800 break, chances of its quick rally to 0.6850 and 0.6900 can't be denied. Moreover, successful advance beyond 0.6900 may further extend the pair's northward trajectory towards 0.7030 resistance level. On the downside, clear break of 0.6645-50 support area can trigger the pair's fresh decline towards 0.6580 and 0.6530 consecutive supports before it can test the 0.6455-75 important horizontal support region. Given the pair's inability to hold 0.6455, it becomes vulnerable enough to plunge towards 0.6390 (76.4% Fibo) and 0.6330 levels.

EURNZD


With failed attempt to break the 1.6885 – 1.6900 resistance region, encompassing 100-day SMA and 38.2% Fibo of its April – August up-move, the EURNZD plunged to the lowest levels in more than three months; however, 1.6150-40 horizontal support limited the pair's further decline and is currently favoring its pullback rally towards 1.6590 – 1.6600 area. If the pair manage to stretch the recovery rally beyond 1.6600, the 1.6710 can act as a buffer for the pair's up-move towards 1.6885 – 1.6900 important resistance area. Moreover, successful break above 1.6900 on a closing basis can fuel the pair's rise to 1.7250-70 horizontal resistance that can act as strong resistance to limit northward journey. Alternatively, a downside break below 1.6140 can quickly pull the pair to 1.5890 – 1.5900 area, including 200-day SMA, breaking which 1.5700 mark, near to the 61.8% Fibo, may provide intermediate rest to the pair's decline prior to its plunge to 1.5400 support.

NZDCHF


Even if the NZDCHF manage to clear important descending trend-line resistance, stretched from January highs, the 200-day SMA, coupled with the short-term ascending trend-channel resistance, limited the pair's following up-move. Currently, 0.6560-55 can act as an immediate support for the pair, breaking which the previous-resistance-turned-support line and the channel support, around 0.6480-75, becomes an important support to determine the pair's further moves. Should it break the same level on a closing basis, chances of its renewed declines towards targeting 0.6300 mark, encompassing 23.6% Fibo of its January – August decline, becomes brighter. Meanwhile, pair's attempts to break 200-day SMA, presently near 0.6690, are likely to be capped by the 0.6750 level, including channel resistance. Given the pair's ability to surpass 0.6750, the pair becomes capable enough to target 0.6930 level with 0.6800 round figure mark being a buffer resistance.

NZDJPY


NZDJPY's reversal from 82.50-60 resistance area seems finding it difficult to break the 80.50-40 horizontal support, including 100-day SMA and 38.2% Fibo of its December 2014 – August 2015 down-leg. If the pair dips below 80.40, also clears the 80.00 psychological level on a closing basis, it can be considered weaker enough to decline towards 78.80 – 79.00 support region prior to testing 50-day SMA, near 78.10. On a further declines below 78.10 the pair can find multiple supports within 77.00 – 76.80 area. However, bounce from the current levels may witness 81.50 and 82.30 upside numbers before rising to 83.00 – 83.15 horizontal mark, including 50% Fibo. Given the pair's ability to surpass 83.15, it can quickly rise to 84.50-70 resistance area.


“Original analysis is provided by Admiral Markets
 
Back
Top