Technical Analysis by Admiral Markets

Technical Update - EURUSD, AUDUSD, USDCAD and NZDUSD

EURUSD


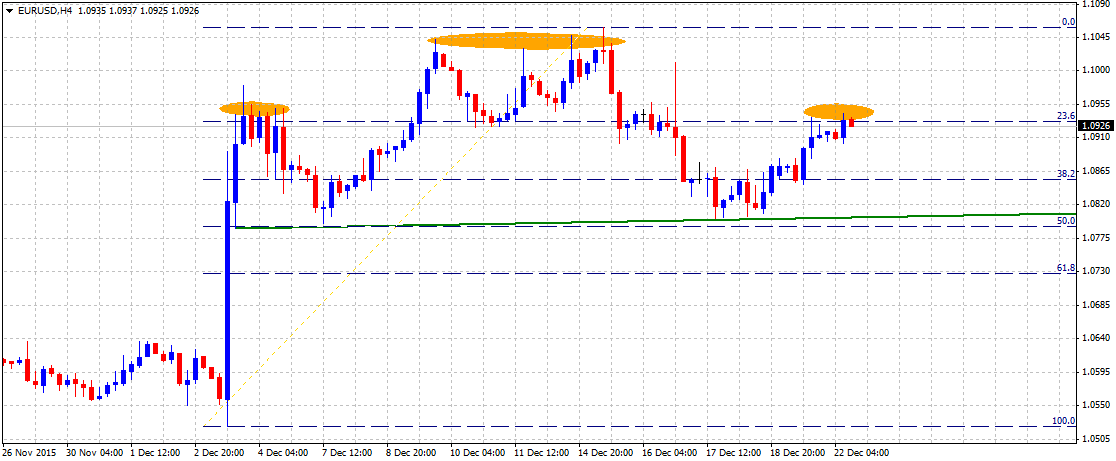
The pair managed to hold and rebound from 1.0800 mark, nearing 50% Fib. retracement level of its recent up-swing from Dec. lows to 1.1059 high touched on Dec. 15. On 4-hourly chart the pair now seems to confront immediate resistance near 1.0930-40 area, coinciding with 23.6% Fib. retracement level and the pair could possibly in the process of forming a bearish Head and Shoulders chart-pattern. The pattern, however, would take shape if the pair starts reversing from current level and would be confirmed only once it breaks below the very important 1.0800 mark support. From current levels, weakness below 1.0900 round figure mark is likely to find immediate support near 1.0860-50 zone, marking 38.2% Fib. retracement level. This is followed by the very important 1.0800 mark support, which if broken might now pave way for an immediate downfall towards 61.8% Fib. retracement level support near 1.0730 region. Meanwhile, a decisive strength above 1.0930-40 immediate resistance would negate the bearish pattern formation, clearing way for an immediate up-move towards its next major resistance near 1.1040-60 area, comprising of 100-day and 200-day SMA levels.

AUDUSD


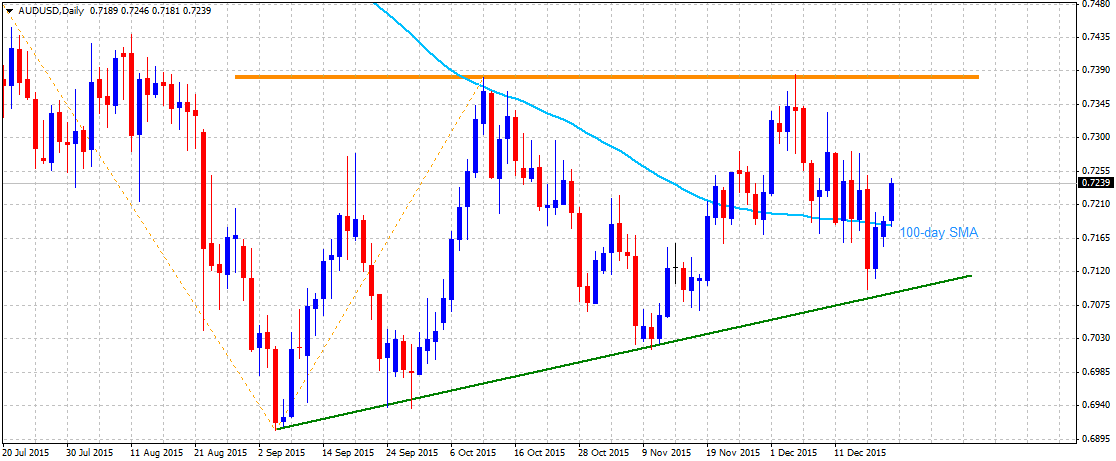
After failing to hold 100-day SMA support and subsequently retesting a short-term ascending trend-line support, currently near 0.7090-80 region, the pair rebounded sharply to move back above 100-day SMA. The pair is currently trading well above 100-day SMA and now seems all set to aim back towards testing the very important resistance near 0.7370-80 area. A sustained strength above this strong resistance is followed by another strong resistance at 200-day SMA, currently near 0.7430-40 zone. However, momentum above 0.7370-80 strong resistance, leading to a subsequent strength above 200-day SMA resistance, might now open room for further near-term recovery towards its next major resistance near 0.7550-60 area. On the downside, 100-day SMA (currently near 0.7180 level) might continue to act as immediate support, which is followed by an ascending trend-line support near 0.7100-0.7090 area. Only a decisive weakness below the ascending trend-line support might negate possibilities of any further recovery and increase the pair's vulnerability to drop back towards retesting its multi-year lows support near 0.6930-10 area.

USDCAD


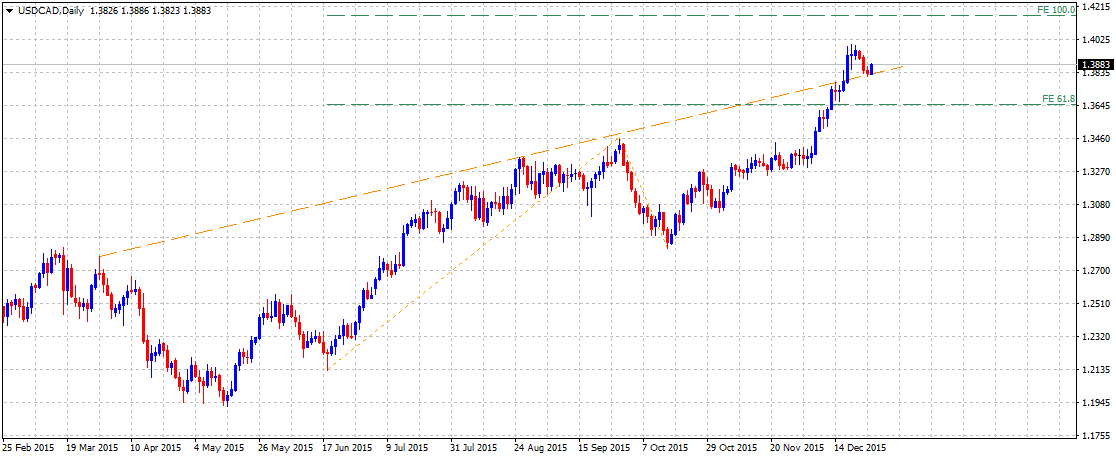
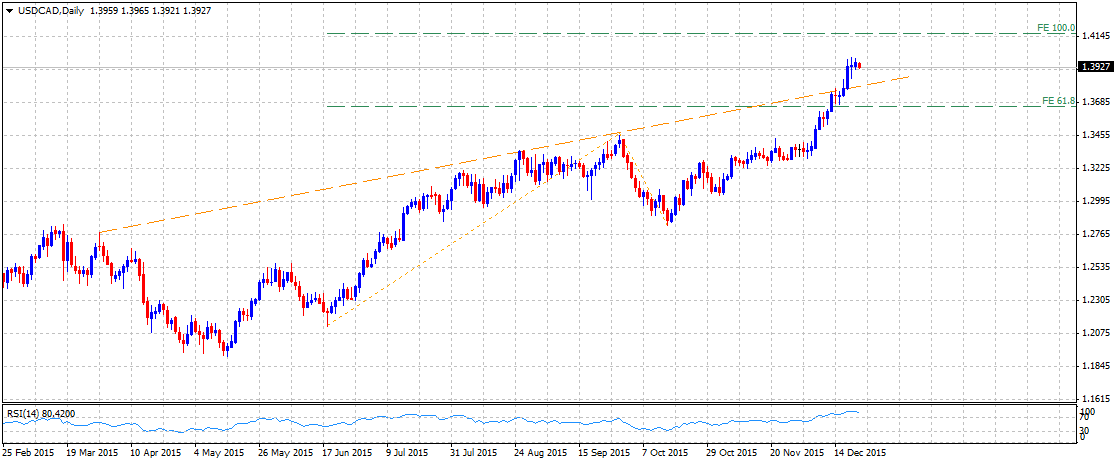
Extending its near-term upward trajectory to surpass 61.8% Fib. expansion level resistance near 1.3650 area and subsequently conquering an ascending trend-line resistance, the pair touched the very important 1.4000 psychological mark for the first time since May 2004. With RSI already reading above 80, suggesting near-term overbought conditions, the pair could possibly witness some profit taking from current levels. However, weakness below 1.3900 mark is likely to find immediate support at the ascending trend-line resistance break-point, near 1.3800 mark. Below 1.3800 mark support, the near-term corrective move could get extended towards 61.8% Fib. expansion level resistance turned support near 1.3650 level. Meanwhile on the upside, 1.4000 level remains immediate important psychological mark resistance to be cleared, which if conquered seems to continue boosting the pair towards 100% Fib. expansion level resistance near 1.4150-60 area.
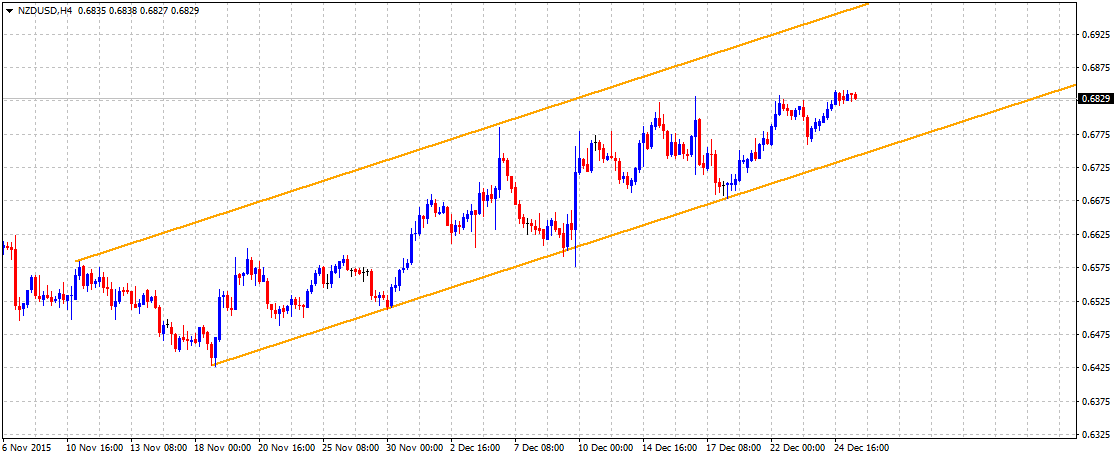
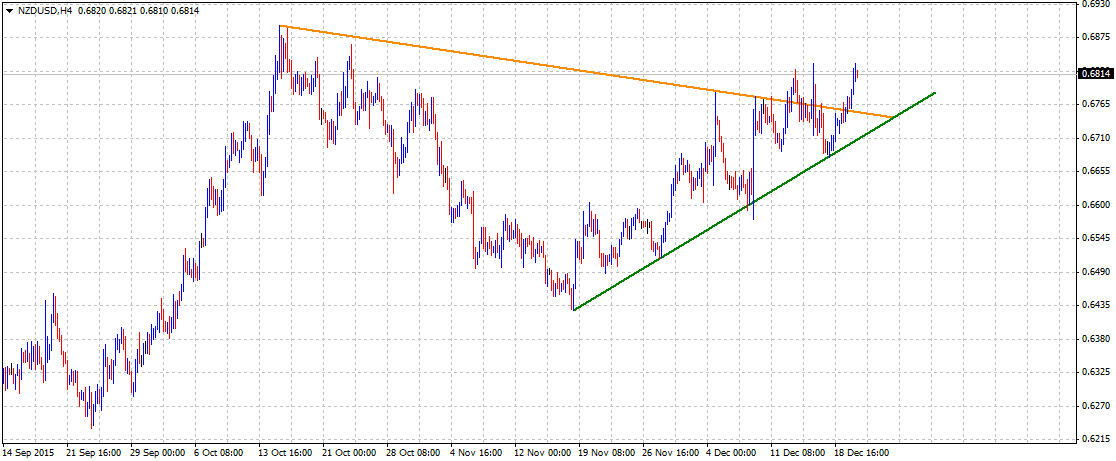
NZDUSD


The pair once again rebounded from a short-term ascending trend-line support to move back above 0.6800 mark. Subsequent strength above 0.6830 level seems to boost the pair immediate towards 200-day SMA resistance, currently near 0.6865-70 region. Further, momentum above 200-day SMA for the first time since August 2014 might now set the stage for extension of the pair's near-term upwards trajectory, initially towards 0.7000 psychological mark before heading towards its next major resistance near 0.7150-60 area. On the downside, a short-term descending trend-line resistance break-point, near 0.6750 level, closely followed by an ascending trend-line near 0.6700 mark, might continue to act as immediate support areas for the pair. Only a sustained weakness back below these immediate support regions and a subsequent weakness below 100-day SMA support near 0.6650 level might negate the near-term bullish outlook for the pair, dragging it back towards its next major support near 0.6450-40 area.


“Original analysis is provided by Admiral Markets
 
Technical Check: GBPAUD, GBPNZD, EURGBP And GBPJPY

GBPAUD


Reversal from a month old descending trend-line triggered fresh selling by the GBPAUD which forced the pair to dip below 2.0690-80 horizontal support and trade near 2.0560-50 support-area. Should it stretch the downward trajectory below 2.0550, chances of its quick plunge to December lows, near 2.0330 can't be denied. Moreover, on a sustain break of 2.0330, the pair becomes weaker enough to aim for 2.0060-50 support re-test; though, 2.0300 may become an intermediate support. Alternatively, pair's bounce from the current levels may find 23.6% Fibo level, near 2.0650, and the mentioned support-turned-resistance, around 2.0690, as consecutive immediate upside levels. However, a closing break above 2.0690 may fuel the pair to 2.0830, quickly followed by the 2.0860, 38.2% Fibo while a sustained trading above 2.0860 negates the chances of pair's near-term downside and can propel it towards 2.0960-70 resistance-area.

GBPNZD


Ever since the GBPNZD broke its 2.2400 – 2.2380 horizontal support (now acting as resistance), also encompassing 200-day SMA, the pair extended its decline towards testing the lowest levels in more than six months, favoring further downside to 2.1700 and the 61.8% Fibonacci Retracement of its April – August rally, near 2.1535-30. However, four-month old descending trend-channel support, near 2.1300 round figure mark, may stop the pair's further decline. Should it fail to hold 2.1300, chances of its plunge to 2.1070 and the 2.0900, gains more acceptance. On the upside, 2.2045-50, followed by the 50% Fibo, near 2.2235-40, are likely immediate resistances that the pair might aim during its reversal. If the pair manage to close beyond 2.2240, the 2.2380 – 2.2400 becomes an important resistance for the pair traders to watch, breaking which it can quickly rally to 2.2700 area prior to aiming the 38.2% Fibo, near 2.2930-35 mark and the mentioned channel's resistance-line, around 2.3100 mark.

EURGBP


After breaking 0.7170-75 horizontal resistance, the EURGBP managed to form short-term ascending trend-channel that favors the pair's advance; however, resistance-line of the channel, near 0.7350-55, followed by the 76.4% Fibonacci Retracement of its October – November downside, around 0.7370-75, may limit its further upside. Should the pair manage to clear 0.7375, chances of its accelerated upward trajectory towards 0.7445-50 and the 0.7500 round figure mark becomes brighter. Moreover, a sustained trading above 0.7500 may propel the pair to surpass February highs, around 0.7590, and test the 0.7600 psychological resistance level. Meanwhile, 61.8% Fibo, near 0.7300 – 0.7295 becomes an immediate downside support for the pair to break before it could test the 0.7250 channel support. Given the pair's sustained break of 0.7250, also dipping below 50% Fibo level of 0.7235, it can quickly test 0.7170 and the 0.7130 level during its consecutive south-run towards 0.7100, encompassing 23.6% Fibo, which might restrict the pair's additional decline.

GBPJPY


On Monday, the GBPJPY managed to break 180.40-60 important horizontal support and maintained its downturn during early Tuesday trading session, favoring a quick test to 76.4% Fibonacci Retracement of its April – June upside, near 179.80-75. During its further decline below 179.75, the pair could find 178.50 and the 176.60-50 supports before aiming for the April lows, near 174.80. However, bounce from the current levels, coupled with a closing break above 180.60 support-turned-resistance, can pave the grounds for the pair's recovery to 181.50 and the 182.50 prior to testing 61.8% Fibo, near 182.85-90 area. If the short-covering rally fuels the pair beyond 183.00, the 184.00 might act as an intermediate resistance during its successive up-move to 50% Fibo level of 185.40.


“Original analysis is provided by Admiral Markets
 
Technical Overview - EURAUD, AUDJPY, AUDNZD and AUDCHF

EURAUD


Following its sharp recovery from early December lows, the pair on 4-hourly chart is oscillating within a short-term descending trend-channel formation. This descending trend-channel along-with the pair's sharp up-move from Dec. lows seems to constitute towards formation of a bullish continuation, Flag chart-pattern. Should the pair manage to clear the upper trend-line resistance of the channel, thus confirming the bullish continuation formation, it seems to immediately dart towards Dec. highs resistance near 1.5340 level before making an attempt to test the very important 100-day SMA resistance, currently near 1.5400 round figure mark. On the downside, weakness below 1.5060-50 immediate horizontal support area might continue finding support at the lower trend-line of the descending channel, currently near 1.4960-50 zone. Failure to hold and rebound from the short-term descending trend-channel support might now drag the pair immediately towards 1.4800 round figure mark horizontal support ahead of depreciating further towards its next major support near 1.4700 mark.

AUDJPY


On short-term chart, the pair continues to remains within an ascending trend-channel formation and has reversed from a very important resistance confluence near 90.70-90.90 area, comprising of the very important 200-day SMA and the upper trend-line resistance of the channel. The pair has subsequently rebounded from the lower trend-line support of the channel and is currently hovering around 100-day SMA region. Should the pair continue holding above 87.20-87.00 zone, it seems to make a fresh attempt towards testing immediate horizontal resistance near 89.00 mark. The momentum could further get extended towards back towards the very important 200-day SMA resistance, currently near 90.40 region. Further, a sustained strength above 200-day SMA seems to open room for additional recovery, initially towards the upper trend-line resistance of the channel, currently near 91.60-70 zone, and eventually towards its next major resistance near 92.50-70 area. Alternatively, weakness below 87.00 mark is likely to find immediate support at the lower trend-line support of the channel, currently near 86.50 level. Decisive weakness back below the ascending trend-channel support might negate expectations of any further near-term recovery for the pair.

AUDNZD


Although, the pair rebounded from sub-1.0600 level, it remains in near-term downward trajectory as depicted by a short-term descending trend-channel formation on 4-hourly chart. Hence, any further up-move beyond 1.0650 level is likely to confront resistance at the upper trend-line resistance of the channel, currently near 1.0680-90 area. Meanwhile on the downside, weakness back below 1.0600 mark is likely to drag the pair immediately towards Oct. lows support near 1.0500-1.0490 region. Sustained break below 1.0500 mark is likely to accelerate the fall immediately towards its next major support near 1.0350 level, marking May 2015 lows and also nearing 61.8% Fib. expansion level support near 1.0635-40 area. Only a decisive break-through the descending trend-channel might negate the near-term bearish outlook for the pair.

AUDCHF


Although the pair has given up majority of its gains recorded during the month of Nov. but is has still managed to hold 50% Fib. retracement level support of August lows to Dec. high up-swing. The pair is currently trading close to a confluence region near 0.7150-60 area, comprising of 200-day SMA and 38.2% Fib. retracement level. Should the pair starts trading above this confluence area, is seems to aim directly towards testing its next major resistance near 0.7270-80 area, nearing 23.6% Fib. retracement level. Meanwhile, weakness below 0.7100 round figure mark might continue finding support at 50% Fib. retracement level near 0.7050-45 area. Failure to hold this immediate strong support and a subsequent break below 0.7000 psychological mark is likely to drag the pair back towards 61.8% Fib. retracement level support near 0.6900 mark.


“Original analysis is provided by Admiral Markets
 
Technical Overview: Important CAD Pairs

EURCAD


Repeated failures to surpass short-term ascending trend-line seems portraying the EURCAD's "Rising-Wedge" bearish technical pattern near four month highs. The pair presently trades close to the support-line of mentioned formation, around 1.5180, breaking which the bearish pattern gets confirmed, forcing the pair to plunge towards 1.5060 and the 1.5010 – 1.5000 support-zone, including 23.6% Fibo. On a further downside below 1.5000 round figure mark, 1.4930 and the 1.4800 are likely intermediate support levels that the pair might test prior to aiming for 1.4620 and the 1.4500 important support marks. Alternatively, a bounce from the current levels could help the pair re-test its recent highs of 1.5320, breaking which 1.5425-30 can create a buffer for the pair's north-run towards the 1.5560-80 resistance region, encompassing March 2014 & August 2015 highs. Should the pair accelerates the advance beyond 1.5580, it can quickly rally to 1.5700 area.

GBPCAD


GBPCAD's incapacity to surpass 2.0950-70 horizontal resistance can be plotted via short-term descending triangle on H4 chart. The pair recently bounced-off from 2.0600 – 2.0610 support and may witness a pullback towards testing 2.0760-65 descending trend-line resistance, forming part of triangle. Should it manage to break the same, the pair can swiftly rise to 2.0840 and to the 2.0950-70 resistance area. Given the pair's ability to surpass 2.0970, chances of its run to 2.1050 and the 2.1200 become brighter. On the downside, a clear break below 2.0600 can confirm the pair's decline to 38.2% Fibo, near 2.0520 and to the 2.0370-60 horizontal support prior to its extended south-run towards 2.0230. Moreover, pair's additional decline below 2.0230 may force it to test 2.0000 psychological magnet.

CADJPY


Even if the short-term descending trend-channel favors further downside by the CADJPY, the pair failed to dip below 86.30 and is currently trading in a tight range between 86.30 and 87.00. Should the pair reverses from current levels, upper-line of the mentioned channel, near 87.20 become an important resistance to consider, breaking which 88.00 and 88.80 – 89.00 horizontal resistance region may stall the pair's further upside. Moreover, successful encounter of 89.00 can quickly fuel the pair's north-run to 90.70. Meanwhile, continued downside below 86.30 may find 85.50 as a stop for the bears, clearing which channel support and the 61.8% FE of its June – August downside, around 84.50-55, becomes an crucial support for the pair traders to watch.

CADCHF


Following its break of 0.7200 – 0.7185 support region, comprising ascending and horizontal trend-lines connecting January, February and August levels, the CADCHF seems losing momentum in its south-run, which in-turn helps plotting short-term "Falling-Wedge" bullish pattern. Presently, the pair is likely heading towards 0.7155-60 immediate resistance, also including the upper-line of formation, breaking which the near-term bulls can be activated to fuel the pair's up-move to 23.6% Fibo, near 0.7230 and to the 38.2% Fibo, near 0.7325-30. If the pair manage to clear 0.7330, it can quickly rise to 0.7425 prior to aiming for 0.7500 round-figure mark. However, pair's inability to sustain recent pullbacks and break below 0.7070-60 support area, encompassing pattern support and immediate lows, can magnify its further downside to August lows of 0.6970 and the 0.6900 psychological level. If the pair continues falling down below 0.6900, chances of its January low re-test, near 0.6530, can't be denied.


“Original analysis is provided by Admiral Markets
 
USDJPY, EURJPY And CHFJPY: Technical Traits

USDJPY


Last week's BoJ announcement, relating to the changes in its QE measures, dragged the USDJPY down below 100-day SMA, presently forcing it to test the 120.30-20 horizontal support-zone. Should the pair prints a daily closing below 120.20, also clearing the 120.00 psychological mark, it can quickly drop to 119.20 prior to aiming the 23.6% Fibonacci Retracement of its June – August downside, near 118.50-40 area. Moreover, further downsides by the pair below 118.40, may witness 118.00 as an intermediate support before it could plunge to August lows around 116.00. However, pair's reversal from the 120.30, as it did during mid-December and late-October, could test 50% Fibo, near 121.00, and the 100-day SMA, currently at 121.50, breaking which 61.8% Fibo, near 122.20 and the 122.85-90 are likely important upside levels that the pair traders should look for. Given the pair's ability to surpass 122.90, the 123.55-70 resistance-region, encompassing 76.4% Fibo, could limit its further up-move.

EURJPY


Even if the EURJPY managed to bounce from 129.55-60, comprised of 76.4% Fibo of its April – June rally and the broader descending trend-channel support, presently at 128.80, the 100-day SMA limited its additional rise, portraying another short-term trend-channel which plots its recent downside. The pair seems currently aiming for the nearby trend-channel support, around 131.20, breaking which 130.80-75 and the 130.25 are likely immediate downside supports for the pair. Should it dips below 130.25, the 76.4% Fibo, near 129.55-60, followed by the medium-term channel support, near 128.80, could trigger its reversal, failing to which the pair become vulnerable to plunge towards testing 127.50-45 area. Meanwhile, immediate channel resistance, also including 50-day SMA, near 132.55-60, can limit the pair's near-term advance, breaking which 50% Fibo, around 133.50, may act as a buffer during the pair's north-run to 134.25 (the 100-day SMA) and the broader channel resistance of 134.55-60. On a closing break above 134.60, the 38.2% Fibo, at 135.40, and the 136.50 are likely consecutive upside levels that the pair might aim for.

CHFJPY


Following its reversal from seven month old descending trend-line support, the CHFJPY's near-term up-move seems capped by the 100-day SMA, favoring the pair's immediate downside to 121.40-35, breaking which 120.50 and the 119.80, can provide intermediate stops during the pair's southward trajectory to November lows of 118.70. However, the mentioned trend-line support, currently near 117.50, may restrict the pair's following downside. Alternatively, 122.60 and the 100-day SMA of 123.60, could continue limiting the pair's near-term advance. If it clears 123.60 on a closing basis, the recent highs around 124.00 may hold the pair's consecutive rise before it could march to 38.2% Fibo of its June – November decline, near 124.80, breaking which 125.90 – 126.00 can act as strong upside resistance for the pair.


“Original analysis is provided by Admiral Markets
 
Technical Update - USDCHF, EURCHF and GBPCHF

USDCHF


Following it reversal from the highest level since Aug. 2010 touched in late Nov., the pair on 4-hourly chart seems to oscillate within a short-term symmetrical triangular formation with the lower ascending trend-line support near 0.9850 level. Failure to hold the current support area and a subsequent weakness below 100-day SMA support near 0.9820 is likely to increase the pair vulnerability to extend its corrective move towards its next major support near 0.9700 mark, representing 50% Fib. retracement level of May to Nov. up-swing and also nearing the very important 200-day SMA. Meanwhile an upward momentum above 0.9900 round figure mark is likely to confront a strong resistance at the upper descending trend-line of the triangle, currently near 0.9930 level. A decisive strength above the symmetrical triangular formation seems to assist the pair in reclaiming the very important parity mark, also coinciding with 23.6% Fib. retracement level.

EURCHF


On daily chart, the pair remains confined within a well-established short-term descending trend-channel formation. From current levels, sustained weakness below 1.0800-1.0780 region is likely to accelerate the pair's near-term weakening trend and drag it back towards testing the lower trend-line support of the channel, currently near 1.0660-50 region. Alternatively, strength above 1.0840-50 immediate resistance is likely to boost the pair back toward the upper trend-line resistance of the channel, currently near 1.0890-1.0900 mark. Considering that the pair is reversing after nearly testing 61.8% Fib. retracement level of its big downfall on Jan. 15, it seems more likely to resume it downward trajectory in the near-term. However, a decisive break-through the descending trend-channel might negate the bearish expectations, opening room for further upside for the pair in the near-term.

GBPCHF


The pair's reversal from an ascending trend-line resistance, extending from March highs through high touched in August, continues to extend its weakness within a short-term descending trend-channel formation on 4-hourly chart. Although, from current levels the pair could possibly make an attempt to recover further, but any recovery is likely to confront a strong resistance at the upper trend-line resistance of the channel, currently near 1.4780-1.4800 region. Failure to clear the descending trend-channel resistance and (or) a break below 1.4650 level immediate support is likely to confirm retest of the lower trend-line support of the channel, currently near 1.4550 region. Decisive break below the descending channel would suggest continuation of the pair's near-term downward trajectory, possibly towards testing its next major support near 1.4200 mark.


“Original analysis is provided by Admiral Markets
 
Technical Update - NZDUSD, USDJPY and USDCAD


NZDUSD


In otherwise a direction-less move, the pair continues to grind higher within a short-term ascending trend-channel formation on 4-hourly chart. However, it continues to find difficulty in decisively clearing 0.6830-40 immediate hurdle, also coinciding with 200-day SMA. Should the pair manage to conquer this immediate hurdle and move above 200-day SMA for the first time since August 2014, it is likely to accelerate its up-move immediately towards 0.7000 psychological mark resistance before heading further towards its next major resistance near 0.7150-60 zone. Meanwhile, weakness below 0.6800 round figure mark is likely to be supported by the lower trend-line of the ascending channel, currently near 0.6760-50 area. Decisive drop below 0.6750 support region, seems to drag the pair back towards 100-day SMA support, currently near 0.6660-50 zone, which if broken might negate the near-term bullish outlook for the pair.

USDJPY


On 1-hourly chart, the pair clearly seems to be oscillate within a short-term descending trend-channel. Hence, weakness below 120.40 level is likely to drag the pair towards testing the very important psychological mark support near 120.00 level, also coinciding with the lower trend-line support of the channel. A decisive break below the descending trend-channel support now seems to open room for continuation of the pair's near-term downward trajectory towards 118.90-80 support, which could further get extended till 118.40-30 important support. On the upside, immediate resistance is pegged at the upper trend-line of the channel, currently near 120.65-70 region. Strength above this immediate resistance is likely to lift the pair beyond 121.00 mark resistance towards its previous strong support now turned major resistance near 121.35-40 region.

USDCAD


Following its reversal from near-term over-bought conditions, the pair managed to hold and rebound from an ascending trend-line resistance break-point now turned immediate strong support near 1.3800 mark. From current levels, a move above 1.3900 mark is likely to be followed by an additional boost towards 1.3950-60 resistance, beyond which the pair could witness a fresh leg of up-move. Above 1.3950-60 resistance, the pair is likely to surpass 1.4000 psychological mark and extend its up-move towards 100% Fib. expansion level resistance near 1.4150-60 area. With daily RSI still reading above 70, reversal from 1.3900 mark resistance might drag the pair back towards 1.3800 mark resistance turned support area. Weakness below 1.3800 mark support is likely to extend the pair's near-term corrective move back towards retesting 61.8% Fib. expansion level resistance break-point turned support near 1.3650 level.


“Original analysis is provided by Admiral Markets
 
Technical Outlook - AUDUSD, EURAUD, GBPAUD and AUDJPY

AUDUSD


The pair continues to face difficulty in clearing 0.7280 immediate hurdle. However, considering that the pair has held and rebounded from an ascending trend-line support and is trading well-above 100-day SMA, it seems more likely to clear this immediate resistance and head towards testing the very important resistance near 0.7370-80 area, coinciding with 38.2% Fib. retracement level of May-Sept. downfall. Although, momentum above this strong resistance is likely to confront resistance at 200-day SMA, currently near 0.7420 level, but the pair is likely to surpass 200-day SMA resistance and extend its upward trajectory towards its next major resistance near 0.7550-60 area, nearing 50% Fib. retracement level. Meanwhile on the downside, 0.7200 confluence region, comprising of 23.6% Fib. retracement level and 100-day SMA, seems to protect immediate downside. A break below this immediate support is followed by the very important ascending trend-line support, currently near 0.7130 level, which if broken might negate the pair's near-term bullish expectations.

EURAUD


The pair remains within a well-established descending trend-channel formation visible on 4-hourly chart. However, when taken into consideration along-with the pair's sharp recovery from early Dec. lows seems to constitute towards formation of a bullish continuation, Flag chart pattern. The upper trend-line of the channel, currently near 1.5150 level seems to act as immediate resistance, which if cleared has the potential to lift the pair immediately towards 1.5300 round figure mark resistance. Sustained strength above 1.5300 mark seems to open room for continuation of the upward trajectory towards its next major resistance near 1.5500 mark with 1.5400 round figure acting as intermediate resistance. Meanwhile, weakness below 1.5030-20 immediate horizontal support area might continue but is likely to find strong support at the lower trend-line support of the channel, currently near 1.4920-1.4900 mark. Failure to hold and rebound from the descending trend-channel support might now drag the pair immediately towards 1.4800-1.4780 support area before depreciating further towards its next major support near 1.4600 mark.

GBPAUD


Extending its reversal within a well-established descending trend-channel formation on daily chart, the pair has now decisively weakened below 200-day SMA. From current levels, the pair seems to continue drifting lower towards testing its next major support near 2.0200 mark, representing 61.8% Fib. retracement level of its March to August up-move. Further, a decisive break below the descending trend-channel support opens room for continuation of the near-term downward trajectory towards the very important psychological mark support near 2.0000 level. Meanwhile, any bounce back beyond 2.0480-2.0500 immediate resistance now seems to be capped near 2.0580-2.0600 confluence region, comprising of 50% Fib. retracement level and 200-day SMA. Only a decisive strength above this strong resistance might negate the possibilities of any further downward momentum for the pair and lift it back towards its next major resistance at 38.2% Fib. retracement level near 2.0950 level. Round figure marks (2.0700 and 2.0800) seems to act as intermediate resistance for the pair.

AUDJPY


After testing the lower trend-line support of a short-term ascending trend-channel formation on daily chart, the pair has failed to register any meaningful recovery beyond 100-day SMA. However, should the pair continue holding above 100-day SMA and subsequently clear 87.70 immediate horizontal resistance, it seems to immediately rise toward 89.00 mark intermediate resistance, before attempting a retest of the very important 200-day SMA resistance, currently near 90.25-30 region. On the downside, the lower trend-line support of the channel, near 87.00-86.80 zone, also coinciding with 100-day SMA, might continue to act as immediate strong support. Decisive break below the ascending trend-channel support is likely to increase the pair's vulnerability to resume its prior weakening trend, initially towards testing 85.40-30 intermediate support and eventually towards its next major support near 84.20-84.00 area.


“Original analysis is provided by Admiral Markets
 
Technical Update: USDCHF, GBPCHF, AUDCHF and NZDCHF

USDCHF


Even if the symmetrical triangle confines immediate USDCHF moves, a closing break below 0.9860, comprising formation support-line, can quickly push the pair towards 50% Fibonacci Retracement of its August - November rally, around 0.9800 – 0.9790 area; however, four-month old ascending trend-line, near 0.9750-45, could restrict its further downside. Given the bears' dominance following 0.9745 break, the pair can stretch the south-run to 200-day SMA, presently near 0.9650, breaking which it can be deprived of near-term up-move and may plunge to sub-0.9500 mark. Alternatively, a bounce from the current levels is likely witnessing 38.2% Fibo, near 0.9920, as an immediate resistance prior to targeting the triangle resistance-line, around 0.9960. Moreover, sustained break above 0.9960, also clearing the 1.0000 psychological magnet, can fuel the pair's rally to surpass 1.0200 round figure mark with 1.0090 and 1.0130-40 being intermediate resistances.

GBPCHF


Following its break of 1.5200 mark, the GBPCHF maintained its downturn, as portrayed by the short-term descending trend-channel which currently seems pushing the pair to 1.4655-50 horizontal support, clearing which the recent lows around 1.4600 psychological level might act as a buffer during the pair's plunge to mentioned channel support, near 1.4500 round figure mark. Should it fails to rein further downside below 1.4500, the pair becomes vulnerable to test 1.4370-60 support-zone. Meanwhile, pullbacks from the horizontal support may find the channel resistance, around 1.4750-55, as a strong upside resistance, breaking which 23.6% Fibo of its December downside, near 1.4820, and the 1.4860 are likely consecutive upside levels that the pair may find during its sustained north-move to 1.4995 – 1.5000 area.

AUDCHF


AUDCHF's pullback from 100-day SMA and four month old ascending trend-line support, also including 23.6% Fibonacci Retracement of its September 2014 – August 2015 downside, seems finding it difficult to break 0.7200 round figure mark during the year-end thin trading sessions; however, mentioned trend-line support, presently around 0.7110, may hold the pair's near-term up-move. If the trend-line support fails to stop the pair's downside, 100-day SMA and 23.6% Fibo, near 0.7050-45, may give another chance for the pair traders to expect a bounce, negating which the pair might progress in its southward trajectory to 0.6950-45 and to the January lows of 0.6850. On the upside, a daily close beyond 0.7200 may trigger the pair's advance to 0.7250, the 0.7285-95 and the 38.2% Fibo, near 0.7375, prior to targeting the fifteen month old descending trend-line resistance, near 0.7485-90.

NZDCHF


Failure to break 0.6460-50 support-zone triggered the NZDCHF bounce, which presently fuels the pair towards eight months old descending trend-line resistance, around 0.6810-20, that could restrict its additional upside, failing to which can help the pair test 0.6930-35 resistance-zone. If the bulls accelerate pair's north-run beyond 0.6935, the 0.7055-60 is likely an intermediate halt during its rise to 0.7140-50, including 61.8% Fibonacci Retracement of January – August downside. Though, inability to counter the mentioned trend-line resistance keep favoring the pair's pullback to 0.6700 mark, followed by the 0.6610 – 0.6600 area, comprising 200-day SMA and the 38.2% Fibo. On a further decline below 0.6600, an ascending trend-line support, connecting August lows to recent lows, at 0.6550, may limit the pair's downside, breaking which 0.6500 may offer a small stop for the pair's southward trajectory to 0.6300 – 0.6290 area, including 23.6% Fibo level.


“Original analysis is provided by Admiral Markets
 
Technical Overview - EURJPY, GBPJPY, CHFJPY and NZDJPY

EURJPY


The pair's rebound from a well-established descending trend-channel support failed to lift it back above the very important 200-day SMA. From current levels, momentum below 131.00 round figure mark seems to confirm continuation of the pair's weakening trend towards retesting the lower trend-line support of the channel, currently near 129.00 mark. Meanwhile, for any meaningful bounce back the pair need to clear its immediate hurdle near 132.00 mark, which if conquered seems to boost the pair beyond 134.00 mark towards retesting Dec. month swing highs near 134.30-50 area, also nearing 200-day SMA. Furthermore, sustained strength above 134.00 mark, leading to a momentum above 200-day SMA resistance, has the potential to continue lifting the pair towards testing its next major resistance near 135.80-136.00 zone, marking the upper trend-line of the descending channel formation on daily chart.

GBPJPY


Extending its near-term downward trajectory, the pair has now dropped below 178.50 important support marking 61.8% Fib. expansion level. Although oversold (RSI reading below 30), the pair seems to continue with its weakening trend towards 2015 daily closing lows support near 176.00 region. The near-term downward trajectory could further get aggravated towards 100% Fib. expansion level support near 173.00 level. Meanwhile on the upside, 61.8% Fib. expansion level support break-point, near 178.50-70 area, now seems to act as immediate resistance. A sustained strength above this immediate resistance might trigger further near-term recovery for the pair towards reclaiming 180.00 psychological mark. Only a sustained move back above 180.00 psychological mark might negate the near-term bearish expectations and could trigger an immediate short-covering rally towards 182.20-40 resistance zone.

CHFJPY


After repeatedly failing to conquer 123.80-124.00 strong resistance confluence, comprising of 100-day SMA and 50% Fib. retracement level of 129.00-119.80 downfall, the pair has now move back to 23.6% Fib. retracement level support near 121.10-121.00 mark. Failure to hold this immediate support seems to drag the pair back towards retesting 119.00 round figure mark support, earlier tested in Nov. Below 119.00 mark support, the pair is likely to extend its depreciating move towards 61.8% Fib. expansion level support near 117.60-50 area. Meanwhile, bounce from current support area is likely to face immediate resistance near 122.00 mark, which is closely followed by resistance near 122.50-60 area marked by 38.2% Fib. retracement level. On a sustained strength above 38.2% Fib. retracement level resistance, the pair could possibly make a fresh attempt to retest 100-day SMA resistance, currently near 123.50 area, which if conquered might now negate expectations of any further downside in the near-term.

NZDJPY


Although the pair continues to hold above 50-day SMA immediate support, it is yet to clear the very important resistance confluence near 82.00-82.25 area comprising of 200-day SMA and 50% Fib. retracement level of April to August downfall. Move above this immediate resistance is likely to face another resistance near 83.70-80 area marking the upper trend-line resistance of a short-term ascending trend-channel formation on daily chart. A decisive break-through the ascending trend-channel resistance now seems to accelerate the pair's near-term up-move initially towards 61.8% Fib. retracement level of April to August downfall resistance near 84.50-60 area, and eventually towards covering the June price gap near 87.70-80 region. Meanwhile on the downside, weakness back below 82.00 round figure mark might continue finding support at 50-day SMA region, currently near 81.20-81.00 round figure mark. Below 50-day SMA support, the pair is likely to extend its weakness towards testing the lower trend-line support of the channel, currently near 80.00 psychological mark, also nearing 100-day SMA. A decisive weakness below 80.00 important support is likely to negate the near-term bullish outlook for the pair.


“Original analysis is provided by Admiral Markets
 
Back
Top