Technical Analysis by Admiral Markets

Technical Update - EURNZD, AUDNZD, NZDCAD and NZDCHF

EURNZD


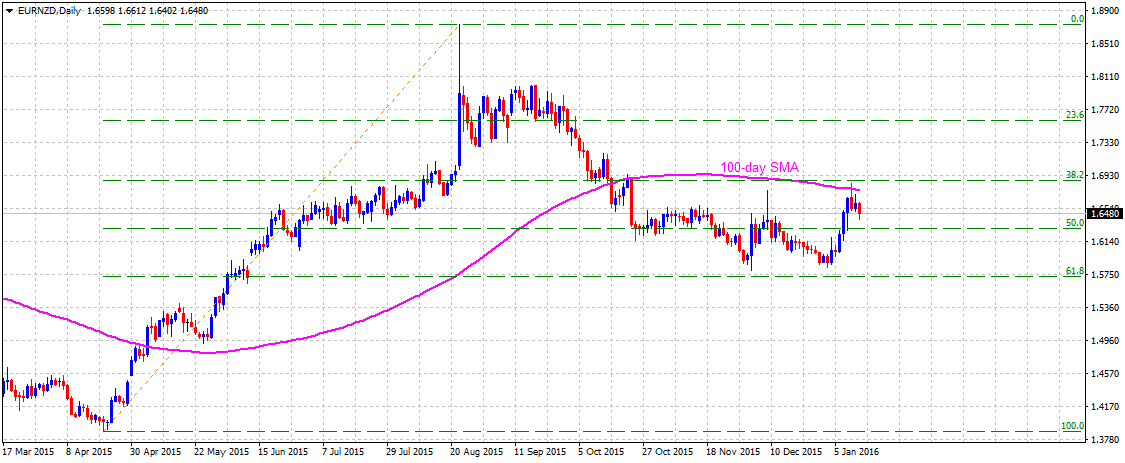
The pair's another rebound from near 61.8% Fib. retracement level of April to August up-move failed to lift it beyond 1.6850 resistance area marked by 100-day SMA and also nearing 38.2% Fib. retracement level. The pair has now dropped back below 1.6500 mark and subsequent weakness below 1.6400 round figure mark support is likely to drag the pair back towards 50% Fib. retracement level support near 1.6300 level. Failure to hold 1.6300 mark support is likely to increase the pair's vulnerability to drift back towards the very important support near 1.5800 mark. On the upside, move above 1.6650 immediate horizontal resistance might continue to face resistance at 100-day SMA region, currently near 1.6750 level. This is followed by resistance at 38.2% Fib. retracement level near 1.6870-80 zone. Sustained strength above 100-day SMA resistance and a subsequent move above 38.2% Fib. retracement level seems to immediately lift the pair beyond 1.7000 mark towards 1.7100-1.7120 horizontal resistance.
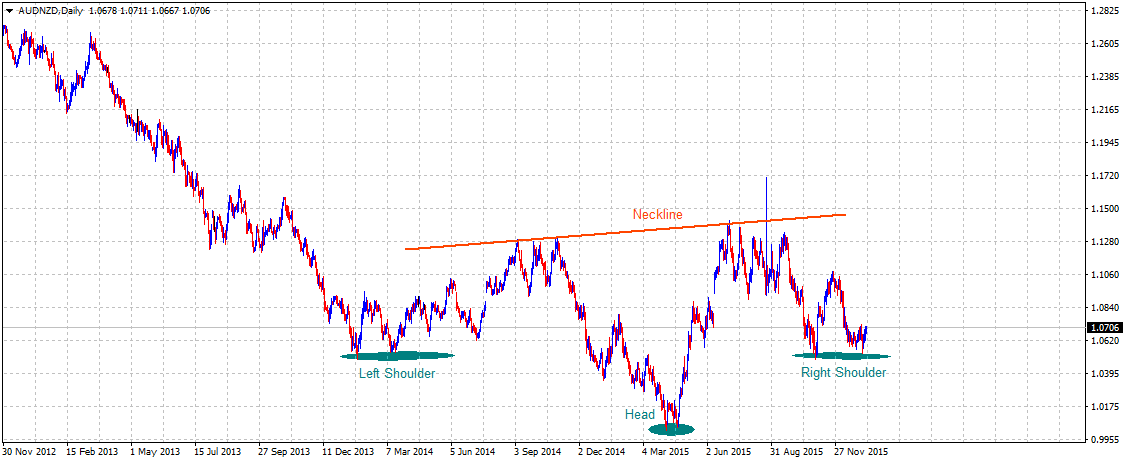
AUDNZD


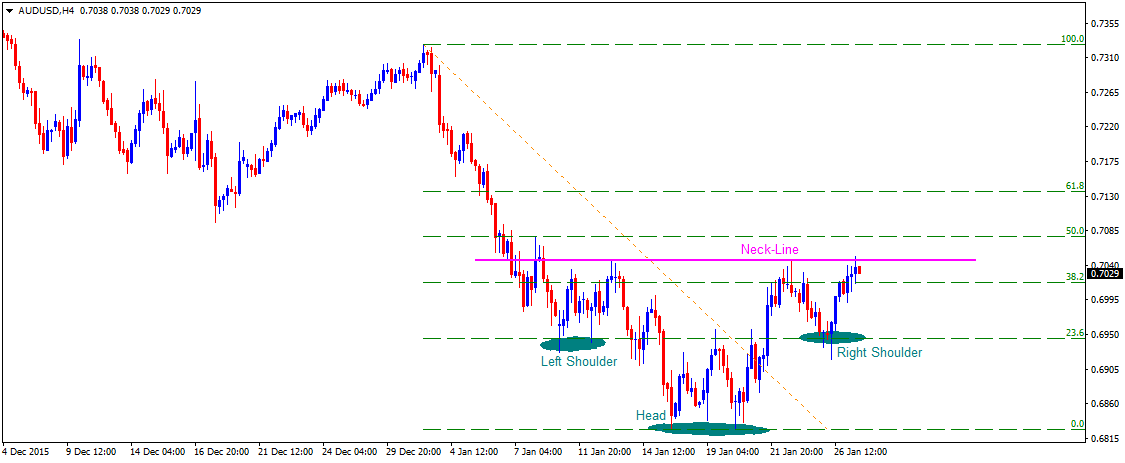
Even as the pair reversed from over two-year high touched in August, it clearly seems to have found a strong support near 1.0500 area. Moreover, the pair also seems to be in the process of forming a bullish reversal Head and Shoulders chart-pattern on daily chart. The pattern, however, is confirmed only once the pair manages to clear an important resistance near 1.1500 level, marked by the Neck-line of the pattern formation. From current levels, sustained trade above 1.0700 mark is likely to accelerate the up-move towards its next major resistance near 1.0900 mark with 1.0800 round figure acting as intermediate resistance. On the downside, 1.0600 mark seems to have emerged as immediate support. However, major downside support continues to remain near 1.0500 mark, which if broken negates the bullish formation and thus, opening room for resumption of the pair's prior weakening trend. Below 1.0500 mark, the pair could immediately drop to test its next support near 1.0350 region.

NZDCAD


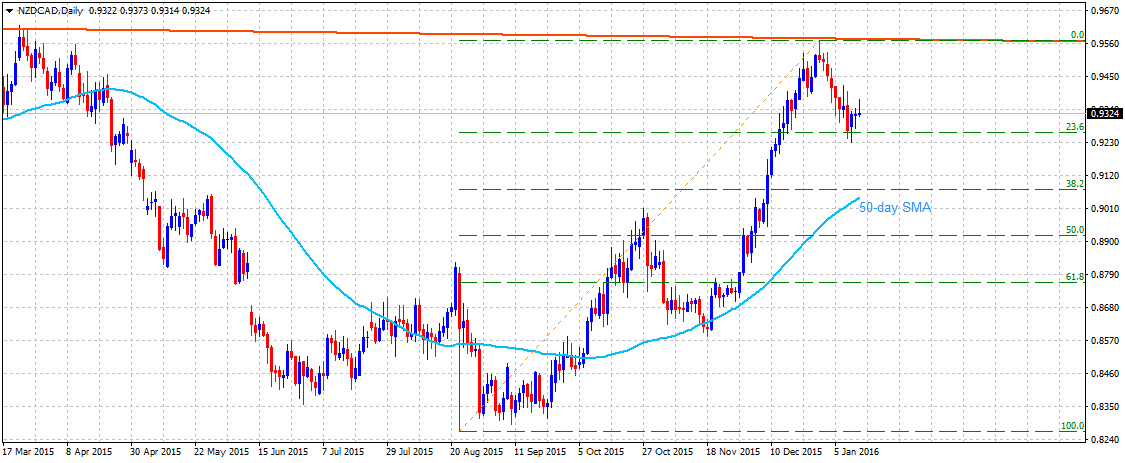
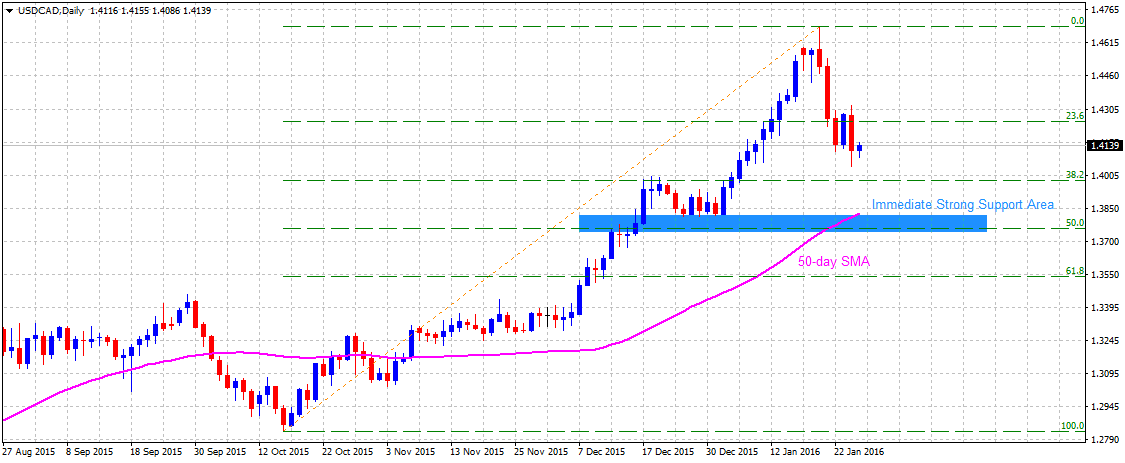
The pair's sharp recovery from August 2015 lows, marking its lowest level since Sept. 2013, seems to face difficulty in clearing a descending trend-line resistance (near 0.9550-60 area) extending from Mar. 2014 highs through Mar. 2015 highs. The pair, however, has managed to find support at 23.6% Fib. retracement level support of Aug. to Dec. 2015 up-swing, near 0.9260-50 area. Weakness below this immediate support is likely to extend the pair's near-term corrective move towards its next major support near 0.9070-50 confluence region, comprising of 38.2% Fib. retracement and 50-day SMA. On the upside, 0.9380-0.9400 area is likely to act as immediate resistance, which if conquered seems to lift the pair back towards its recent closing high level resistance near 0.9500-0.9520 area. Any further up-move beyond 0.9500 mark resistance might continue to be restricted by the descending trend-line resistance near 0.9570 level. Only a decisive break-through beyond this strong resistance opens rooms for further near-term appreciating move for the pair.

NZDCHF


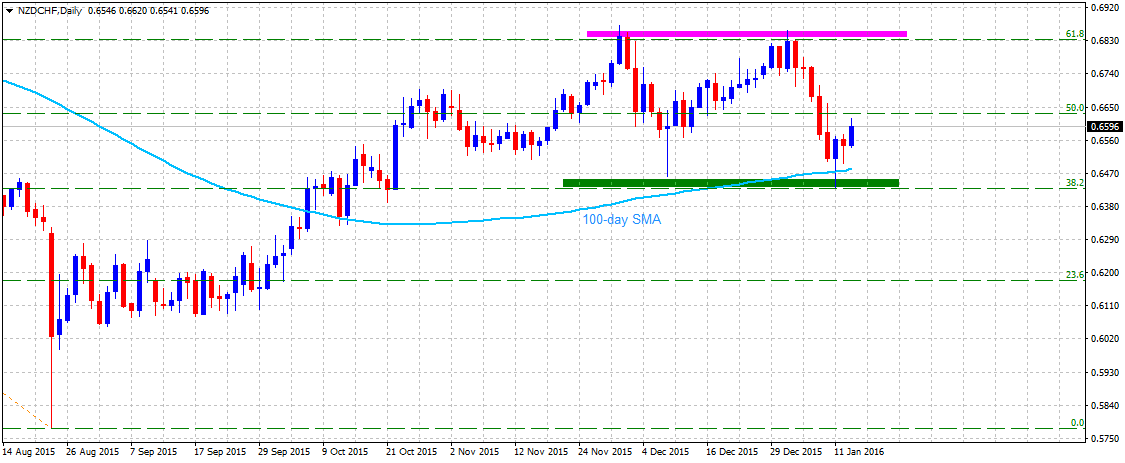
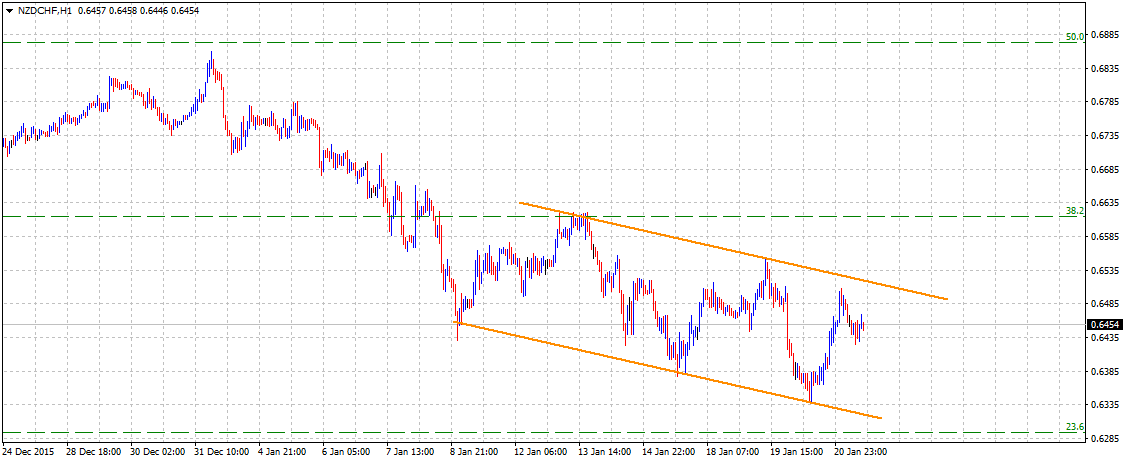
The pair's repeated reversal from 61.8% Fib. retracement level of it's Mar. to Aug. 2015 downfall continues to find support at 38.2% Fib. retracement level near 0.6425-30 area, also coinciding with 100-day SMA. The pair has now moved back to an intermediate resistance level at 50% Fib. retracement near 0.6625 region. Move above this immediate resistance is likely to confirm the near-term range for the pair, thus lifting it back towards 61.8% Fib. retracement level resistance near 0.6850-60 zone. Meanwhile, reversal from current resistance area and a subsequent weakness back below 0.6500 mark is likely to drag it back towards the lower end of the trading range support near 0.6420 area. Decisive break-through below the very important 0.6430-20 support area is likely to trigger a fresh leg of weakness, initially towards 0.6325-20 intermediate support and eventually towards 23.6% Fib. retracement level support near 0.6175-70 area.


“Original analysis is provided by Admiral Markets
 
Technical Overview: EURUSD, GBPUSD, AUDUSD and NZDUSD

EURUSD


While short-term descending trend-channel continues limiting the EURUSD up-move, the 1.0820 – 1.0800 horizontal support-zone, comprising 50-day SMA and 23.6% Fibonacci Retracement of its August – December 2015 downside, have been confining the pair's immediate decline. Should the pair drops below 1.0800, the 1.0700 – 1.0680 area, including the mentioned channel's support, becomes a strong support for the pair traders to watch, breaking which 1.0630 and the December lows around 1.0520 are likely consecutive levels that could hold its further south-run. On the upside, 1.0970-75, encompassing the channel resistance and the 38.2% Fibo, quickly followed by the 100-day SMA, around 1.1000 psychological magnet, can restrict the pair's near-term advance while a break above 1.1000 needs to confront with five month old descending trend-line resistance, presently at 1.1100, and the 50% Fibo, at 1.1120, in order to aim for 1.1300 resistance-region.

GBPUSD


Even if the GBPUSD managed to bounce from immediate downward slanting trend channel, also touched the 61.8% FE of its July 2014 – April 2015 downside, an intermediate descending trend-line, around 1.4350, followed by the channel resistance of 1.4430, may keep restricting its near-term up-move. Given the pair's successful break above 1.4430, the profit booking recovery can fuel it to 1.4600 area, breaking which chances of the pair's extended rise to 1.4700 and the 1.4780-85 becomes brighter. Meanwhile, 1.4280 and the recent low near 1.4230 can act as nearby supports for the pair, breaking which the channel support of 1.4180 may provide another bounce to the prices, failing to which the pair might extend its southward trajectory towards 1.4000 psychological magnet.

AUDUSD


Following its bounce from 0.6830-25, the AUDUSD tested 0.6950 mark; however, the short-term descending trend-channel limited the pair's further advance, favoring a pullback to 0.6850. Should it drop below the 0.6850 immediate support, the 0.6800 round figure mark, also including 61.8% FE of its June - September 2015 downside, quickly followed by the channel's lower-line, near 0.6790, could restrict its additional south-run. Given the pair's inability to hold the 0.6790 mark, the 0.6650 and the 0.6550 are likely intermediate supports during the pair's following downside to 0.6250-60 area. Alternatively, successful break of 0.6950 can trigger the pair's up-move to 0.7050-60 horizontal resistance, clearing which 0.7150 and the 0.7230-40 are expected upside levels that the pair may look for.

NZDUSD


NZDUSD's drop below 0.6585-75, which includes 100-day SMA and the 23.6% Fibonacci Retracement of its April – September 2015 downside, fetched the pair to the lowest levels since late-September 2015; however, 0.6410-30 horizontal support helped the pair's bounce to near 0.6500 mark, indicating re-test of 0.6585-75 support-turned-resistance which might restrict the pair's near-term advance. If the pair manages to clear 0.6585 and surpasses 0.6600 round figure mark, it can immediately rise to 0.6700 and the 0.6800 mark comprising 38.2% Fibo while successful trading above 0.6800 have to counter 0.6900 resistance-area in order to witness 0.7080 – 0.7100 resistance-region. On the downside, pair's drop below 0.6400 mark may give fresh life to the bears which can fetch the pair prices to 0.6300 and the September lows of 0.6235. If the pair continue its downside below 0.6235, chances of its plunge to sub-0.6000 region, near the 61.8% FE of mentioned decline, around 0.5960-70 can't be denied.


“Original analysis is provided by Admiral Markets
 
Technical Check - USDJPY, EURJPY, CADJPY and CHFJPY

USDJPY


The pair has finally decisively weakened through an important support near 116.60-50 area marking a trend-line support, held since Dec. 2014. Hence, from current levels the pair seems to extend its near-term weakness, possibly towards Dec. 2014 lows support near 115.50 region with Jan. 2015 lows, near 116.00-115.85 region acting as intermediate support. Considering the pair's decisive break-through an important trend-line support, it now seems vulnerable to continue drifting lower in the near-term, towards testing sub-114.00 mark support representing 23.6% Fib. retracement level of its big up-move from Oct. 2011 lows to multi-year highs touched in May 2015. Meanwhile on the upside, sustained trade back above the important support break-point could easily lift the pair back towards 118.00 mark, which now seems to act as immediate strong resistance and thus, only a decisive strength above 118.00 mark might negate the near-term bearish outlook for the pair.

EURJPY


The pair's possibly break-down below a well-established descending trend-channel formation on daily chart. Decisive break-through a well-established trend-channel seems more likely to extend the pair's near-term downward trajectory towards retesting April 2015 lows support near 126.00 mark. Subsequent drop below 126.00 mark is likely to be followed by additional weakness in the near-term towards testing its next major support near 123.00 mark. Meanwhile, any attempts of recovery from current levels is now likely to confront strong resistance near 128.80-129.00 area. Only a sustained move above 129.00 mark is likely to assist the pair in registering further recovery towards its next major resistance at 100-day SMA, currently near 131.00 mark.

CADJPY


Extending its sharp fall, the pair has now dropped below 80.00 psychological mark for the first time since Nov. 2012. Also on 1-hourly chart, the pair clearly seems to be trending lower within a short-term descending trend-channel and is currently witnessing a bounce back from the lower trend-line support of the channel. Should the pair manage to extend its recovery to move back above 80.00 mark, it seems to witness an immediate short-covering rally towards testing the upper trend-line resistance of the channel, currently near 81.00 mark. On the downside, the lower trend-line support of the channel, currently near 79.00 mark, might continue to protect immediate downside. Failure to hold this immediate support is likely to trigger a fresh leg of weakening trend for the pair, initially towards 76.50-30 intermediate horizontal support and eventually towards May 2012 lows support near 74.50 region. Considering the pair's near-term oversold conditions, it seems more likely to witness a relief rally before resuming its previous down-trend.

CHFJPY


Reversal from an important resistance confluence near 123.80-124.00 area, comprising of 100-day SMA and the upper trend-line resistance of a well-established descending trend-channel, has now dragged the pair below the lower trend-line support of the channel. Sustained trade below 116.60-50 trend-channel support and a subsequent weakness below 116.00 mark is likely to increase the pair's vulnerability to continue drifting lower towards testing its next major support near 114.00 mark in the near-term. Meanwhile, any attempts of recovery beyond the trend-channel support break-point near 116.60-50 area, now turned immediate resistance, and a subsequent move back above 117.00 round figure mark is likely to gain momentum towards 118.50 strong resistance. This 118.50 horizontal resistance area now seems to cap any attempts of recovery for the pair in the near-term.


“Original analysis is provided by Admiral Markets
 
Technical Update: Important CAD Pairs

USDCAD


Even as the short-term ascending trend-channel favors USDCAD up-move, failure to surpass the 1.4700 mark indicates pair's pullback to 1.4590-85 immediate support, clearing which the channel support, around 1.4500 mark, becomes crucial for the pair traders to watch. If the Bank of Canada (BoC) surprises the markets by no rate cut, the pair can dip below 1.4500 which opens the door for its short-term correction to 1.4400 and the 1.4180-70 support-zone. Meanwhile, a rate-cut and a dovish speech by the Canadian central bank's Governor can fuel the pair to channel resistance, near 1.4780-85, before targeting the 1.4900 and the 1.5000 psychological magnet while continued aggression by the pair beyond 1.5000 may find it difficult to break 1.5085 – 1.5100, surpassing which it can quickly rise to 1.5335-50 area.

EURCAD


Unlike USDCAD, the EURCAD is currently trading near an important resistance region of 1.6100 – 1.6110, comprising more than a year old ascending trend-line resistance and the upper-line of northward slanting trend-channel stretched from November 2015, which might restrict the pair's further up-move and can give rise to a pullback towards its 1.5850 nearby support. Given the pair's extended drop below 1.5850, the 1.5740-35 might act as an intermediate downside rest before it could plunge to 1.5550 and the channel support of 1.5330-20. Should the pair continue closing lower below 1.5320, it becomes vulnerable enough to test the 1.4920 – 1.4890 broad support-zone, including 50-day SMA with 1.5100 being a buffer level. On the upside, a clear break above 1.6110 can fuel the pair towards 1.6330-40 area prior to targeting the 1.6500 round figure mark.

GBPCAD


Having bounced from the immediate ascending trend-channel support, presently near 2.0500 mark, the GBPCAD maintained its up-move intact and is currently trading near 2.0730 level with 2.0770 and the channel resistance of 2.0820 acting as nearby resistances prior to its run-up to 2.0870 and the December 2015 highs of 2.0950. If the bulls accelerate the pair's up-move beyond 2.0950, also clear the 2.1000 mark, 61.8% FE of its December rally, near 2.1050, becomes next important resistance for the pair traders to watch. Alternatively, 23.6% Fibonacci Retracement of the said move, near 2.0680, and the 2.0640, are likely downside levels that the pair might test during its pullback while sustained downside below 2.0640 can fetch the pair to 2.0500 channel support, breaking which chances of its drop to 2.0300 and the 2.0230 consecutive supports can't be denied.

AUDCAD


While nearby upward slanting trend-channel defines the AUDCAD rise, the pair recently turned down from 1.0080 immediate resistance and is indicating further decline to 23.6% Fibonacci Retracement of its November – December 2015 up-move, near 1.000 psychological magnet. If the accelerated downside pressure pulls the pair to below 1.0000 levels, the mentioned channel's support, near 0.9960, may limit its further decline, which if broken can magnify the pair's southward trajectory towards 0.9830-40 support-zone, 61.8% Fibo, near 0.9700 and the 0.9660 are likely important levels for the pair trader to watch. However, the pair's continued up-move beyond 1.0080 can propel it to the channel resistance of 1.0130 prior to its rally towards December highs of 1.0170 while further advances beyond 1.0170 might well witness the 61.8% FE of the mentioned move near 1.0270.


“Original analysis is provided by Admiral Markets
 
Technical Outlook: GBPJPY, GBPAUD, GBPNZD and GBPCHF

GBPJPY


Although, the GBPJPY failed to close below 164.00 – 163.50 important support-zone during its Wednesday's plunge, the pair couldn't clear the 167.00 immediate resistance and is again inching lower towards mentioned critical downside area, breaking which it can quickly drop to 162.00 and the 159.50 levels. Moreover, sustained downtrend below 159.50 might force the pair to test 156.50 and the 155.00 support levels during its further south-run. Meanwhile, a daily close above 167.00 can trigger its profit booking moves to 169.00 and the 61.8% Fibonacci Retracement of its October 2013 to June 2015 advance, near 170.50. Should the pair manage to surpass 170.50, it becomes capable enough to aim for 175.50 crucial resistance level wherein 173.50 might act as buffer rest while successful break of 175.50, encompassing 50% Fibo, negates the chances of its near-term downside and can fuel the pair to 180.00 round figure mark.

GBPAUD


While four month old descending trend-channel continue favoring GBPAUD downside, the pair seems finding it difficult to break the intermediate downward slanting trend-line and signals extended slide towards 2.0340 support. If the pair dips below 2.0340, the 61.8% FE of its September – December downside, near 2.0120, followed by the channel support of 2.0000 psychological magnet might restrict its further decline. Should the pair fails to respect the 2.000 mark, it can further weaken to 1.9800 – 1.9780 support-zone. Alternatively, 2.0600 is likely an immediate resistance for the pair before it could test the 23.6% Fibo of the said move, near 2.0750, and the descending trend-line resistance of 2.0850. However, 2.1000 and the broader southward facing channel resistance, around 2.1085 – 2.1100, could restrict the pair's further advances beyond 2.0850.

GBPNZD


Even as the 61.8% Fibonacci Retracement of April – August 2015 surge, coupled with the support-line of "falling-wedge" pattern, limited the GBPNZD downside during late-December, the pair seems lacking the strength to surpass resistance-line of the bullish formation, which also accompanies the 50-day SMA. From the current levels, the pair is more likely to test the 2.1850 immediate support before targeting the 2.1700 and the 61.8% Fibo, near 2.1530; however, the technical pattern support, around 2.1150, becomes strong level to limit its consecutive south-run. If at all the pair plunges below 2.1150, the bullish formation gets negated and the prices can drift lower to 2.1000 and the 2.0850 downside marks prior to extending its southward trajectory towards 2.0400 support. On the upside, 50% Fibo, near 2.2250, next to the 2.2400 – 2.2420 important resistance area, including the formation resistance and the 50-day SMA, might continue restricting the pair's near-term up-moves while sustained break of 2.2420 confirms the bullish formation and can fuel the prices to 2.2940-50 area, which includes 100-day SMA and the 38.2% Fibo level. Moreover, pair's accelerated rise beyond 2.2950 can enable it to aim for 2.3280 – 2.3300 resistance region.

GBPCHF


With the short-term descending trend-channel depicting the GBPCHF's reversal from 1.5530-70 area, the pair currently rests near the 61.8% Fibonacci Retracement of its January crash, around 1.4140; however, the mentioned channel's support, near 1.4050, might confine the pair's further decline following 1.4140 break. Should the pair drops below 1.4050, the 1.3970 and the 50% Fibo, near 1.3700, are likely consecutive downside levels that it can go-through before it could test the 1.3600 support, break of which can make the pair vulnerable enough to test 1.3400 mark. On the other hand, 1.4350 and the channel resistance, presently at 1.4500, might as strong nearby resistance to limit the pair's up-move, breaking which 1.4600 and the 200-day SMA, at 1.4800 now, are likely levels that could cap its medium-term advance.


“Original analysis is provided by Admiral Markets
 
Technical Outlook - USDCHF, EURCHF, CADCHF and NZDCHF

USDCHF


Following its reversal from the highest level since Aug. 2010 tested in Nov. 2015, the pair on short-term chart has moved within a narrow trading range, marking a symmetrical triangular formation. The lower ascending trend-line support of the formation currently stands near 0.9985-90 zone and the upper descending trend-line resistance is pegged near 1.0075-80 area. Should the pair manage to break-through the upper trend-line resistance, it seems to resume its medium-term up-trend towards reclaiming 1.0300 mark resistance with 1.0200 round figure mark acting as intermediate resistance. Further, the pair's near-term upward trajectory is likely to get extended towards 61.8% Fib. expansion level resistance near 1.0450 region. Alternatively, a sustained weakness back below 1.0000 psychological mark might now increase the pair's vulnerability to extend its corrective move immediately towards 0.9900 mark representing 38.2% Fib. retracement level of Aug. to Nov. 2015 up-swing. The near-term downfall could further get extended back towards retesting sub-0.9800 level support, near 0.9785-80 area, marking 50% Fib. retracement level.

EURCHF


Holding an important support near 38.2% Fib. retracement level of Apr. to Sept. up-swing, the pair is now moving closer to its Sept. 2015 closing highs strong resistance near 1.0990-1.1000 mark. A clear strength above 1.1000 psychological mark is likely to continue supporting further near-term appreciating move for the pair, possibly towards 1.1130-50 resistance area, marking 61.8% Fib. retracement level of Jan. 2015 big sharp plunge. On the downside, 1.0900 round figure mark seems to protect immediate downside. Weakness below 1.0900 mark, leading to a subsequent break below 50% Fib. retracement level important support near 1.0850 level, is likely to drag the pair back towards testing the very important support near 1.0750 region, held since Aug. 2015.

CADCHF


After testing the lower trend-line support of a short-term descending trend-channel formation on 4-hourly chart, the pair rebounded back and is currently trading close to the upper trend-line resistance of the channel, currently near 0.6960-70 area. A decisive break-through this immediate resistance and a subsequent strength back above 0.7000 psychological mark (23.6% Fib. retracement level of it fall from Nov. 2015 highs to low tested in Jan. 2016) might negate possibilities of any further near-term downside for the pair. Beyond 0.7000 mark, the pair might continue recovery towards 38.2% Fib. retracement level resistance near 0.7150-60 area with 0.7085-90 zone acting as intermediate resistance. Alternatively, reversal from current resistance area now seems to find immediate support near 0.6915-0.6900 mark. Failure to hold this immediate support is likely to force the pair back towards retesting 0.6800 round figure mark support before dropping further to test the lower trend-line support of the channel, currently near 0.6760-50 region.

NZDCHF


Extending its reversal from 50% Fib. retracement level of Jan. to Aug. 2015 downfall, the pair on 1-hourly chart has moved within a short-term descending trend-channel formation. The pair is now reversing from close to an important resistance confluence near 0.6530-50 area, comprising of 200-day SMA and the upper trend-line resistance of the channel. Should the pair extend its reversal and drop below 0.6400 mark support, it is likely to continue dropping towards testing 23.6% Fib. retracement level support near 0.6300 region, also coinciding with the lower trend-line support of the channel. On the upside, 0.6490-0.6500 mark now seems to have emerged as an immediate resistance zone, which is closely followed by resistance at the upper trend-line of the channel, currently near 0.6515-20 area. A sustained strength above 0.6500 mark strong resistance has the potential to lift the pair towards 0.6600 mark, representing 38.2% Fib. retracement level resistance, and the up-move could further get extended towards its next major resistance near 0.6690-0.6700 zone.


“Original analysis is provided by Admiral Markets
 
Technical Overview - AUDNZD, NZDCAD and NZDJPY

AUDNZD


The pair's every dip towards 1.0500 mark is getting bought into, making it a very strong support for the near-term. Moreover, this 1.0500 mark historic support accompanied with the pair's fall to all-time lows in Apr. 2015 seems to constitute towards formation of a bullish reversal Inverted Head & Shoulders pattern on daily chart, which would be confirmed once the pair decisive conquers 1.1500 mark important resistance. From current levels, until the pair continues holding above 1.0800 mark, it is likely to extend it up-move immediately towards its major resistance near 1.0900 mark. Further, sustained trade above 1.0900 mark could easily lift the pair back above 1.1000 psychological mark resistance. Meanwhile on the downside, weakness below 1.0700 round figure mark is likely to drag the pair back towards 1.0600 mark intermediate support ahead of the very important support near 1.0500 mark. Only a decisive break below 1.0500 mark might negate the bullish pattern formation, making the pair vulnerable to further downside in the near-term.

NZDCAD


The pair's sharp recovery from the lowest level since Sept. 2013, touched in Aug. 2015, failed to provide the required momentum to surpass a descending trend-line resistance near 0.9550-60 area. This trend-line resistance extends from Mar. 2014 highs through Mar. 2015 highs and hence remains an important hurdle for the pair to conquer. Reversal from the important resistance has now dragged the pair below its immediate support near 0.9260-50 zone, marking 23.6% Fib. retracement level of Aug. to Dec. 2015 up-swing. Hence, from current levels the pair seems to extend its near-term corrective move towards 50-day SMA support, currently near 0.9140-30 area, which could further get extended towards 38.2% Fib. retracement level support near 0.9070-60 area. On the upside, 23.6% Fib. retracement level support break-point near 0.9250-60 zone, now seems to act as immediate resistance. This is followed by a strong horizontal support near 0.9390-0.9400 mark, which if conquered could lift the pair back toward retesting the very crucial trend-line resistance, near 0.9550-70 region.

NZDJPY


The pair's recovery from Jan. lows provided the required momentum to surpass a strong resistance near 76.00 mark, representing the upper trend-line resistance of a short-term descending trend-channel formation on 4-hourly chart. The break-out momentum now seems to face resistance near 77.20-25 area, marking 38.2% Fib. retracement level of Dec. 2015 to Jan. 2016 down-leg. Sustained strength above this immediate resistance, also marking 23.6% Fib. retracement level of Dec. 2014 to Aug. 2015 downfall, seems to set the stage for continuation of the pair's near-term recovery towards its next major resistance near 79.40-50 confluence region, comprising of 100-day SMA and 61.8% Fib. retracement level of Dec. 2015 to Jan. 2016 weakness. Alternatively, failure to conquer this immediate resistance and a subsequent weakness below 76.50 immediate support, has the potential to drag the pair back towards 23.6% Fib. retracement level support near 75.90-80 area, also marking the short-term descending trend-channel break-out point.


“Original analysis is provided by Admiral Markets
 
Technical Traits of EURAUD, AUDCHF and AUDJPY

EURAUD


EURAUD's failure to surpass short-term ascending trend-channel resistance dragged the pair down to 100-day SMA, at 1.5395 now, indicating a quick test to 1.5300 round figure mark; however, the channel support, around 1.5220, might restrict its further downside, failing to which 50% Fibonacci Retracement of its April – August 2015, coupled with the 50-day SMA, near 1.5130, becomes a strong support for the pair traders to watch. Should the pair continue on its south-run below 1.5130, it becomes weaker enough to re-test the early month lows of 1.4870. Alternatively, 1.5600 mark becomes an immediate upside level for the pair to break before it can rise to 1.5700 and the 23.6% Fibo level around 1.5900 round figure. Moreover, an extended advance beyond 1.5900, might find it difficult in breaking the 1.6085 – 1.6100 area, comprising the mentioned channel resistance, which, if surpassed, can fuel the pair's rally to 1.6250-60 resistance-zone before aiming the August highs around 1.6600 psychological level.

AUDCHF


Even as the AUDCHF managed to bounce from the descending trend-channel support, the 50-day SMA, coupled with the channel upper-line, near 0.7160-70, can continue confining the pair's nearby up-move. If the pair rallies above 0.7170, also clears the 0.7200 round figure mark, 38.2% Fibonacci Retracement of September 2014 to January 2015 downside, near 0.7300, might hinder the pair's further rise. However, sixteen month old descending trend-line resistance, near 0.7410-20, could restrict the pair's extended advance beyond 0.7300. On the downside, 23.6% Fibo, near 0.6950, followed by the 0.6850, are likely intermediate supports that the pair can witness during its reversal before it could re-test the channel support, presently around 0.6730. Should the pair drops below 0.6730, it becomes weaker enough to test 0.6650 and the 0.6530 prior to targeting a re-test of January lows near 0.64000 mark.

AUDJPY


While short-term descending trend-channel depicts the AUDJPY's reversal from 200-day SMA, the pair recently bounced-off from the channel support and is currently aiming for the channel upper-line test, around 83.80 now, breaking which it can rise to 85.35-50 resistance-zone prior to witnessing the 100-day SMA, near 86.20. If the pair continues trading up after breaking the 86.20, the 88.00 – 88.20, adjacent to the 200-day SMA level of 89.50, are likely levels that can confine the pair's following advance. Meanwhile, 81.30 and the 79.70 are the expected downside numbers that could hold the pair's south-run, breaking which the 61.8% FE of its November 2014 – August 2015 downside, coupled with the channel support, near 77.80-70, becomes an important support for the pair traders to look for. If the drops below 77.70, it become vulnerable to test 75.00 round figure mark.


“Original analysis is provided by Admiral Markets
 
Technical Overview: EURUSD, EURGBP, EURJPY and EURNZD

EURUSD


While short-term ascending trend-line presently restricts the EURUSD downturn, the 1.0900 and the descending trend-line resistance, coupled with 38.2% Fibonacci Retracement of its August – December downside, near 1.0970 – 1.0980, quickly followed by the 100-day SMA, near 1.0990 and the 1.1000 psychological magnet, could confine the pair's near-term up-move. Should it manage to clear the 1.1000, the five month old descending trend-line, around 1.1070 now, becomes a strong upside level for the pair, breaking which it can rally to 50% Fibo, near 1.1120, and the 1.1200 round figure mark. On the downside, a clear break of 1.0800 mark, encompassing the mentioned trend-line support and the 23.6% Fibo, can drag the pair to 1.0700 and the 1.0630 support levels prior to making it weaker enough to test the December lows of 1.0520-25. Moreover, the pair's sustained decline below 1.0520, it can plunge to 1.0400 support level.

EURGBP


Following its pullback from the two month old ascending trend-channel resistance, the EURGBP seems presently struggles near the 61.8% Fibonacci Retracement Level of its November 2014 – July 2015 downside. As the northward trending channel favors the pair's up-move, a break of 0.7615-20 can propel its rise towards 0.7700; however, the mentioned channel resistance, at 0.7745-50 now, might restrict it further advances. If the pair surpasses 0.7750, it pair bulls can fuel it to 0.7850-60 upside area prior to targeting 0.7900 and the December 2014 highs of 0.8000 psychological magnet. Though, failure to surpass the immediate resistance, coupled with bearish momentum, might drag the pair to channel support of 0.7530-25, clearing which 0.7485 – 0.7500 horizontal support-turned-resistance, also including the 50% Fibo, could limit its further downside. Should the pair plunges below 0.7485, it can quickly drop to 0.7380 and the 0.7300 levels during its sustained south-run.

EURJPY


Even if the EURJPY bounced-off from its April 2015 lows near 126.00, the 128.70-80 horizontal-line resistance caps the pair's immediate rise. If the pair manage to clear the 128.80, the 129.70-80, followed by the 50-day SMA, near 130.60, are likely consecutive resistances that it might look for while pair's further advances beyond 130.60 may find it difficult to surpass 132.50-60 resistance-zone, encompassing 100-day SMA and the five month old descending trend-line resistance. Alternatively, a daily close below 61.8% FE of its June – November downside, at 127.40, can fetch the pair to re-test its recent lows, also marked in April, around 126.00. Should the pair continued extending its southward trajectory below 126.00, chances of its plunge to 123.00 round figure mark, also including 100% FE, can't be denied.

EURNZD


Failure to break the 1.7250-70 horizontal resistance dragged the EURNZD towards testing 1.6500 support; though, a bounce from the same presently pulls the pair towards 1.6900, breaking which it could aim for breaking the mentioned resistance-line. If the pair manages to clear 1.7270, it can quickly rise to 1.7500 mark prior to testing the 23.6% Fibonacci Retracement of its April – August rise, near 1.7550 while sustained up-move beyond 1.7550 can fuel the pair to 1.7900 and the 1.8000 round figure mark resistance levels. Meanwhile, 1.6500 might continue restricting the pair's immediate decline, breaking which 1.6330, indicating 50-day SMA, and the 50% Fibo, near 1.6280, are likely important support levels for the pair. Given the pair's continued south-move below 1.6280, nine-month old ascending trend-line support, near 1.6050, represents the critical number that the pair traders should watch, breaking which the pair can plunge to 61.8% Fibo, near 1.5700 level.


“Original analysis is provided by Admiral Markets
 
Technical Update - GBPUSD, AUDUSD, NZDUSD and USDCAD

GBPUSD


After dropping to the lowest level since Mar. 2009, the pair witnessed minor recovery from near-term oversold conditions. The bounce-back from lower levels, however, seems to confront resistance at a short-term ascending trend-line near 1.4360-70 area. This ascending trend-line resistance, along with another ascending trend-line support near 1.4220 area, seems to constitute towards a short-term bearish Rising Wedge chart-pattern formation on 1-hourly chart. Hence, a decisive break below the lower ascending trend-line support is likely to accelerate the fall back towards 1.4100 round figure mark support. Meanwhile, sustained move back above 1.4300-1.4310 area might continue to face strong resistance at the upper ascending trend-line resistance near 1.4360-70 region. Only a sustained strength above this strong resistance might negate expectations of any further near-term weakness for the pair and assist it to extend the bounce from multi-year lows, beyond 1.4400 round figure mark, towards its next major resistance near 1.4500-20 area.

AUDUSD


On 4-hourly chart, the pair seems to form a bullish reversal, Inverted Head & Shoulders pattern, with the neck-line resistance near 0.7040-50 zone. A clear break-through this important resistance would confirm the pattern, thus opening room for continuation of the pair's upward trajectory in the near-term. Above 0.7040-50 resistance, could easily move back towards testing its next major resistance near 0.7200 level, with 0.7110-20 area acting as intermediate resistance. On the downside, inability to clear its immediate resistance and a subsequent weakness below 0.7020-0.7000 mark might force the pair to retest the very important 0.6950-40 support area, forming shoulder of the bullish pattern. Failure to hold 0.6950 important support might negate the bullish formation, making it vulnerable to extend its downward trajectory back towards 0.6850-40 recent closing lows support.

NZDUSD


On daily chart, the pair seems to have formed a short-term bearish, Double-Top chart pattern near 0.6880-0.6900 strong resistance zone. The pair, however, has managed to find some intermediate support near 0.6400 round figure mark. Hence, from current levels a sustained weakness below 0.6400 mark would confirm the bearish pattern, making the pair vulnerable to drop back towards testing 2015 closing lows support near 0.6250-40 area before extending its weakness further towards 0.6070-60 support, marking 61.8% Fib. expansion level. Meanwhile, strength above 0.6500-0.6520 immediate horizontal resistance is likely to boost the pair back towards its next strong resistance near 0.6700 level, which if conquered seems to assist the pair to head back towards retesting the very important resistance near 0.6880-0.6900 area.

USDCAD


The pair witnessed a sharp profit taking move from the highest level since Apr. 2003, tested in the week gone-by, and is currently trading below 23.6% Fib. retracement level of its up-move from Oct. 2015 lows to multi-year highs. From current levels, the pair seems more likely to extend its near-term corrective move, towards 38.2% Fib. retracement level support near 1.3970 level. The fall could further get extended towards a very strong support near 1.3800-1.3750 region, comprising of 50-day SMA and also nearing 50% Fib. retracement level. On the upside, 1.4150 level now seems to act as immediate resistance. Strength above 1.4150 resistance is likely to be followed by a further up-move, but is likely to be capped at 23.6% Fib. retracement level resistance near 1.4240-50 zone. Only a sustained strength above 1.4240-50 resistance might negate the near-term bearish outlook and lift the pair back above 1.4500 mark, towards the recent daily closing highs resistance near 1.4560-80 region.


“Original analysis is provided by Admiral Markets
 
Back
Top