Technical Analysis by Admiral Markets

Technical Outlook: Important JPY Pairs

USDJPY


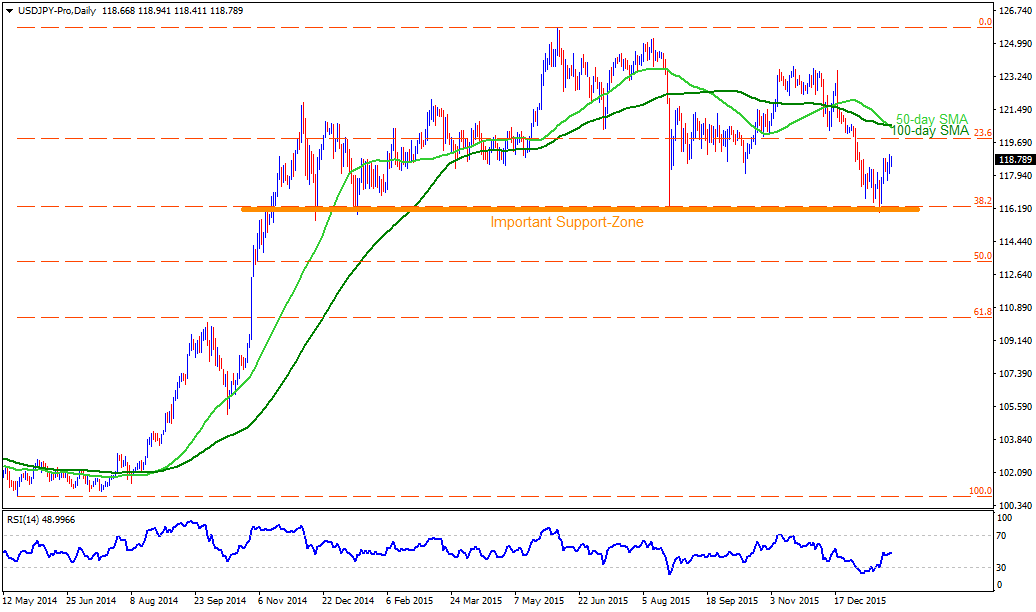
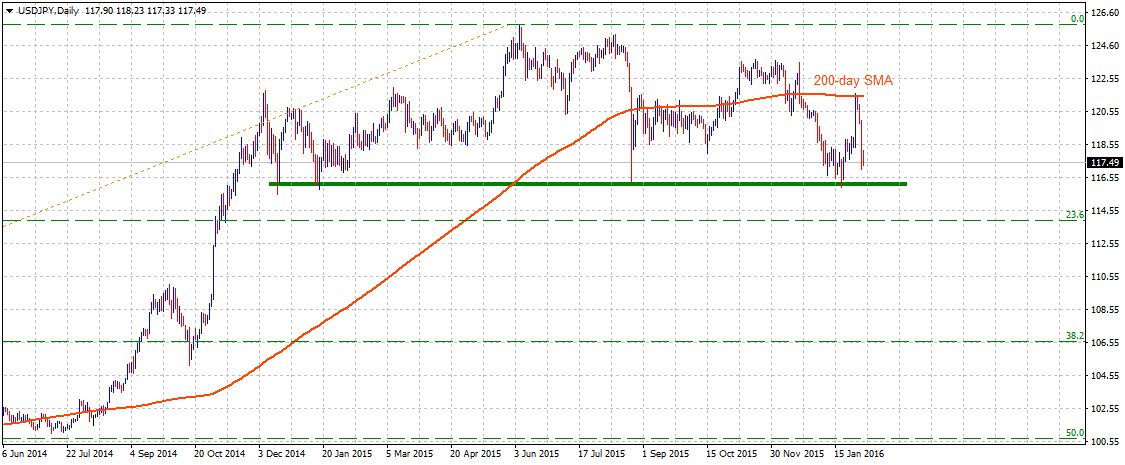
With yet another bounce from the 116.20 – 116.00 horizontal support-zone, encompassing 38.2% Fibonacci Retracement of its May 2014 – June 2015 upside, the USDJPY seems all set to confront the 120.00 round figure mark, nearing the 23.6% Fibo level; however, 50-day & 100-day SMA confluence, near 120.50-60 area, can confine the pair's further advances. Should the pair manage to clear 120.60 on a closing basis, it can quickly rise to 121.85 – 122.00 region, breaking which 123.70-80 is likely important upside numbers that the pair traders can watch. Though, pair's inability to sustain the recent pullback can again fetch it to 117.50 immediate support, breaking which it can be dragged down to 116.20 – 116.00 zone. If the pair drops below 116.00, it becomes weaker enough to test 114.00 mark prior to resting near 113.30, including 50% Fibo while further downside below 113.30 opens the door for the pair's slide towards 110.00 mark, which encompasses 61.8% Fibo level.

AUDJPY


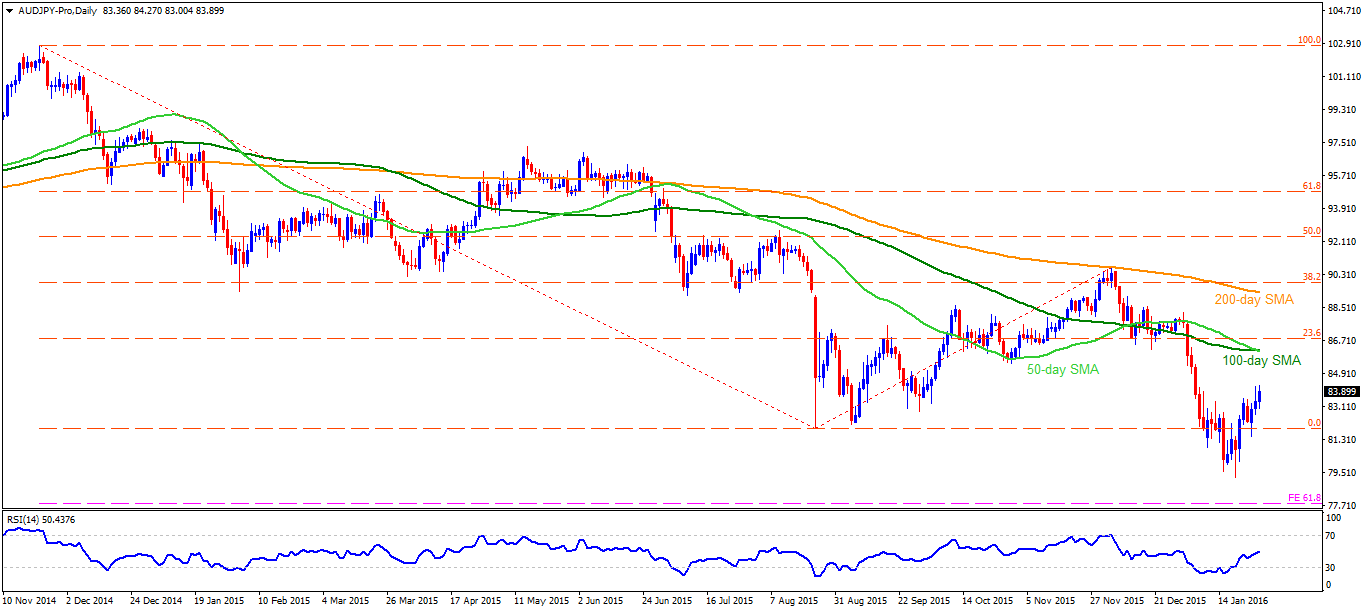
AUDJPY's recovery from 79.50-40 area seems currently struggling near the 84.00 mark, which if broken, can propel the pair to 85.30-40 and to the 86.15-20 zone which comprises of 50-day & 100-day SMA. Given the pair's ability to surpass 86.20, it becomes capable enough to target 88.00 round figure mark; though, pair's extended rise beyond 88.00 might be capped by 200-day SMA level of 89.30, breaking which it can rally to 90.70-80 region. On the downside, 82.70 and the August lows of 81.90 are likely nearby supports for the pair to break before it could re-test the 81.30 and the 79.50-40 zone. Moreover, pair's continued downside below 79.40 can drag it down to 61.8% FE level of 77.80.

CADJPY


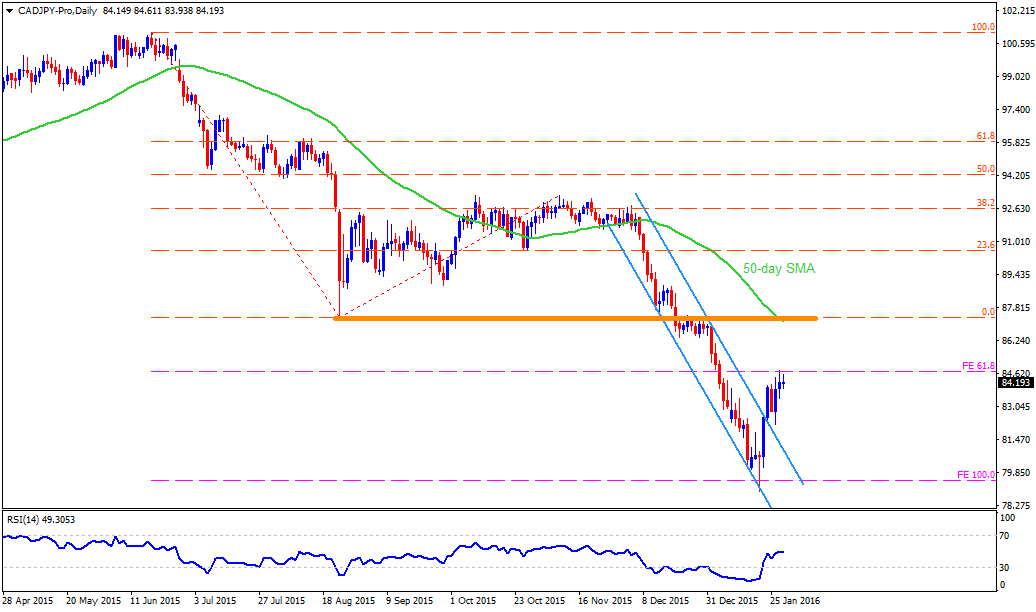
While bounce from two-month old descending trend-channel, coupled with 100% FE of June – August 2015 downside, fueled the CADJPY towards breaking the channel resistance, the pair currently holds its breath near 61.8% FE level of 84.70, breaking which it can rise to 86.30 while an extended up-move beyond 86.30 can propel it to 87.20-40 support-zone, including 50-day SMA & August lows. If the pair manages to clear 87.40, it can stretch the north-run to 88.80 – 89.00 area. Meanwhile, the pair's pullback from the present levels can be confined by the 82.50 immediate support, breaking which renewed downside pressure can drag the pair to 81.00 and the 100% FE level of 79.40. If at all the pair continue dipping below 79.40, chances of its plunge to 76.50 can't be denied.
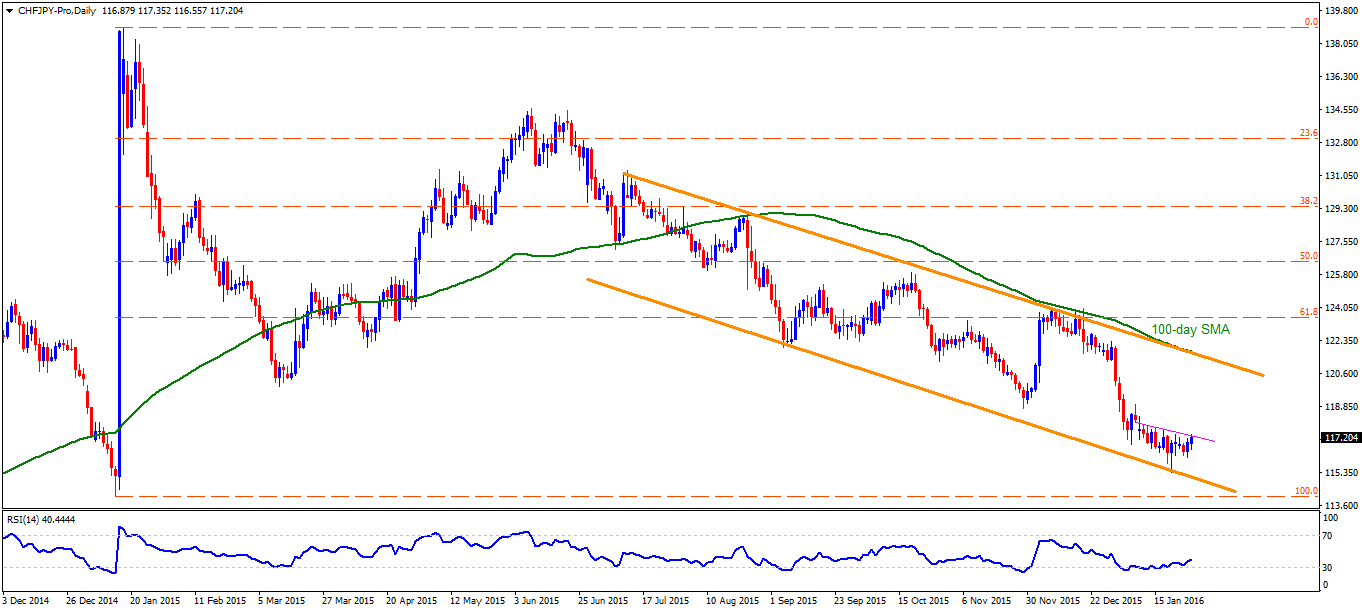
CHFJPY


Even if the CHFJPY manage to bounce from six month old descending trend-channel support, descending trend-line resistance, near 117.15-20, restricts the pair's immediate advances. Should the pair surpass 117.20 on a closing basis, 119.00 and the 120.40-50 are expected consecutive upside numbers that the pair bears might have to wait for before the important 121.60-70 zone, including 100-day SMA and the channel resistance, give rise to chances of fresh pullback by the pair. Alternatively, 116.00 might entertain the immediate short-side of the pair, breaking which the channel support, presently at 115.00, followed by the January lows of 114.00, are likely important support numbers that the pair might hold. If the pair continue on its southward trajectory below 114.00, it can revisit the October 2014 lows, around 111.00 mark.


“Original analysis is provided by Admiral Markets
 
Technical Outlook - GBPJPY, GBPCAD, GBPAUD and GBPNZD

GBPJPY


Slowly and gradually the pair seems to attempt a recovery alongside a short-term ascending trend-line support. This ascending trend-line support along with the pair's immediate resistance near 170.00 psychological mark, also coinciding with 23.6% Fib. retracement level of Nov. 2015 to Jan. 2016 downfall, seems to form a bullish Ascending triangle on 4-hourly chart. Hence, a sustained strength above 170.00 mark is likely to assist the pair in extending its near-term recovery trend, initially towards 171.20-30 intermediate horizontal resistance before heading towards 173.10-30 resistance marked by 38.2% Fib. retracement level. On the downside, the short-term ascending trend-line support, currently near 169.30-20 area, might continue to protect immediate downside. Failure to hold this immediate support would negate the bullish triangular formation and is likely to drag the pair immediately towards 167.00 support area.

GBPCAD


On daily chart, the pair seems to have formed a bearish Double-Top chart pattern near 2.0950 level. The pattern, however, is not confirmed until the pair decisively breaks below an important support near 1.9800 horizontal zone. Meanwhile from current levels, 200-day SMA near 1.9950 region closely followed by 38.2% Fib. retracement level of Apr. to Aug. 2015 upswing (1.9900 area), seems to provide immediate downside support. Sustained weakness below these immediate support levels and subsequent drop below 1.9750 support would confirm the bearish pattern, thus opening room for continuation of the pair's downward trajectory in the near-term. On the upside, move above 2.0190-2.0200 mark is likely to confront resistance at 23.6% Fib. retracement level near 2.0300 round figure mark. Strength above 2.0300 mark, leading to momentum above 2.0350 level, has the potential to continue boosting the pair towards an intermediate strong resistance near 2.0550 region.

GBPAUD


Extending its reversal within a well-established descending trend-channel formation on daily chart and a subsequent weakness below 200-day SMA points to continuation of the pair's near-term downward trajectory. The near-term depreciating move is likely to gain momentum below 2.0110-2.0100 immediate horizontal support, which if broken might continue dragging the pair towards testing the lower trend-line support of the channel, currently near 1.9950-30 area. Meanwhile on the upside, 38.2% Fib. retracement level, near 2.0380-2.0400 mark, seems to act as immediate resistance. Sustained move above 2.0400 mark, leading to additional strength beyond 2.0500 mark, might now assist the pair towards retesting the very important 200-day SMA resistance, currently near 2.0790-2.0800 area. The 200-day SMA resistance also nears the upper trend-line resistance of the channel, currently near 2.0830-40 area, and hence is likely to cap any further near-term up-move for the pair.

GBPNZD


Even as the pair managed to hold 61.8% Fib. retracement level support of its Apr. to Aug. up-move, it failed to move back above the very important 200-day SMA. Moreover, 50-day SMA has now crossed below the 200-day SMA, forming a bearish death cross. The occurrence of death-cross is pointing towards continuation of the pair's downward trajectory. Hence from current levels, weakness below 2.2000 mark is likely to accelerate towards 2.1750 horizontal support, which could further get extended towards 61.8% Fib. retracement level support near 2.1550-30 area. Further, a decisive weakness below 2.1550 support has the potential to continue dragging the pair towards its next major support near 2.1000 psychological mark. On the upside, 50% Fib. retracement level near 2.2230-50 zone, also nearing 50-day SMA (currently near 2.2280 level) are likely to act as immediate strong resistance levels. Any attempts of clearing these immediate resistance levels are likely to be capped at the very important 200-day SMA, currently near 2.2650-60 area.


“Original analysis is provided by Admiral Markets
 
Technical Check - AUDNZD, NZDCAD and NZDJPY

AUDNZD


Extending its bounce from the very important support near 1.0500 mark, within a short-term ascending trend-channel formation on 4-hourly chart, the pair reclaimed 1.0900 mark to test the upper trend-line resistance of the channel. From current levels, till the pair continues holding above 1.0900 mark, it seems to make a fresh attempt to retest the upper trend-line resistance of the channel, currently near 1.0980-90 area. A clear break-through the ascending trend-channel resistance sets the stage for an accelerated up-move towards its next major resistance near 1.1100 mark. Alternatively, weakness below 1.0900 mark is likely to get extended till 1.0840 intermediate horizontal support, which if broken is likely to drag the pair towards testing the lower trend-line support of the channel, currently near 1.0800 round figure mark. Failure to hold the ascending trend-channel support is likely to increase the pair's vulnerability to drop back towards 1.0700 mark horizontal support.

NZDCAD


The pair's reversal from a descending trend-line resistance near 0.9550-60 area seems to have found support at the lower trend-line support of a descending trend-channel formation on daily chart. This descending trend-channel along with the pair's sharp recovery from the lowest level since Sept. 2013, touched in Aug. 2015, seems to constitute towards formation of a bullish continuation, Flag chart-pattern. Meanwhile from current level, move above 0.9170-80 immediate horizontal resistance is likely to confront resistance near 0.9250-60 area, marking 23.6% Fib. retracement level of Aug. to Dec. 2015 sharp up-move. This is followed by resistance at the upper trend-line of the descending channel, currently near 0.9300-0.9320 area, which if cleared has the potential to lift the pair back towards 0.9550-60 strong resistance area. On the downside, 38.2% Fib. retracement level near 0.9075-70, closely followed by the lower trend-line of the channel, currently near 0.9020 level, seems to protect immediate downside for the pair. Decisive break below the descending trend-channel might now negate the bullish continuation pattern, thus making the pair vulnerable to extend its corrective move in the near-term.

NZDJPY


After decisively breaking through an important resistance near 77.30-50 area, marking 38.2% Fib. retracement level of Dec. 2015 high to Jan. 2016 downfall, the pair immediately rallied and is currently hovering around 78.50 region, marking 50% Fib. retracement level. Considering the sustained break-out of a short-term trading range and a subsequent strength above 50% Fib. retracement level, the pair from current levels seems to make an attempt to test its immediate strong resistance confluence near 79.50 region, comprising of 100-day SMA and 61.8% Fib. retracement level. Further, should the momentum continue beyond this strong resistance, the pair might continue marching higher towards the very important 200-day SMA strong resistance, currently near 81.90-82.00 mark. On the downside, 78.00 round figure mark now seems to protect immediate downside. Below 78.00 mark, the pair seems to drift back towards the 38.2% Fib. retracement level resistance break turned support near 77.30-25 region, which now seems to act as a well-established bottom in the near-term.


“Original analysis is provided by Admiral Markets
 
Technical Check: AUDCAD, EURCAD and CADCHF

AUDCAD


Even as the descending trend-line, joining December highs to January highs, fetched the AUDCAD down to test the 50-day SMA for the first time since November 2015, an upward slanting trend-line stretched from early December, coupled with the mentioned SMA and 38.2% Fibonacci Retracement of its November – December 2015 up-move, presently near 0.9880 – 0.9900 area, favored the pair's bounce, indicating a quick test to 1.0000 psychological mark. However, the pair's further advances beyond 1.0000 might find it difficult to break the mentioned trend-line resistance, near 1.0040 now, which if broken, can propel its north-run to 1.0100 and then to December high of 1.0170 prior to targeting 61.8% FE of the said move, near 1.0270. Meanwhile, 0.9880 – 0.9900 continue providing strong downside support to the pair, breaking which it can quickly drop to 0.9800 round figure mark, comprising 50% Fibo level. Should the pair maintain its downturn intact after breaking 0.9800 mark, the 61.8% Fibo, near 0.9715-20 area, and the 0.9650, are likely consecutive levels that it might witness before expecting the 0.9500 support level.

EURCAD


Following the EURCAD's reversal from important 1.6100 – 1.6115 resistance region, comprising upper-line of the two month old ascending trend-channel and more than a year old upward marking trend-line, the pair dropped below mentioned channel-support and is now likely to test 1.5160-50 immediate support-zone. Given the pair's extended downside below 1.5150, it can test 50-day SMA, near 1.5000 psychological magnet, and the 1.4920-50 support-area, including 38.2% Fibonacci Retracement of its April 2015 – January 2016 advance. Moreover, a closing break of 1.4920, also defeating the 1.4900 mark, might drag the pair further down to 50% Fibo level, at 1.4565. Alternatively, pair's bounces from the current levels have to clear 1.5450 and the channel support-now-resistance level of 1.5600 mark prior to expecting 1.5750 and the 1.5930 resistances. Moreover, pair's successful rise beyond 1.5930 may have to counter early month high of 1.6105 and the trend-line resistance, now at 1.6155, in order to rise towards 1.6500 area.

CADCHF


CADCHF's north-run from 0.6800 area fueled the pair towards testing the highest levels in more than a month; however, 0.7250-60 horizontal resistance region, including 50-day SMA, quickly followed by the 50% Fibonacci Retracement of its November 2015 – January 2016 downside, at 0.7275, might restrict the pair's near-term advances. Should the pair manage to surpass 0.7275, the pair can stretch its northward trajectory to 0.7320 and the 0.7400 round figure mark. If the pair continue rising beyond 0.7400, the 0.7470 and the 0.7530 are likely consecutive resistances that it could witness during its up-move to 0.7600 resistance level. On the downside, the pair's incapacity to clear mentioned resistance region can fetch it to 38.2% Fibo level of 0.7160, breaking which 0.7060 and the 0.7015 may hold the pair's further decline. If at all the pair plunges below 0.7015, it can re-test the early month lows of 0.6800 mark with 0.6950 being intermediate rest point.


“Original analysis is provided by Admiral Markets
 
Technical Overview: GBPUSD, EURGBP, GBPAUD and GBPNZD

GBPUSD


Even if the GBPUSD managed to bounce from 1.4100 – 1.4080 support-area, as reflected form the short-term ascending trend-channel, pair's downside from 1.5230 portrays a possible "Flag" pattern, a bearish technical formation, which can be confirmed on the break of 1.4160. However, 61.8% FE of its July 2014 – June 2015 downside, around 1.4300, followed by the 1.4200 round figure mark, are likely immediate support levels that the pair might test during its pullback. Given the pair's drop below 1.4160, it becomes more likely to ignore the 1.4100 – 1.4080 zone and can plunge to 1.3850-40 support-region prior to targeting the 2009 lows around 1.3500 mark. Alternatively, the channel resistance, or say the "Flag" upper-line, near 1.4460, might continue acting as nearby resistance for the pair, breaking which the bearish pattern gets negated and the pair can quickly rise to 38.2% Fibonacci Retracement of its December – January downside, near 1.4525-30, before accelerating the advance to 50% Fibo level, near 1.4655-60. Should the pair maintains its north-run beyond 1.4660, it becomes capable enough to challenge the 1.4800 mark, near the 61.8% Fibo, with 1.4730 being a buffer resistance.

EURGBP


Following the pullback from two month old ascending trend-channel resistance, the EURGBP's near-term up-move seems confined by the short-term descending trend-line, at 0.7615-20 now; however, another upward slanting trend-line, connecting the recent lows, together with the mentioned channel support, near 0.7560 – 0.7540 area, becomes strong downside support for the pair. If the pair keep respecting the trend-channel and breaks 0.7620 immediate resistance, it can easily advance to 0.7690 – 0.7700 region ahead of testing the channel resistance of 0.7785-90, which if broken, can propel the pair's north-run to 0.7900 mark. Moreover, pair's successful up-move beyond 0.7900 can favor its hike towards 0.8050 and the 0.8150 upside levels. Meanwhile, the descending trend-line's ability to keep pushing down the pair prices can force it to break the 0.7540 and test the 0.7420-15 zone while sustained decline below 0.7415, also clearing the 0.7400 mark, can fetch the pair towards 0.7300 re-test.

GBPAUD


While break of immediate descending trend-channel resistance, presently at 2.0410, can quickly propel the GBPAUD towards 2.0580, the three month old descending trend-line, around 2.0780, might hold the pair's near-term up-moves captive. Should it manage to clear the 2.0780, the 2.1000 – 2.1020 area, encompassing the 100-day SMA and five month old downward slanting trend-channel, becomes strong upside resistance for the pair to clear, which if broken, can enable it to target 2.1220-30 zone. On the downside, 2.0100 can act as nearby support for the pair, dipping below confluence of the short-term descending trend-channel and the broader downward slanting trend-channel support, near 1.9940-30, can hold its further downside. If the pair fails to bounce from 1.9930, the 61.8% FE of its September 2015 – January 2016 decline, near 1.9780, might provide intermediate halt to the pair's southward trajectory towards 1.9660-50 support region.

GBPNZD


GBPNZD's bounce from 2.1700 again fetches the pair prices to test the descending trend-channel resistance, which has been restricting its up-move since last five months. Importance of the mentioned channel upper-line has now been magnified as it also accompanies the 50-day SMA and the 50% Fibonacci Retracement of its April – August 2015 up-move, near 2.2240-50 area. Should the pair witnesses the pullback from current prices, 2.1830 and the 2.1700 mark are expected nearby supports that it could test while a break below 2.1700 can fetch it to 61.8% Fibo, near 2.1530 and the downward trending line support, near 2.1130. However, further downside by the pair below 2.1130 is likely to be limited by the channel support of 2.0400 mark. If at all the pair manages to clear the strong resistance and closes above 2.2250 mark, it can quickly rise to 200-day SMA, near 2.2700, before targeting the 38.2% Fibo level of 2.2930. Moreover, pair's sustained north-run beyond 2.2930 can strengthen it to expect 2.3100 and the 2.3380 – 2.3400 resistance area.


“Original analysis is provided by Admiral Markets
 
Technical Update - EURUSD, USDCAD, AUDUSD and USDCHF

EURUSD


Extending its near-term range-bound move, the pair continues to face difficulty in clearing 100-day SMA resistance, currently near 1.0970 region, and now also coinciding with 38.2% Fib. retracement level of Aug. 2015 highs to Dec. 2015 lows down-leg. Also on the downside, the pair has managed to hold the lower end of the trading range support at 23.6% Fib. retracement level near 1.0800-1.0790 region. In order to determine the near-term trajectory, the pair needs to decisively break through this trading range. A sustained strength above 1.0970 immediate resistance confluence seems to lift the pair immediately towards 1.1100-15 resistance area, marking 50% Fib. retracement level. Alternatively, a decisive weakness below 1.0800 mark support has the potential to drag the pair back towards 1.0650-30 intermediate horizontal support before the drops further towards retesting 1.0500 mark in the near-term.

USDCAD


The pair extended its sharp profit-taking move to test 1.3900 mark, nearing 50-day SMA support. The pair has now recovered a bit to move back above 1.4000 psychological mark. In order to register further recovery, the pair needs to sustain above 1.4050 level, which if cleared is likely to boost the pair towards 1.4140-50 horizontal resistance. Momentum above 1.4150 resistance is likely to be followed by a further up-move towards next major resistance at 23.6% Fib. retracement level resistance near 1.4240-50 zone. Meanwhile, weakness back below 1.4000-1.3980 immediate support might continue finding support at 50-day SMA, currently near 1.3900-1.3880 region. However, should the pair fail to hold the 50-day SMA support it could immediately drop to test a very important support around 1.3800 mark, nearing 50% Fib. retracement level.

AUDUSD


On 4-hourly chart, the pair has moved within a short-term ascending trend-channel formation and is now trading close to the lower trend-line support of the channel, currently near 0.7040 level. Rebound from current support level and a subsequent strength above 0.7060 horizontal resistance is likely to reaffirm the channel, lifting the pair immediately towards 0.7120-25 intermediate support before extending its up-move towards testing the upper trend-line resistance of the channel, currently near 0.7200 mark. Alternatively, a decisive break below the trend-channel support is likely to drag the pair immediately towards 0.7000 psychological mark. Subsequent weakness below 0.7000 mark might force the pair back towards testing 0.6920-0.6900 mark support and downfall could further get extended towards its recent closing lows support near 0.6850 region.

USDCHF


Extending its upward trajectory within a short-term ascending trend-channel formation on 4-hourly chart, the pair is now trading back above 1.0200 mark. From current levels, the pair seems to extend the up-move towards testing the upper trend-line resistance of the channel, currently near 1.0280-1.0300 zone with 1.0240 level acting as intermediate resistance. On the downside, sustained weakness below 1.0200-1.0190 immediate horizontal support is likely to get extended towards testing the lower trend-line support of the channel, currently near 1.0125-1.0120 area. Only a decisive break below this important trend-channel support might negate continuation of the pair's near-term upward trajectory.


“Original analysis is provided by Admiral Markets
 
Technical Check - Important NZD Pairs

NZDUSD


On 4-hourly chart, the pair seems to have moved within a short-term ascending trend-channel formation. However, 50% Fib. retracement level of Dec. 2015 highs to Jan. 2016 lows downfall, near 0.6600 mark, seems to act as immediate resistance. Should the pair manage to clear this immediate resistance, it seems to immediately aim towards its next major resistance near 0.6675-80 confluence region, comprising of the upper trend-line resistance of the channel and 61.8% Fib. retracement level. On the downside, 38.2% Fib. retracement level, near 0.6550-45 zone, seems to protect immediate downside. Weakness below this immediate support is likely to get extended towards testing the lower trend-line support of the channel, currently near 0.6470-60 area, also coinciding with 23.6% Fib. retracement level. Further, a break below this strong support now seems to trigger resumption of the pair's weakening trend, dragging it back below 0.6400 mark towards retesting sub-0.6300 level support, marking 61.8% Fib. expansion level.

NZDJPY


Extending its break-out momentum beyond 38.2% Fib. retracement level of Dec. 2015 high to Jan. 2016 downfall, the pair tested an important resistance confluence near 79.50 area, comprising of 100-day SMA and 61.8% Fib. retracement level. However on 4-hourly chart, the pair seems to be in the process of forming a short-term bearish Rising Wedge chart pattern, with the lower ascending trend-line support near 78.00 mark. A decisive weakness below 78.00 mark, thus confirming the bearish pattern, seems to drag the pair back towards 38.2% Fib. retracement level resistance break turned support near 77.30-25 region, which if broken is likely to extend the downfall towards retesting sub-75.00 level support. On the upside, 79.50 confluence area might continue to act as immediate resistance. This is closely followed a strong resistance, marked by another ascending trend-line forming part of the bearish pattern, near 80.00 psychological mark. Only a sustained strength above 80.00 mark might negate the bearish pattern, thus paving way for further near-term recovery for the pair.

NZDCAD


The pair's reversal from 0.9550-60 resistance area managed to find strong support near 0.9060-40 confluence region, comprising of the lower trend-line support of a descending trend-channel formation on daily chart and 38.2% Fib. retracement level of Aug. to Dec. sharp up-move. The descending trend-channel along with the pair's sharp recovery from Aug. 2015 lows, seems to constitute towards formation of a bullish continuation, Flag chart-pattern with immediate upside resistance at the upper trend-line of the channel and 23.6% Fib. retracement level confluence region, near 0.9250-60 zone. Should the pair manage to conquer this immediate strong resistance, thus confirming the bullish continuation pattern, it could immediately move back towards 0.9550-60 strong resistance area. Meanwhile on the downside, 0.9150 now seems to protect immediate downside. On a sustained weakness back below 0.9150 support, the pair could drop back to test 38.2% Fib. retracement level intermediate support near 0.9060-50 area, before dropping further towards testing the lower trend-line support of the channel, currently near 0.9000 psychological mark.

AUDNZD


Even as the pair extended its recovery from 1.0500 mark strong support within a short-term ascending trend-channel, it failed to conquer the very important 200-day SMA. The pair subsequently has decisively broken below the ascending trend-channel and hence from current levels seems vulnerable to extend its downward trajectory towards 1.0620-10 horizontal support. Below 1.0600 mark, the pair might continue drifting lower to retest the very important psychological mark support near 1.0500 region. On the upside, the ascending trend-channel break-point, near 1.0780-90 area, now seems to act as immediate resistance. Although move above this immediate resistance could get extended, but is likely to be capped at the very important 200-day SMA resistance, currently near 1.0900 round figure mark. Only a sustained strength above 200-day SMA might negate the near-term bearish outlook for the pair.


“Original analysis is provided by Admiral Markets
 
Important AUD Pairs: Technical Outlook

EURAUD


Repeated failures to surpass more than five month old descending trend-line resistance dragged the EURAUD down to ascending trend-line support, stretched from December lows, during early weekdays. However, bounce from the same support-line seems favoring the pair's present pullback to 1.5600 mark, breaking which the 1.5670 – 1.5700 area becomes a strong upside resistance-zone for the pair to clear before it could rally to 23.6% Fibonacci Retracement of its April – August rally, near 1.5900 round figure mark; though, the pair's further up-move beyond 1.5900 can again confront with the mentioned trend-line resistance, around 1.6040-50, surpassing which, chances of the pair's north-run to 1.6250 can't be denied. On the downside, 100-day SMA, at 1.5350 now, quickly followed by the trend-line support, near 1.5320, are likely immediate supports for the pair traders to watch. Given the daily closing below 1.5320, the pair can drop to 50% Fibo, near 1.5140-35, which if broken can magnify the pair's south-run to test sub-1.5000 region, by being around the 1.4970 support level.

AUDJPY


Having reversed from 86.00 – 86.20 resistance confluence, encompassing 50-day and 100-day SMA, the AUDJPY is likely declining to 23.6% Fibonacci Retracement Level of its May 2015 – January 2016 downside, at 83.50; however, pair's further south-move below 83.50, may have to break 81.50-40 support-zone before targeting the early month lows of 79.20. Given the pair's sustained decline below 79.20, also clearing the 79.00 mark, it can plunge to 78.00 and 77.00 support levels prior to testing the June 2012 lows around 74.30. Meanwhile, the mentioned SMA confluence, also including the 38.2% Fibo, around 86.00 – 86.20, can continue limiting the pair's near-term advance, surpassing which it could quickly rise to 87.30 and the 50% Fibo, near 88.30 upside levels. If the pair continues moving up following its break of 88.30, the 89.00 might act as an intermediate resistance during its north-run to 91.00 resistance mark.

AUDCAD


Even as the AUDCAD closed below 50-day SMA for the first time since early November during Tuesday, an ascending trend-line, joining lows marked during December 2015 and January 2016, continue limiting the pair's further south-run. Should the pair drops below mentioned support-line, presently at 0.9860-50, it can immediately test the 0.9750-40 area, clearing which 50% Fibonacci Retracement of its September – December 2015 upside, near 0.9660-50, and the 0.9580, are likely consecutive downside numbers that the pair might witness. Alternatively, a daily close above 50-day SMA level of 0.9915 may have to clear the 0.9950 and a month old downward slanting trend-line resistance, around 1.0015-20, in order to aim for 1.0100. If the pair manages to surpass 1.0100 on a closing basis, it can easily ignore the December 2015 highs of 1.0170 and can aim for 1.0230-50 resistance-region.

AUDCHF


While another pullback from the two-month old descending trend-line resistance dragged the AUDCHF towards breaking immediate support-line, the pair bounced back from 0.7130 support and is currently struggling near the 50% Fibonacci Retracement of its December 2015 – January 2016 downside. If the pair fails to extend its pullback and drops below 0.7130 nearby support, the 38.2% Fibo, at 0.7090-85, can offer an important downside area for the pair to trigger the bounce, failing to which can fetch the prices towards 0.7000 psychological magnet. Should the pair continues declining below 0.7000, it becomes vulnerable enough to re-test the early month lows around 0.6800 mark. On the upside, a clear break of its 0.7200 immediate resistance can again propel the pair to challenge the mentioned trend-line resistance, also including the 61.8% Fibo, around 0.7250-60, breaking which 0.7320 and the 0.7360 are expected intermediate resistances that the pair might witness before the seventeen month old descending trend-line, near 0.7385 – 0.7400, could limit it's further advance.


“Original analysis is provided by Admiral Markets
 
Technical Outlook - USDJPY, GBPJPY, EURJPY and CHFJPY

USDJPY


Although the pair rebounded sharply from an important support near 116.00 mark, the momentum failed to assist the pair in clearing the very important 200-day SMA resistance, near 121.45-50 area. The pair has subsequently moved back towards 117.00 mark. Reversal from 200-day SMA resistance area and a subsequent weakness back below 117.00 mark is likely to drag the pair back towards 116.00 mark important support. Further, a decisive break below 116.00 mark has the potential to continue dragging the pair towards testing sub-114.00 mark support representing 23.6% Fib. retracement level of its big up-move from Oct. 2011 lows to multi-year highs touched in May 2015. On the upside, move above 118.00 round figure mark might now confront strong resistance near 118.50 horizontal area. However, a decisive strength above this immediate strong resistance has the potential to lift the pair back towards retesting the very important 200-day SMA resistance near 121.50 region.

GBPJPY


The pair seems to build-on to its near-term recovery within a short-term ascending trend-channel. The pair is currently trading close to the lower trend-line support of the channel, near 172.00 round figure mark. Failure to hold this immediate support is likely to drag the pair back towards retesting 170.00 psychological mark support. Alternatively, a bounce from current support area and a subsequent strength above 172.50 level is likely to boost the pair back beyond 173.50 intermediate horizontal resistance, towards 174.50-60 resistance area. Further, sustained momentum above 174.50 resistance has the potential to continue supporting the prospects of additional near-term recovery for the pair. Above 174.50 resistance, the pair could make an attempt towards testing the upper trend-line resistance of the channel, currently near 176.80-177.00 mark, also coinciding with 50-day SMA.

EURJPY


The pair's managed to hold and rebound from the lower trend-line support of a well-established descending trend-channel formation on daily chart. The rebound now seems to confront immediate resistance near 131.80-132.00 mark, representing 38.2% Fib. retracement level of June 2015 to Jan. 2016 downfall. Even if the pair manages to clear this immediate resistance, it is likely to confront resistance at the upper trend-line resistance of the descending channel, currently near 132.50-60 area. A decisive break-through the trend-channel resistance now seems to open room for further near-term recovery towards 50% Fib. retracement level resistance near 133.50-60 area, which could get extended towards testing 200-day SMA strong resistance, currently near 134.30-50 region. Meanwhile on the downside, weakness below 131.00-130.80 area is likely to get extended towards 130.00 psychological mark support, also nearing 23.6% Fib. retracement level. Failure to hold 130.00 mark support, the pair is likely to resume its downward trajectory and head towards testing the lower trend-line support of the channel, currently near 125.60-50 area.

CHFJPY


Even as the pair has managed to bounce from the lower trend-line support of a well-established descending trend-channel, it seems to struggle in registering any meaningful recovery beyond 119.00 round figure mark. Hence, from current levels weakness back below 117.00-116.80 immediate support is likely to force the pair back towards retesting the lower trend-line support of the channel, currently near 115.50 region. Further, on a sustained trade below the trend-channel support is likely to increase the pair's vulnerability to continue drifting lower towards testing its next major support near 114.00 mark in the near-term. Meanwhile, any attempts of recovery beyond 118.00-20 area might continue to face resistance near 119.00 mark. However, a decisive strength above 119.00 mark is likely to trigger a follow-up buying interest, lifting the pair back towards the very important resistance confluence near 121.50 region, comprising of 100-day SMA and the upper trend-line resistance of the descending trend-channel.


“Original analysis is provided by Admiral Markets
 
Technical Update: EURCHF, GBPCHF, NZDCHF And CADCHF

EURCHF


Even as the EURCHF's rally from 1.0750-60 fueled the pair towards marking the highest level in more than a year, upper-line of the "Rising-Wedge" bearish technical formation, coupled with the 61.8% Fibonacci Retracement of its December 2014 – January 2015 downside, around 1.1190 – 1.1200 region, might hold the pair's further up-move captive and could trigger a pullback towards 1.1100 – 1.1090 immediate support-zone. Given the pair drops below 1.1090, it can quickly test the 1.0980 mark before the 1.0900 – 1.0860 broad support-area, including 50% Fibo, 50-day and 100-day SMA, coupled with the support-line of the mentioned technical pattern, give rise to its another bounce. If at all the pair fails to reverse from 1.0860, the bearish formation gets confirmed, indicating the pair's plunge to sub-1.0600 region. On the upside, sustained trading above 1.1200 opens the door for the pair's gradual advance towards the January levels of 1.2000 with 1.1380, 1.1400 and the 1.1800 being intermediate halts.

GBPCHF


Following its bounce from 1.4150-40 horizontal support-region, the GBPCHF managed to print a month's high; though, the pair's up-move seems scaled back by the 50-day SMA, presently at 1.4760, which if broken, may propel the pair to conquer with the 200-day SMA mark, at 1.4810 now, before testing the 38.2% Fibonacci Retracement level of its May – November up-move, 1.4900. Moreover, sustained trading above 1.4900 enables the pair to rally towards 1.5100 – 1.5110 resistance-zone. Given the pair reverses from the current levels, the 61.8% Fibo, near 1.4490-85 can offer immediate downside support to the pair, breaking which it can test the 1.4485 and the 1.4380 support levels before witnessing the 1.4300 mark. Further, sustained downside below 1.4300 can fetch the pair to re-test the 1.4150-40 important support area, clearing which chances of its plunge to May 2015 lows, near 1.3815, becomes brighter.

NZDCHF


While NZDCHF's recovery from 0.6350-45 helped marking it fresh high for a month, the resistance-line of a possible "Rising-Wedge" bearish technical formation, near 0.6740-50, can continue holding the pair's up-move captive. Should it reverses from the current levels, the 0.6680 can provide nearby support to the pair before fetching it to the pattern support of 0.6630. However, break of 0.6630 confirms the pair's bearish formation and can drag the pair prices down to 0.6500 area, clearing which can extend its southward trajectory towards 0.6440 and the 0.6350-45 support-zone. Alternatively, break of 0.6750 negates the downturn favoring pattern and can fuel the pair to 0.6800 immediate resistance, breaking which 0.6860-70 becomes an important resistance for the pair traders to watch. Given the pair's strength propels it beyond 0.6870, the 0.6930 might act as a small halt during the pair's north-run to 0.7170-80 resistance-zone.

CADCHF


CADCHF's reversal from 0.6800 has been confined within a rectangle formation since a week's time wherein the upper-line of the formation, coupled with the 100-day SMA, seems presently holding the pair's advance around 0.7340-45. If the pair clears the 0.7345, 61.8% Fibonacci Retracement of its November 2015 – January 2016 advance, at 0.7385, can confine the pair's further up-move, breaking which 0.7475 is likely an intermediate resistance which if broken can open the door for the pair's north-run to 0.7610 and the November highs, nearing 0.7700 resistance mark. Meanwhile, pullbacks from the present level can make the pair witness 50% Fibo level of 0.7270 and the formation support of 0.7210, breaking which 38.2% Fibo, near 0.7150 and the 0.7060 could be the numbers that the pair traders should be aware off. Moreover, pair's sustained downtrend below 0.7060 can trigger fresh round of selling which can fetch it to re-test the January lows around 0.6800 with 0.6980 being a buffer support.


“Original analysis is provided by Admiral Markets
 
Back
Top