Admiral Markets
AdmiralMarkets.com Representative
- Messages
- 95
Technical Overview: Important CHF Pairs
USDCHF
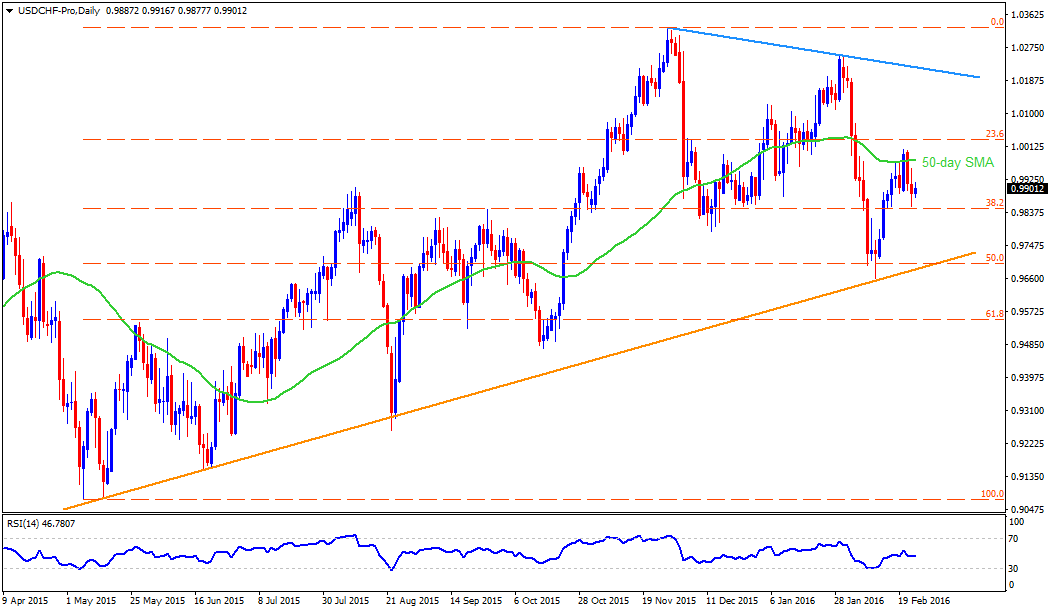
Failure to drop below nine month old ascending trend-line propelled the USDCHF to print a fresh high of the month; though, the pair failed to decisively break above 50-day SMA and witnessed pullback moves to test the 38.2% Fibonacci Retracement Level of its May – November 2015 advance. Even if the pair presently struggles between the 38.2% Fibo level of 0.9850-45 and the 50-day SMA mark of 0.9975, comparative strength of the CHF's safe-haven demand favors more of its downside towards 0.9800 mark. Should the pair breaks the 0.9800 on a closing basis, the 0.9700 – 0.9680 support-zone, comprising the mentioned trend-line and the 50% Fibo, could limit its further south-run. If at all the pair closes below 0.9680, it becomes weaker enough to test the 61.8% Fibo level of 0.9550 and the 0.9470 support levels. On the upside, a clear break above 0.9975 may favor the pair's rise to 1.0030, the 23.6% Fibo, and the 1.0120 resistance levels before it could witness three month old descending trend-line resistance of 1.0220 – 1.0230 area. Moreover, pair's ability to surpass 1.0230 enables it to challenge the November 2015 highs of 1.0328.
EURCHF
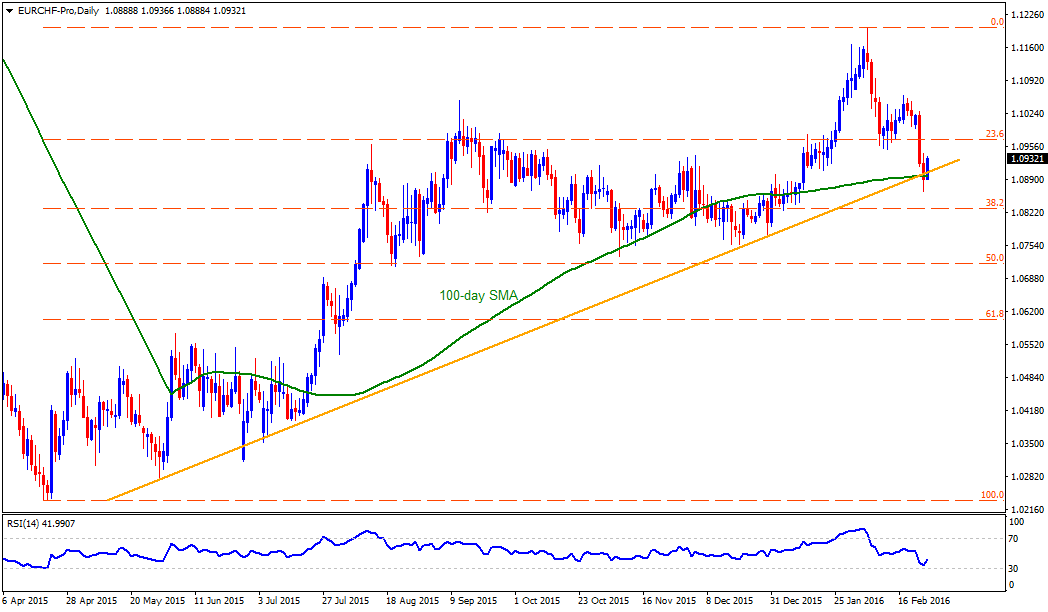
Even as the EURCHF's inability to clear 1.1200 dragged it down to the lowest levels in more than a month, the pair failed to close below 1.0900 – 1.0895 important support-zone, encompassing 100-day SMA and the nine-month old ascending trend-line, indicating brighter chances of its pullback to 1.0950 immediate resistance. If the pair manages to extend its profit-booking moves beyond 1.0950, the 1.1000 and the 1.1050-60 are likely consecutive upside levels that it could witness prior to rallying towards 1.1100 and the 1.1160, which if broken can open the door for its northward trajectory beyond current month highs of 1.1200. Alternatively, a close below 1.0895 can quickly drag the pair to 38.2% Fibonacci Retracement level of its April 2015 – February 2016 rally, around 1.0830, clearing which 1.0750 might act as intermediate support during its decline to 50% Fibo level of 1.0715. Moreover, pair's sustained downtrend below 1.0715 can further signal 1.0680 and the 1.0575-80 support numbers.
GBPCHF
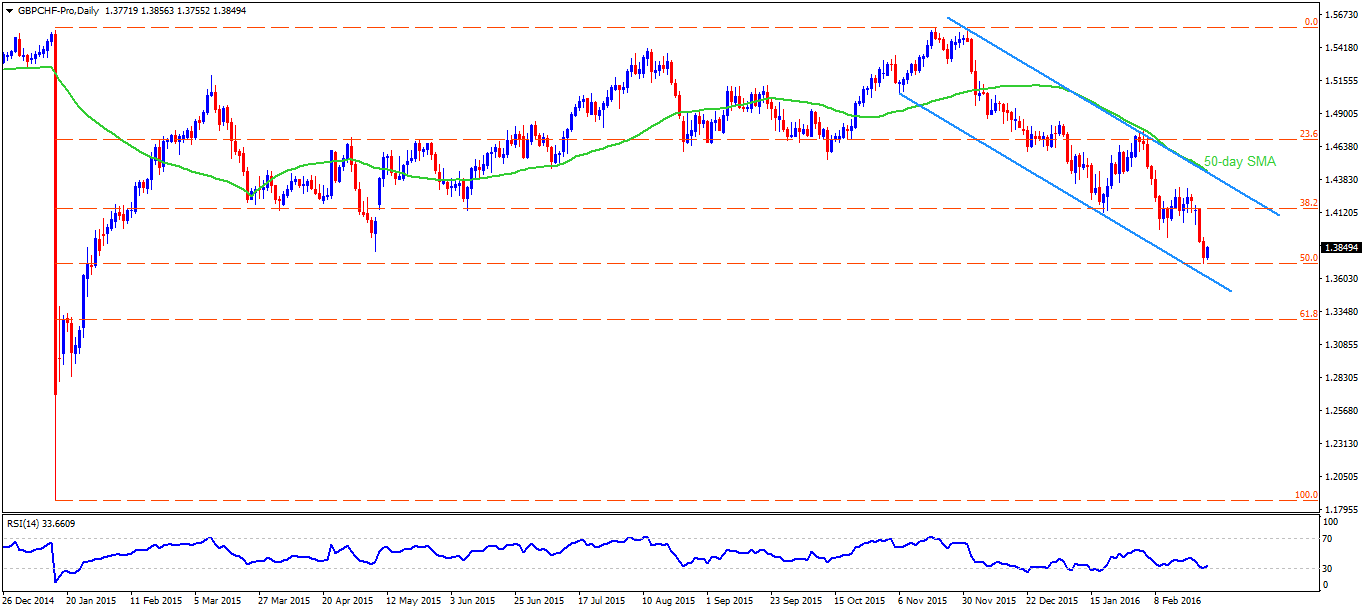
While more than three month old descending trend-channel continues signaling further downside by the GBPCHF, 50% Fibonacci Retracement level of the pair's January – November 2015 advance, near 1.3710, followed by the channel support-line, at 1.3610 now, can provide chances of the pair's pullback to 1.3900 immediate resistance. If the pair surpasses 1.3900 mark, the 1.4115-20 region, including 38.2% Fibo, and the 1.4300 round figure mark might act as intermediate resistances before the pair could witness 1.4430-40 important resistance-zone, including 50-day SMA and the channel resistance. If at all the pair manages to close above 1.4440, chances of its quick rise to 1.4600 can't be denied. However, pair's drop below the channel support of 1.3610, also clearing the 1.3600 mark, can fetch the pair prices to 1.3340 and the 61.8% Fibo level of 1.3280. Should the pair continue on its southward move below 1.3280, it becomes vulnerable to test the 1.3000 psychological magnet.
CHFJPY

CHFJPY's nine month old downturn, as portrayed by the descending trend-channel, might find it difficult to clear the 111.40-20 area which encompasses more than two year old horizontal support and the lower-line of mentioned channel, indicating pair's short-covering moves to 114.30 immediate resistance. Should the pair continue rising beyond 114.30, the 38.2% Fibonacci Retracement of its July 2012 – January 2015 upside, near 115.80, and the 118.00, are likely consecutive upside levels that it could witness before the channel resistance-line near 120 psychological magnet restrict its further advance. Meanwhile, pair's inability to respect the 111.20 mark, also closing below 111.00 can drag the pair to 109.80 prior to testing the 50% Fibo level of 108.60. If the pair keep declining below 108.60, the 107.30 and the 105.00 are expected buffer supports that it might rest at before finding multiple supports between 103.20 – 103.00 area.
“Original analysis is provided by Admiral Markets”
USDCHF

Failure to drop below nine month old ascending trend-line propelled the USDCHF to print a fresh high of the month; though, the pair failed to decisively break above 50-day SMA and witnessed pullback moves to test the 38.2% Fibonacci Retracement Level of its May – November 2015 advance. Even if the pair presently struggles between the 38.2% Fibo level of 0.9850-45 and the 50-day SMA mark of 0.9975, comparative strength of the CHF's safe-haven demand favors more of its downside towards 0.9800 mark. Should the pair breaks the 0.9800 on a closing basis, the 0.9700 – 0.9680 support-zone, comprising the mentioned trend-line and the 50% Fibo, could limit its further south-run. If at all the pair closes below 0.9680, it becomes weaker enough to test the 61.8% Fibo level of 0.9550 and the 0.9470 support levels. On the upside, a clear break above 0.9975 may favor the pair's rise to 1.0030, the 23.6% Fibo, and the 1.0120 resistance levels before it could witness three month old descending trend-line resistance of 1.0220 – 1.0230 area. Moreover, pair's ability to surpass 1.0230 enables it to challenge the November 2015 highs of 1.0328.
EURCHF

Even as the EURCHF's inability to clear 1.1200 dragged it down to the lowest levels in more than a month, the pair failed to close below 1.0900 – 1.0895 important support-zone, encompassing 100-day SMA and the nine-month old ascending trend-line, indicating brighter chances of its pullback to 1.0950 immediate resistance. If the pair manages to extend its profit-booking moves beyond 1.0950, the 1.1000 and the 1.1050-60 are likely consecutive upside levels that it could witness prior to rallying towards 1.1100 and the 1.1160, which if broken can open the door for its northward trajectory beyond current month highs of 1.1200. Alternatively, a close below 1.0895 can quickly drag the pair to 38.2% Fibonacci Retracement level of its April 2015 – February 2016 rally, around 1.0830, clearing which 1.0750 might act as intermediate support during its decline to 50% Fibo level of 1.0715. Moreover, pair's sustained downtrend below 1.0715 can further signal 1.0680 and the 1.0575-80 support numbers.
GBPCHF

While more than three month old descending trend-channel continues signaling further downside by the GBPCHF, 50% Fibonacci Retracement level of the pair's January – November 2015 advance, near 1.3710, followed by the channel support-line, at 1.3610 now, can provide chances of the pair's pullback to 1.3900 immediate resistance. If the pair surpasses 1.3900 mark, the 1.4115-20 region, including 38.2% Fibo, and the 1.4300 round figure mark might act as intermediate resistances before the pair could witness 1.4430-40 important resistance-zone, including 50-day SMA and the channel resistance. If at all the pair manages to close above 1.4440, chances of its quick rise to 1.4600 can't be denied. However, pair's drop below the channel support of 1.3610, also clearing the 1.3600 mark, can fetch the pair prices to 1.3340 and the 61.8% Fibo level of 1.3280. Should the pair continue on its southward move below 1.3280, it becomes vulnerable to test the 1.3000 psychological magnet.
CHFJPY
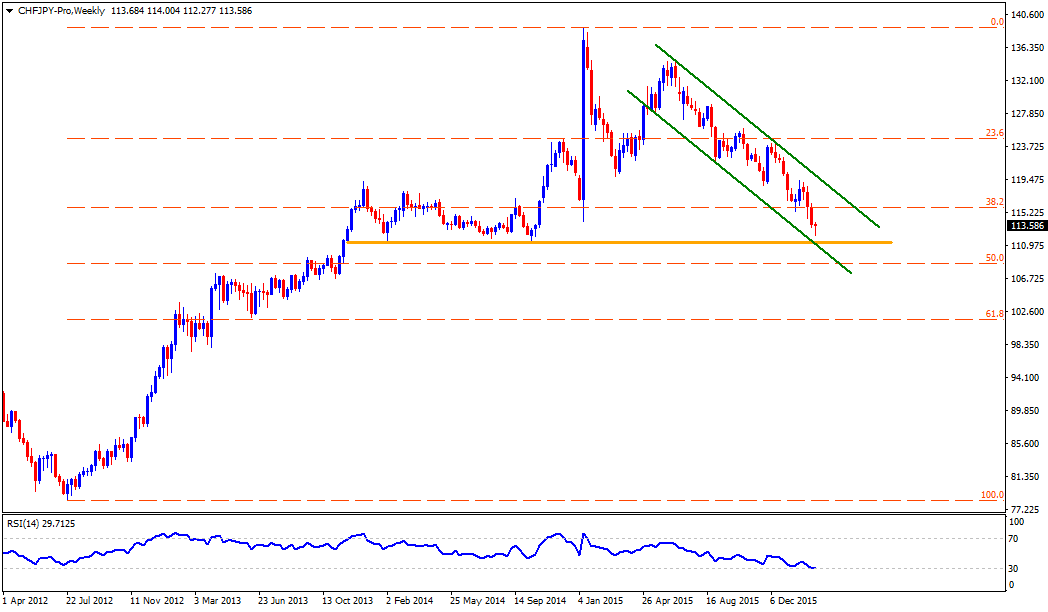
CHFJPY's nine month old downturn, as portrayed by the descending trend-channel, might find it difficult to clear the 111.40-20 area which encompasses more than two year old horizontal support and the lower-line of mentioned channel, indicating pair's short-covering moves to 114.30 immediate resistance. Should the pair continue rising beyond 114.30, the 38.2% Fibonacci Retracement of its July 2012 – January 2015 upside, near 115.80, and the 118.00, are likely consecutive upside levels that it could witness before the channel resistance-line near 120 psychological magnet restrict its further advance. Meanwhile, pair's inability to respect the 111.20 mark, also closing below 111.00 can drag the pair to 109.80 prior to testing the 50% Fibo level of 108.60. If the pair keep declining below 108.60, the 107.30 and the 105.00 are expected buffer supports that it might rest at before finding multiple supports between 103.20 – 103.00 area.
“Original analysis is provided by Admiral Markets”