Technical Analysis by Admiral Markets

EURNZD, AUDNZD and GBPNZD: Technical Check
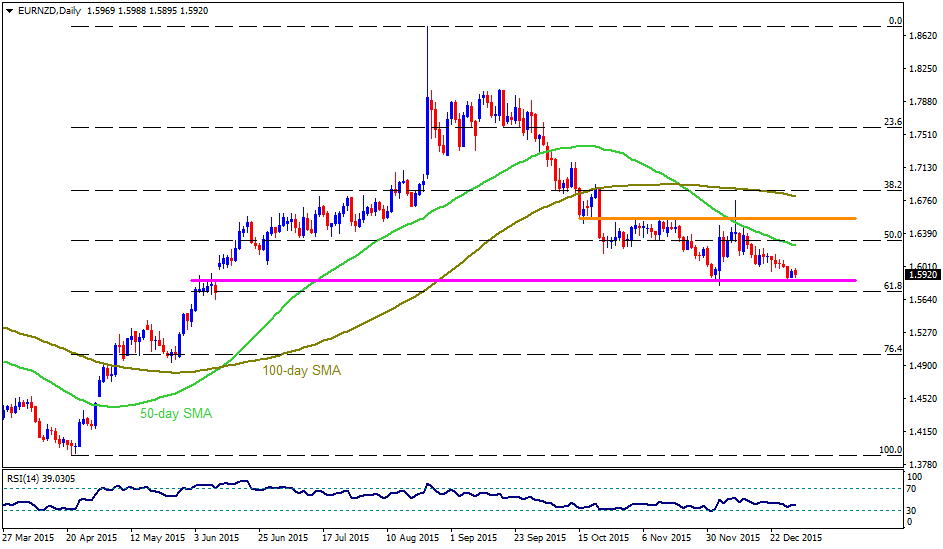
EURNZD


EURNZD's reversal from August highs seems finding it difficult to break the 1.5850-40 horizontal support; however, another straight-line, connecting October lows to November highs, around 1.6540-50, controls the pair's near-term upside while sustained trading below 50-day SMA favors brighter chances for the pair's break of mentioned support-line and a swift decline to 1.5720-15, comprising 61.8% Fibonacci Retracement of its April – August up-move. Should it extend the downside below 1.5715, also dips below 1.5700 round figure mark, the pair may plunge to 1.5500 – 1.5490 area prior to witnessing 1.5285-80. Moreover, sustained south-run below 1.5280 can make the pair weaker enough to join the 1.4920 – 1.4900 support-zone. Meanwhile, pair's bounce from the current trend-line support, as it did during early December, needs to surpass 1.6000 psychological magnet in order to test the 1.6150-55 and the 50-day SMA of 1.6250, quickly followed by the 50% Fibo of 1.6300. If it successfully clears 1.6300, the 1.6370-80 can act as an intermediate resistance for the pair before re-testing the 1.6540-50 resistance-line. Given the pair's ability to accelerate the north-move beyond 1.6550, it can find multiple resistances between 100-day SMA, near 1.6810 and the 38.2% Fibo, near 1.6870.

AUDNZD


Although corrective moves from 1.1065, encompassing 38.2% Fibonacci Retracement of its April – August rise, fetched the AUDNZD towards 1.0560-50 mark, the pair failed to extend its downside below eight month old ascending trend-line, indicating a bounce to 1.0700 – 1.0720 immediate resistance-zone. Though, pair's further advance beyond 1.0720 might confront 1.0785-90, as indicated by the 50-day SMA, and the 50% Fibo, near 1.0860, prior to aiming for the descending trend-line resistance, near 1.0945-50. If the pair manages to clear 1.0950, it can quickly rise to 1.1060-65, the 38.2% Fibo, and then rally towards the 1.1200 round figure mark. On the downside, the pair's break below 1.0600, also clearing the 1.0560-50, could find 1.0500 horizontal-line as a strong support before testing the 76.4% Fibo, near 1.0415-10. Moreover, extended downside below 1.0410 can fetch the pair to 1.0200 mark with 1.0300 – 1.0295 being an intermediate support.
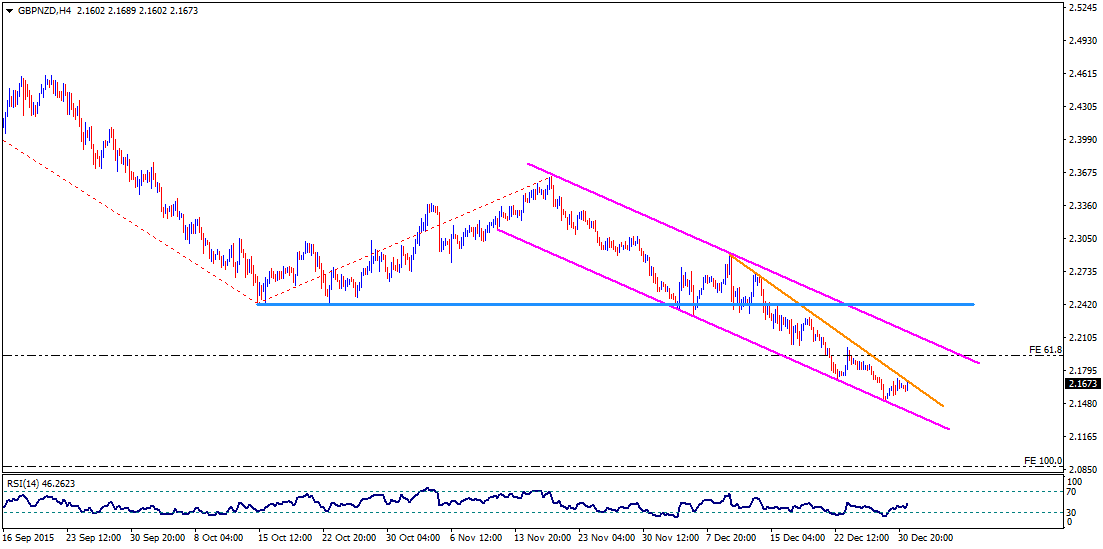
GBPNZD


Even if a month old descending trend-channel aptly plots the GBPNZD downside following its reversal from 1.3650, the pair continues to struggle near the channel support, presently around 2.1410 and is confronting the short-term descending trend-line, at 2.1700. Considering repeated attempts to bounce from channel support chances are brighter than the pair could clear 2.1700 and swiftly rise to 2.1800 and the 61.8% FE of its August – October downside, near 2.1930. If the pair keep rising beyond 2.1930, the 2.2030 may act as an intermediate resistance for the pair's run to channel resistance-line of 2.2150-55, breaking which it can quickly advance to 2.2420-30 horizontal resistance. Alternatively, pair's dip below 2.1410 – 2.1400 may make the pair's magnified downside to 2.1300 and 2.1100 round figure marks before it could aim for the 100% FE level of 2.0880.


“Original analysis is provided by Admiral Markets
 
Technical Outlook - GBPCAD, AUDCAD and CADJPY

GBPCAD


On 4-hourly chart the pair is continues to grind lower within a short-term descending trend-channel. Along-with the pair's sharp up-move from Dec. lows, the descending trend-channel seems to be forming a bullish continuation Flag chart-pattern. Hence, from current levels, although the pair could possibly drift lower towards testing the lower trend-line support of the channel, currently near 2.0440-30 area, but eventually the pair seems to resume its near-term upward trajectory. Extension of the near-term up-move would, however, be confirmed only once the pair decisively conquers the upper trend-line resistance of the channel, currently near 2.0720-30 area. Immediate upside resistance is pegged near 2.0610-20 region. A decisive break-through the short-term descending trend-channel is likely to boost the pair immediately towards testing a very strong resistance near 2.0920-40 area, marking highs tested in Aug. and Dec. 2015.

AUDCAD


Since the beginning of Nov. 2015, the pair has witnessed a sharp up-move within a well-established ascending trend-channel formation and is now trading at the highest level since Sept. 2014. Any further up-move from current levels is likely to face immediate resistance at the upper trend-line resistance of the channel, currently near 1.0200-1.0220 area. On the downside, 1.0100 region seems to have emerged as immediate support for the pair. Failure to hold 1.0100 horizontal support seems to drag the pair towards testing the lower trend-line support of the channel, currently near 1.0030-20 region. Only a sustained break below the ascending trend-channel support might negate possibilities of any further up-move for the pair and drag it lower towards testing an important resistance break-point now turned support near 0.9800 region.

CADJPY


Extending its downward trajectory within a well-established descending trend-channel, the pair has now decisively weakened below an important support near 87.50 region. Hence, from current levels the pair seems vulnerable to continue drifting lower towards testing the lower trend-line support of the channel, currently near 84.50 level, with 86.00 round figure mark and 85.60-50 area acting as intermediate support areas. On the upside, move above 87.00 round figure mark might now face immediate resistance at the important support break-level near 87.50 region. Sustained strength above this immediate resistance has the potential to lift the pair further towards its next major resistance near 88.90-89.00 zone, which now seems to cap near-term upside for the pair.


“Original analysis is provided by Admiral Markets
 
Technical Outlook: EURUSD, GBPUSD, USDJPY and AUDUSD

EURUSD


Having breached its 1.0800 – 1.0790 horizontal support, the EURUSD seems all set to test 1.0660 – 1.0650 support area, quickly followed by the 1.0600 round figure mark support. Given the pair's continued downside following 1.0600 break, it can drop to 1.0550 and the 1.0500 downside levels prior to aiming the March month lows around 1.0460. Moreover, sustained south-run below 1.0460 can make the pair vulnerable enough to test 1.0200 mark, including 61.8% FE of its October 2014 – March 2015 decline. Meanwhile, the 1.0790 – 1.0800 could continue offering immediate resistance to the pair, breaking which 1.0900 and the 1.1000 psychological number are likely consecutive resistances that the pair might look for while extended upside above 1.1000 could find it difficult to break 1.1030-50 area, encompassing 100-day SMA and the 23.6% Fibonacci Retracement of the said move. Should the pair manage to clear 1.1050 on a closing basis, chances of its rise to 1.1230 becomes brighter while 1.1100 may become an intermediate halt.

GBPUSD


Even if the GBPUSD trades near eight months low, short-term "Falling Wedge" support, presently around 1.4600, repeatedly provides pullback to the pair prices. If the pair again bounces from the support-line, the 1.4700 can act as immediate resistance, breaking which 1.4730 and the formation resistance, near 1.4750, followed by the 61.8% FE of its September – December 2015 downside, near 1.4770, can restrict the pair's near-term upside. However, a clear break of 1.4770 confirms the bullish technical formation and can trigger the pair's north-move to 1.4900, prior to witnessing 1.4950-60 resistance-zone. On a further up-move beyond 1.4960, the pair becomes capable enough to surpass 1.5030 and test the 1.5100 round figure mark. On the downside, break of 1.4600 negates the bullish pattern and can magnify the pair's south-run to April 2015 lows of 1.4560 prior to testing the 1.4480 level, comprising 100%b FE of the said move. Moreover, successive decline following 1.4480 break opens the door for its further southward trajectory towards 2010 lows around 1.4200 round figure mark.

USDJPY


Although short-term descending trend-channel portrays near-term downside of the USDJPY, the 118.20 – 118.00 support area, including the channel support, can restrict the pair's additional decline, favouring a pullback to 118.80 and the 119.00 – 119.10 immediate resistances. However, sustained break of 61.8% Fibonacci Retracement of its August - November upside, around 119.10, may find 119.50 and the channel resistance near 120.00 psychological magnet, as strong levels during its north-move. Given the pair's capacity to break 120.00 on a closing basis, it can quickly rise to 120.50 and the 121.00 consecutive resistances prior to looking at the 121.60-70 resistance-region. Alternatively, pair's inability to hold the south-run around 118.00 can make it vulnerable enough to test August lows of 116.13 while 117.00 may provide a buffer support.

AUDUSD


AUDUSD's break of four month old ascending trend-channel signals the pair's quick decline to 0.7030-25 horizontal support, clearing which it can be dragged down to 0.6970 and the September lows around 0.6910 before targeting the 61.8% FE of its June – September downside, near 0.6800 – 0.6795. Should it continue extending the southward trajectory below 0.6795, the pair might crash to 0.6600 horizontal support area. On the contrary, pair's pullbacks from the horizontal support-zone can witness 0.7110 – 0.7100, including the channel support, as an immediate resistance and a daily close above it nullifies the recent dip, helping the pair's progress to 100-day SMA, presently at 0.7170, the 0.7250 and the 0.7375-80 upside levels. Given the pair's ability to clear 0.7380 on a closing basis, it can rise to 0.7450-60 prior to aiming the test of channel resistance, near 0.7530, which is followed by the 0.7600 horizontal resistance area.


“Original analysis is provided by Admiral Markets
 
Technical Outlook - EURJPY, AUDJPY, NZDJPY and CHFJPY

EURJPY


After failing to extend its rebound from the lower trend-line support of a well-established descending trend-channel, beyond 100-day SMA, the pair resumed its near-term downward trajectory and has now decisively broken below the descending trend-channel. Although the pair has managed to find some support near 127.00-126.80 area, marking 2015 daily closing lows, any recovery from current levels is likely to face immediate resistance at the descending trend-channel support break-point now turned immediate resistance near 128.50 region. Further recovery momentum beyond 128.50 now seems capped at 130.00 psychological mark. Meanwhile, sustained weakness below 2014 closing lows support seems to open room for extension of the pair's depreciating move towards testing its next major support near 122.00-121.80 zone in the near-term. Intermediate support is pegged near 123.50-123.30 horizontal area.

AUDJPY


Reversal from the very important 200-day SMA and a subsequent break below 100-day SMA has dragged the pair back towards 82.00 mark, representing a multi-year lows tested in Aug. 2015. Weakness below 82.00 mark might now accelerate the fall towards its historic support near 79.50-30 region and downfall could further get extended towards its next major support near 78.00 mark support. Meanwhile on the upside, bounce from 82.00 mark support is likely to gain momentum above 83.00 mark, which seems to boost the pair towards an intermediate strong resistance near 84.70-75 horizontal zone. Further, decisive strength above 84.70-75 intermediate resistance, the pair is likely to extend the bounce-back towards its next major resistance near 87.00 round figure mark.

NZDJPY


The pair's momentum above 100-day SMA failed to lift it beyond a very important resistance confluence near 83.00 level, comprising of 200-day SMA and 50% Fib. retracement level of April to August downfall. The pair has now dropped back below 100-day SMA and is now within striking distance of its immediate support near 77.50-30 area, marking 23.6% Fib. retracement level. Failure to hold this immediate support might now increase the pair's vulnerability to extend its downward trajectory initially towards 75.50 intermediate support level before heading towards 2015 daily closing lows support near 74.60-50 area. Furthermore, sustained weakness below 74.50 level now opens room for continuation of the pair's depreciating move, possibly even below Aug. 2015 lows support near 72.20 level, towards testing 61.8% Fib. expansion level support near 70.00 psychological mark. Alternatively, move above 78.50 immediate horizontal resistance has the potential to lift the pair back towards retesting 100-day SMA resistance, currently near 79.40-60 region.

CHFJPY


After repeated failures to conquer a strong resistance confluence, comprising of 100-day SMA and the upper trend-line resistance of a well-established descending trend-channel, the pair has now dropped to the lower trend-line support of the channel near 117.00 mark. A decisive break below the trend-channel support now seems to open room for further near-term downward trajectory towards its next major support near 112.50-40 area with 113.70-50 area acting as intermediate support. Alternatively, a bounce back from the trend-channel support and a subsequent move above 118.00 mark has the potential to lift the pair back towards 119.00 mark. Further a sustained strength above 119.00 mark seems to assist the pair in extending the bounce back towards reclaiming 120.00 psychological mark and head towards its next major resistance near 121.00 horizontal area.


“Original analysis is provided by Admiral Markets
 
Technical Overview: Important CAD Pairs

USDCAD


Following its trading near 1.3800, during year-end less volatile sessions, the USDCAD extended the strong up-move during first full week of 2016, fueling it to test the highest level since July 2003; however, seven months old ascending trend-channel resistance, coupled with the 100% FE of its June – September advance, around 1.4175 – 1.4200 area, can provide strong upside resistance to the pair. Should it clear the 1.4200 on a closing basis, which also includes May – July 2003 highs, chances of its rally to 1.4550-60 and to the 1.4900 region can't be denied. Though, pair's inability to surpass mentioned crucial resistance, backed by overbought RSI, can quickly fetch it to 1.4000 psychological magnet, breaking which 1.3800 is likely following downside level for the pair traders to watch. If the pair extends the profit-booking move below 1.3800, the 61.8% FE, near 1.3650, and the 1.3500, are expected intermediate support during the pair's re-test of 1.3350-20 important support-zone, encompassing 100-day SMA and the support-line of channel. Moreover, pair's inability to hold 1.3320 can make it vulnerable enough to test 1.3000 round figure mark.

EURCAD


Having bounced from 23.6% Fibonacci Retracement of its April – August 2015 advance, the EURCAD seems all set to test 1.5420-30 horizontal resistance, which acts as a barrier for the pair before it could rise to August highs of 1.5560. Should the pair continue rallying beyond 1.5560, the 1.5600 round figure mark is likely an immediate upside level for it to clear prior to targeting 1.5730-40, break of which opens the door for the pair's north-move to 1.6000 area. Alternatively, pullbacks from the current level can drag the pair down to 1.5165-55 immediate support-zone, dipping below indicates the pair's test to 1.5000 and the 23.6% Fibo, near 1.4960 level. Moreover, the pair's sustained downside below 1.4960, can witness 1.4900 and the 1.4800 consecutive levels prior to targeting 100-day SMA, near 1.4730 and the 38.2% Fibo, near 1.4600.

GBPCAD


Even if the short-term descending trend-line favors pullback on the part of GBPCAD, the 100-day SMA, presently near 2.0310 – 2.0300, can limit the pair's immediate downside, failing to which the pair might extend its corrective move towards 2.0100 and the 2.0030-20 area before testing the 1.9790 - 1.9800 important horizontal support, which also comprises 200-day SMA. Should the pair dips below 1.9800 on a closing basis, the "double-top" formation gets confirmed, making the pair vulnerable enough to plunge to 1.9200 area. On the flipside, a break above 2.0700 immediate trend-line can trigger the pair's up-move to 2.0800 and the recent highs around 2.0950-70. If the pair manages to close above 2.0970, also clears the 2.1000 round figure mark, it becomes capable enough to rally towards 61.8% FE of its April – August 2015 rally, near 2.1500 while 2.1280 – 2.1300 may act as a buffer stop during the north-run.

AUDCAD


Sustained break of two-month old ascending trend-channel favors the AUDCAD decline to 0.9840-30 immediate horizontal support; though, 38.2% Fibonacci Retracement of its September – December up-move, near 0.9780, and the 50-day SMA, near 0.9720, can limit the pair's further downside, failing to which it can test the 0.9660 support-level, including 50% Fibo. Given the sustained downtrend below 0.9660, the pair can be dragged down to 0.9580 and the 0.9500 round figure mark. On the upside, a break of 1.0000 psychological magnet can again propel the pair's northward trajectory towards 1.0100 and the December 2015 highs of 1.0170 while successful rise beyond 1.0170 may strengthen the pair towards 1.0240 and the 1.0350 upside levels.


“Original analysis is provided by Admiral Markets
 
Technical Checks for GBPCHF, EURGBP and GBPAUD

GBPCHF


Ever since the GBPCHF turned down from ascending trend-line resistance, forming part of "Rising-Wedge" bearish technical pattern, the pair maintained it south-run and confirmed further downward pressure by dropping below 1.4800 mark, including the formation support and the 200-day SMA. Currently, the mentioned SMA, around 1.4800 mark, limits the pair's near-term upside while 1.4450-40 may act as an immediate support, breaking which the pair can be dragged down to 1.4250 and then to the 61.8% Fibonacci Retracement of its January plunge, near 1.4140. Moreover, extended downside below 1.4140 can make the pair vulnerable enough to plunge below 1.4000 psychological magnet by printing 1.3980 and 1.3850 consecutive support levels. Alternatively, an upside break of 1.4800, the formation support, now acting as resistance, near 1.4900, and the 1.5100 level, may offer strong resistance to the pair prices. Should it manage to clear 1.5100 on a closing basis, chances of magnified northward trajectory to 1.5310-20 can't be denied.

EURGBP


EURGBP's reversal from 0.7000 propelled the pair prices towards 0.7480 – 0.7500 medium-term important resistance-zone which currently restricts the pair's up-move, favoring chances of pullback to 0.7400 immediate support. If the pair dips below 0.7400, the 38.2% Fibonacci Retracement of its November 2014 – July 2015 downside, near 0.7350, and the 0.7300 round figure mark, are likely following downside supports. Moreover, extended south-run below 0.7300, can print 0.7240 and the 0.7100 levels prior to pushing the pair to 0.7000 re-test. Meanwhile, a closing break above 0.7500 can trigger the pair's up-move towards 0.7600 and to the 0.7700 resistance levels and successful up-move beyond 0.7700 may strengthen the pair to target 0.7760 and the 0.7800 before it could head for 0.7900 mark.

GBPAUD


Following the GBPAUD's turn-around from 2.0170, the pair managed to test the highest levels in nearly three weeks; however, two month old descending trend-line resistance, presently at 2.0950, may limit its further up-move and trigger the pullback to 2.0650-40 area. Given the pair's extended downturn below 2.0640, the 2.0550 and the 2.0380 could offer intermediate support to the pair before it could re-visit December lows, around 2.0170, and the 61.8% FE of its September – December downside to 2.0120. If at all the pair manages to clear 2.0950, the 38.2% Fibo, near 2.1020 and the 50% Fibo, near 2.1220, may offer quick test during the pair's up-move. Further, pair's extended rise beyond 2.1220 can enable it to look for 2.1500 area.


“Original analysis is provided by Admiral Markets
 
Technical Update - EURNZD, GBPNZD and NZDCHF

EURNZD


The pair once again managed to rebound from an important support around 1.5800 mark, nearing 61.8% Fib. retracement level of April to August up-move and has subsequently moved back above 1.6400 level, surpassing 50-day and 200-day SMA resistance confluence and also 50% Fib. retracement level resistance. From current levels, should the pair continue holding above this important resistance turned support confluence region near 1.6300 mark and starts trading above 1.6500 mark, it is likely to extend its upward trajectory towards 100-day SMA resistance, currently near 1.6775-80 area, also nearing 38.2% Fib. retracement level resistance near 1.6850 level. Alternatively, weakness back below 1.6300 mark, leading to a drop back below 50-day and 200-day SMA confluence region near 1.6250-40 zone, is likely to get extended back towards retesting 1.5800 mark support. Decisive break below 1.5800 mark and a subsequent weakness below 61.8% Fib. retracement level support near 1.5750 level, seems to open room for continuation of the pair's near-term downward trajectory towards testing its next major support near 1.5000 psychological mark.

GBPNZD


Following a drop to its lowest level since June 2015, the pair rebounded from sub-2.1500 level support marking 61.8% Fib. retracement level of April to Aug. up-swing. The pair subsequently move back above 2.2000 mark and now seems to extend its recovery towards its immediate resistance near 2.2220-30 area, representing 50% Fib. retracement level. Although momentum above 50% Fib. retracement level is likely to continue boosting the pair back towards 200-day SMA resistance near 2.2500-10 area, but any further strength now seems to be capped at 50-day SMA resistance, currently near 2.2600 mark. Meanwhile on the downside, weakness back below 2.2040-30 horizontal support is likely to drag the pair back towards 2.1770-65 support area. Below 2.1770-65 support, the pair could again be headed towards retesting 61.8% Fib. retracement level support near 2.1500 mark, which if broken decisively might drag the pair towards its next major support near 2.1300 round figure mark.

NZDCHF


After repeatedly failing to conquer an important resistance at 50% Fib. retracement level of Jan. to Aug. 2015 downfall, the pair on daily chart seems to be in the process of forming a short-term bearish Double-Top chart-pattern. The formation, however, is confirmed only once the pair decisively breaks below it's historic resistance turned support near 0.6500 region. Decisive break below 0.6500 mark support is likely to drag the pair immediately towards 38.2% Fib. retracement level support near 0.6430 and the fall could further get extended towards it next major support near 0.6350-40 horizontal area. Meanwhile on the upside, 0.6650 region seems to have emerged as immediate resistance, followed by resistance near 0.6750 horizontal zone. However, major upside resistance remains at 50% Fib. retracement level near 0.6850 area, which if conquered negates the bearish formation, paving way for extension of the near-term upward trajectory towards 61.8% Fib. retracement level resistance near 0.7150 level.


“Original analysis is provided by Admiral Markets
 
Technical Check - EURUSD, GBPUSD, USDJPY and NZDUSD

EURUSD


On 4-hourly chart, the pair remains in down-trend as depicted by a short-term descending trend-channel formation. The pair is currently witnessing reversal from the upper trend-line resistance of the channel and is currently hovering around 1.0850 level, marking 38.2% Fib. retracement level of its up-swing from Dec. lows to 1.1059 high touched on Dec. 15. Sustained weakness below 1.0850 level is likely to drag the pair immediately towards 50% Fib. retracement level intermediate support near 1.0790 region before heading back towards retesting 61.8% Fib. retracement level support near 1.0725-710 area. The 61.8% Fib. retracement level also nears the lower trend-line support of the channel and hence, a sustained weakness below 1.0700 mark might now trigger a fresh of weakening trend for the pair. Meanwhile on the upside, move above 1.0880-90 immediate horizontal resistance is closely followed by the upper trend-line resistance of the channel, near 1.0930-40 area, also coinciding with 23.6% Fib. retracement level. A decisive break-through the 1.0930-40 important resistance confluence now seems to pave way for further near-term recovery towards its next major resistance near 1.1040-60 area, comprising of 100-day and 200-day SMA levels.

GBPUSD


Following its drop below April 2015 lows, the pair extended its weakness and is now trading close to the lower trend-line support of a short-term descending trend-channel formation on 4-hourly chart near 1.4450 area. A decisive break below the trend-channel support is likely to increase the pair's vulnerability to continue drifting lower towards testing 61.8% Fib. expansion level support, near 1.4310-1.4300 mark. Alternatively, a bounce from the current support area might now confront immediate resistance near 1.4500-1.4510 zone, which if cleared might lift the pair back towards 1.4560-80 strong horizontal resistance. Beyond 1.4560-80 resistance area, the pair seems to extend its recovery towards testing the upper trend-line resistance of the channel, currently near 1.4650-60 area. Moreover, a decisive break-through the descending trend-channel, negating expectations of any further near-term weakness, now seems to assist the pair to register additional recovery in the near-term towards its next major resistance near 1.4800 mark with intermediate resistance near 1.4720-30 level.

USDJPY


The pair's reversal from a short-term descending trend-line resistance dragged it back towards testing an important trend-line support near 116.70-60 area. This trend-line support has been held since Dec. 2014 and hence, a decisive weakness below this important support has the potential to continue dragging the pair towards testing sub-114.00 level support marking 23.6% Fib. retracement level of Oct. 2011 lows to Jun. 2015 big up-surge. Meanwhile, bounce back from the trend-line support is likely to gain momentum once the pair manages to move back above 118.00 mark. Above 118.00 level, the pair could immediate rise towards 119.00 horizontal resistance, before climbing further towards reclaiming 120.00 psychological mark resistance. Any further up-move beyond 120.00 mark might now be capped by historic resistance near 121.50 horizontal area.

NZDUSD


The pair once again failed to clear an important resistance near 0.6880-0.6900 area, representing 50% Fib. retracement level of May to Sept. 2015 downfall. From current levels, should the pair extend it reversal and drop below 0.6500 mark immediate support, it seems to be headed back towards retesting 0.6400 mark resistance turned support area. Failure to hold 0.6400 mark support might now make it vulnerable to continue its downward trajectory, initially towards retesting the multi-year lows support near 0.6240-30 area, earlier tested in Sept. 2015. Below Sept. lows, the fall could further get extended towards 61.8% Fib. expansion level support near 0.6070-50 region. Alternatively, a move back above 0.6570-80 immediate resistance might lift the pair back towards 0.6640-50 intermediate resistance, which if conquered has the potential to continue boosting the pair towards its next major resistance near 0.6740-50 area, representing 38.2% Fib. retracement level. On a sustained strength above 0.6750 strong resistance, the pair might be headed back towards retesting the very important 50% Fib. retracement level resistance near 0.6880-0.6900 mark.


“Original analysis is provided by Admiral Markets
 
Technical Overview: Important AUD Pairs

AUDUSD


AUDUSD has been trading in a range between 0.6900 – 0.7400 for over a four months' period, as depicted by the "Rectangle" formation on a D1 chart, and is presently fluctuating near the 0.6920 – 0.6900 pattern support-area ahead of Thursday's Australian job details. Should the labor market numbers print another set of welcome marks, chances of one more bounce from the critical 0.6900 support can't be denied; however, 0.7040 and the 0.7100 are likely immediate resistances that the pair needs to counter in order to test 0.7170 and the 0.7250 upside levels. Moreover, extended north-run beyond 0.7250 can fuel the pair towards 0.7380 - 0.7400 important resistance region, also comprising of 200-day SMA, breaking which it can quickly rise to 0.7510 and the 0.7600 mark. Alternatively, a closing break of 0.6900 can drag the pair to 61.8% FE of its June – September decline, near 0.6800 mark, before targeting the 0.6600 support-zone.

EURAUD


Extending its bounce from 1.4420 – 1.4400 support-region, the EURAUD managed to surpass the 100-day SMA; though, short-term descending trend-line resistance, currently around 1.5835-50, restricted the pair's further up-move, favoring a pullback to mentioned SMA, near 1.5410 – 1.5400 area. Given the pair's drop below 1.5400, the 1.5300 – 1.5280 horizontal-zone can offer strong support to the pair, breaking which 50% Fibonacci Retracement of its April – August rally, near 1.5130, is likely an intermediate rest before the prices can extend its south-run to 1.4850 and to the 61.8% Fibo, at 1.4800 round figure mark. Moreover, sustained downtrend below 1.4800 can make the pair vulnerable enough to re-test 1.4420 – 1.4400 zone. On the contrary, 1.5730 and the 1.5835-50, closely followed by the 23.6% Fibo level of 1.5900, could act as nearby resistance for the pair to clear. Should it successfully surpasses 1.5900, the 1.6150 and the 1.6255-60 are the levels the pair traders should look for prior to targeting the August highs of 1.6590 – 1.6600 area.

AUDJPY


Even after dropping below the 82.00 – 81.80 support-zone, including lows marked in August and September, the AUDJPY failed to close below the critical support-area and is presently struggling near the same. Should it manage to clear its 83.00 immediate resistance, and closes around 83.50, it can witness a pullback to 85.40-50 region, clearing which 87.20 and the 88.60 are likely consecutive upside levels that the pair might witness during its sustained advance. Moreover, a closing break above 88.60 needs to surpass 89.70 – 90.00 resistance-zone, encompassing more than a year long descending trend-line and the 200-day SMA, in order to aim for 92.50-60 area. Meanwhile, a daily close below 81.80 and an extended downside clearing 81.00 round figure mark could pull the pair to 79.30 and then to 61.8% FE of its November 2014 – August 2015 downside, near 77.80.

AUDCAD


Although, the AUDCAD reversed from 1.0170, 0.9840 – 0.9830 horizontal resistance-turned-support confined the pair's additional decline, pulling it back to 0.9955-60 area, breaking which the 1.0000 psychological magnet, also comprising the 23.6% Fibonacci Retracement of its November – December advance, can act as an important resistance for the pair. Should it manage to surpass 1.0000, the 1.0050 and the 1.01000 might provide intermediate resistances to the pair before it can head for the 1.0200 resistance-zone. On the downside, 38.2% Fibo, near 0.9880 and the 0.9840-30, may continue restricting the pair's near-term decline, dipping below the pair can run down to 0.9750 and the 0.9670 support levels before witnessing the 0.9580 and the 0.9500 round figure mark.


“Original analysis is provided by Admiral Markets
 
USDCHF, EURCHF, GBPCHF, AUDCHF: Technical Outlook

USDCHF


While seven month old ascending trend-channel favors USDCHF advance, the pair is more likely to accelerate its upward trajectory to 1.0125-30 immediate resistance, breaking which 1.0200 can act as an intermediate stop prior to its run-up to the November 2015 highs of 1.0330. However, pair's further north-move beyond 1.0330 can be capped by the mentioned channel's resistance-line, near 1.0500 round figure mark. Meanwhile, 0.9950 and the channel support, also comprising the 100-day SMA, near 0.9850, can limit the pair's near-term downside. Should it break the 0.9850 on a closing basis, also drops below 0.9800 mark, the pair becomes vulnerable enough to test 0.9650-40 support-area.

EURCHF


Having breached 100-day SMA and the 23.6% Fibonacci Retracement of its April – September 2015 up-move, the EURCHF currently struggles to break four month old descending trend-line resistance, around 1.0900 – 1.0910, which if broke can trigger the pair's up-move to 1.0950 and to the 1.1000 psychological magnet. Moreover, successful trading above 1.1000 might enable the pair to surpass its September highs of 1.1050 and rally towards 1.1100 mark. On the downside, 23.6% Fibo and the 100-day SMA confluence, near 1.0860-50, becomes strong nearby support for the pair, clearing which it can quickly drop 1.0800 area while further south-run of the pair below 1.0800 can be confined by the five month old ascending trend-line support, near 1.0770. Given the pair's inability to hold 1.0770, it can extend the downturn below 1.0680 and test the 50% Fibo, near 1.0640.

GBPCHF


Repeated failures to surpass 1.5530-70 horizontal resistance-line, encompassing highs marked September 2014 and the January and November 2015, dragged the GBPCHF below 200-day SMA; however, the pair recently bounced from 1.4400 – 1.4390 support-zone, indicating a quick test to 1.4600 resistance mark. Should the pair mange to extend its profit booking moves beyond 1.4600, the 200-day SMA, near 1.4800, is likely an important level that could restrict its further advance, breaking which the pair might aim for 1.4950-70 resistance-zone before it could rise to 1.5120-30 area. Alternatively, a dip below 1.4390, quickly followed by the 1.4330-25, can fetch the pair to 61.8% Fibonacci Retracement of its January plunge, around 1.4130. Moreover, a closing break of 1.4130, also clearing the 1.4100 round figure mark, can further weaken the pair to test sub-1.4000 psychological magnet.

AUDCHF


A yearlong ascending trend-line support, presently near 0.6830, triggered the AUDCHF bounce; though, a closing break above 100-day SMA, at 0.7055 now, becomes necessary for the pair to aim for 0.7155-60 immediate resistance-zone. If the pair mange to stretch its bounce beyond 0.7160, 38.2% Fibonacci Retracement of its September 2014 – January 2015 drop, near 0.7300 mark, become an important resistance before the pair could rise to medium-term descending trend-line resistance of 0.7450, which if cleared can accelerate the pair's northward moves to 50% Fibo, near 0.7560, prior to aiming the 0.7700 mark. However, daily close below 100-day SMA can continue signaling 23.6% Fibo, near 0.6950, as pair's short-term support, breaking which 0.6830, encompassing mentioned trend-line support, is likely critical level for the pair traders to watch. Should the pair drops below 0.6830, it might drift lower to 0.6700 and then to the 0.6530-25 support area, including August lows.


“Original analysis is provided by Admiral Markets
 
Back
Top