Technical Analysis by Admiral Markets

GBP/USD is proceeding higher with a strong momentum


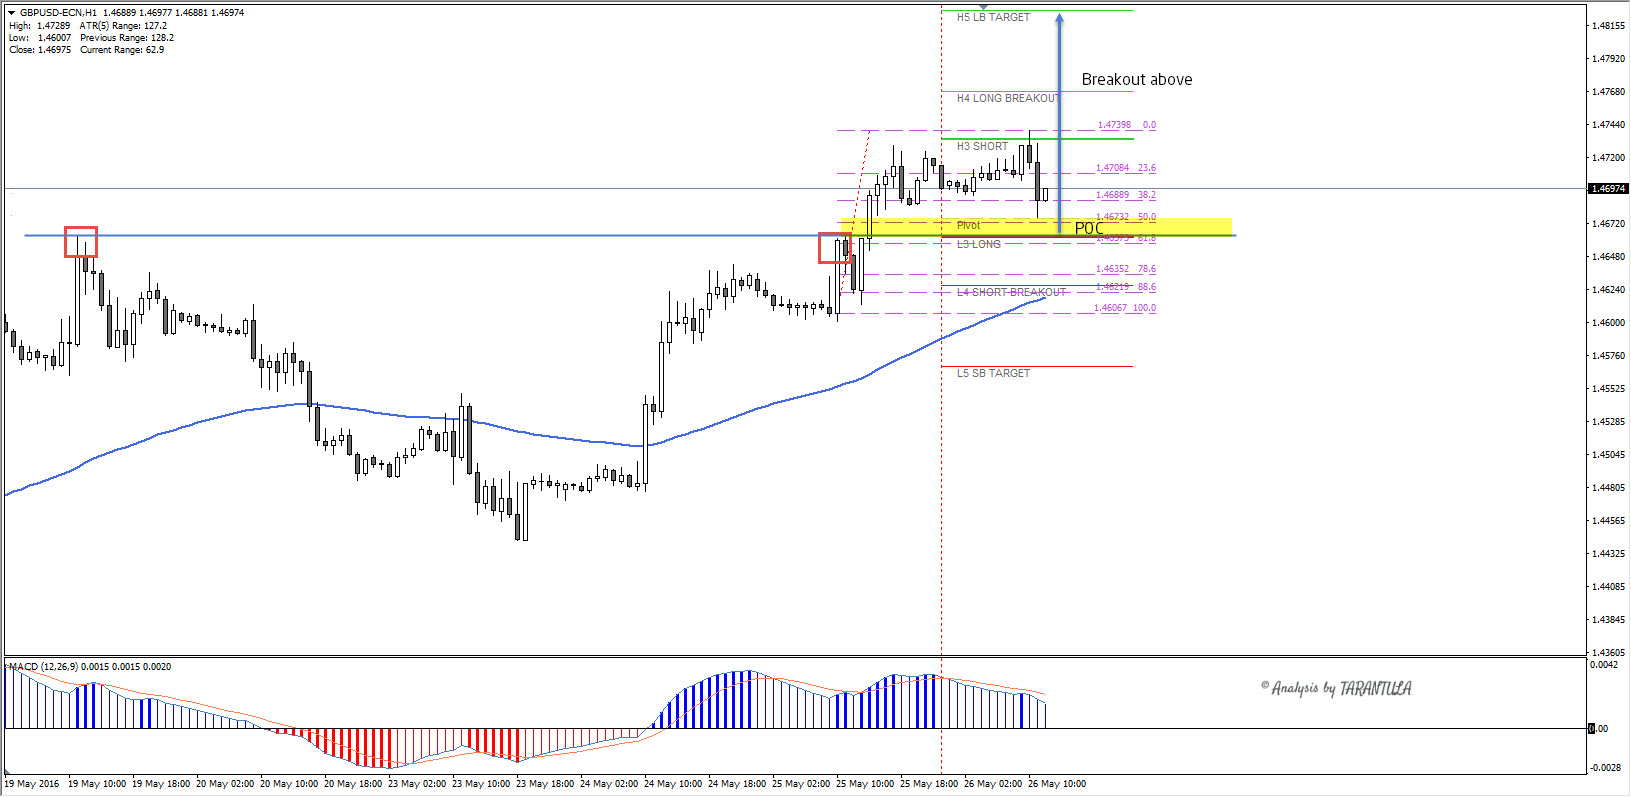
Our previous GBPUSD predictions came true, though after a bigger pullback and the pair has made a strong bounce to the upside. Again, fears of Brexit diminished and the pound has been bought on dips.

Today's Second Estimate GDP came as expected and it is important because it measures a change in the inflation-adjusted value of all goods and services produced by the economy. Technically GBPUSD has made a form of ascending scallop pattern. POC (DPP, L3, 61.8, double top breakout) comes within 1.4660-70 zone and pullbacks toward the zone could be used for long trades. The targets are 1.4740 and 1.4770. If the pair breaks 1.4770 with a strong momentum or we see a 4h close above it, next target is 1.4825.


“Original analysis is provided by Admiral Markets
 
EUR/USD watch for counter trend confluence


The EURUSD is patiently waiting for major economic data coming in this week. We have some real high impact info this week and we could see risk-off sentiment possibly coming back. We need to watch out for upcoming releases:

  1. Wednesday - CNY manufacturing data, very important data for CNY + ADP
  2. Thursday - ECB press conference and OPEC
  3. Friday - NFP
Any bad US data during week including bad CNY data could cause a risk off. If OPEC fails to cut Oil and oil price drops subsequently, it won't be good for USD. End of month positions may reverse too on profit taking.

In addition to fundamentals, technical chart is also showing signs of a possible counter trend movement as we could see that weekly support is there - X cross on weekly chart formed by historical buyers and lower equidistant channel support line. On H4 time frame we can see the similar picture. L3 support is sitting at the bottom of equidistant support + we can see a regular bullish divergence. While above 1.1085-70 EURUSD might turn bullish targeting 1.1200 and 1.1240.

So it is very important that we pay attention to price flow as the EURUSD is close to a counter trend confluence POC.


“Original analysis is provided by Admiral Markets
 
USD/CHF Triple bar rejection at resistance


The USD/CHF is bound in a ranging market just as EUR/USD. As we could see in this article, the EUR/USD is meant to go up (as it is going) and that normally means USD/CHF down due to a negative high correlation.

Technically we can spot a triple pin bar rejection off the H3 resistance and it looks like a failed inverted head and shoulders. Due to a range that USD/CHF is currently in we might see a good r:r if the pair proceeds down. 0.9940-50 is the zone where we could see a rejection and as long as the pair is below 0.9975 targets are 0.9900 and 0.9870. Additionally traders should pay attention to ADP today.


“Original analysis is provided by Admiral Markets
 
GBP/USD is at critical support


In the wake of major economic releases today, we can see that the GBP/USD pair is very close to critical support. Maybe it is time for a retracement. Current price action suggest a possible retracement towards 1.4540-50 zone (POC). 1.4385 is a very important support and we see a higher low compared to a previous low on 4h time frame. MACD has made a lower low and that counts as hidden bullish divergence. Additionally from L to H 1.4385 is 88.6 fib swing so that makes another confluence point. If the price retraces to POC ( L3, EMA89, 50.0) we could see initial selling again towards 1.4400-1.4385.

It is very important for traders to see the whole picture as only if the price breaks and closes below 1.4385 we could see 1.4320 and 1.4280. For now we could see a spike up as a part of correction.


“Original analysis is provided by Admiral Markets
 
EUR/USD getting close to key resistance


The EUR/USD had a huge momentum candle after worse than expected NFP report on Friday. The pair broke through 4h trend line above 1.1220 confluence zone and is heading towards key resistance zone. If the pair gains momentum above 1.1370 it could reach 1.1418-50 POC zone (61.8, historical sellers,bearish order block). The zone could be used for selling and the pair should drop if the zone is reached. Targets are 1.1360 and below - 1.1295 and 1.1220 as the final target for the bearish move. Have in mind that 1.1360 zone is also a resistance (50.0, near term sellers) and the pair could also find some selling there.


“Original analysis is provided by Admiral Markets
 
AUD/JPY T-89 pattern suggesting a possible bounce


The AUD/JPY pair spiked after a V shaped reversal at the bottom spiking up to 80.30, slightly below H3 camarilla pivot. Now moment price action is showing a completed T-89 pattern right off L4 support where we can see a confluence zone (L4, 38.2, T-89). Since T-89 has been completed we might see a bounce off 79.70 too towards 80.40 and 80.80. Only if the price breaks 80.80 it will make an ascending scallop towards 81.30. Ideally the price should stay above L4 in order for the price to remain bullish.


“Original analysis is provided by Admiral Markets
 
NZD/USD spiked up leaving retail gap open


Market was a bit surprised by a no rate cut from RBNZ that sent NZD/USD spiking above previous resistance leaving the trail of retail gap. The same time it appears that the US Fed, despite the slightly hawkish view of Yellen of late, will be unlikely to raise rates in June ahead of the UK referendum.

Technically the NZD/USD is showing a retail gap within 0.7027-0.7070 zone and it hasn't been closed yet. Additionally the gap is within POC zone (H3 WPP, 38.2, inner trend line). The zone 0.7020-60 could provide buying opportunities towards H5 weekly target 0.7250. However if the pair doesn't reject from the zone we might be witnessing a deeper retracement towards POC2 (78.6, L3, WPP, EMA89) 0.6985-0.6900 that also shows a historical gap and should be used for new moment buyers.


“Original analysis is provided by Admiral Markets
 
GBP/USD watch for 1.4200-1.4225 zone


Renewed fears of Brexit is putting the pair under strong pressure. Latest ORB polls suggested "Leave" camp leading by 10% (55% vs 45%) but still there are a lot undecided who might balance-out. Brexit is the main focus now and if we look at the technical picture we see that there is still room for the more downside.
Technically, the pair has broken below multiple trend lines and it has touched 1.4115 L3 weekly support. Bearish order block and historical sellers suggest that 1.4200-1.4230 zone could be good for next round of sellers towards 1.4115 retest again. If the price breaks and 4h candle closes below 1.4100 the way towards 1.3980 will be open.

However if any additional pro "Stay" news is released, watch for spikes towards trend lines. Volatility is huge and pay special attention to your risk management too.


“Original analysis is provided by Admiral Markets
 
EUR/USD FOMC will provide additional momentum today


It is very possible that Yellen may continue with her hawkish tones at the upcoming FOMC meeting. Nevertheless, as I stated in earlier updates, all eyes will be on the UK referendum this month (23 June 2016) as to whether the UK will remain in the EU. The uncertainty of a Brexit raises many uncertainties around the UK economy and the future of the EU. I do not expect the US Fed to raise rates ahead of the UK referendum. Should the UK decide to remain in the EU, then it is very possible, that the US Fed may raise rates in the July meeting.

Technically, the EUR/USD is acting as planned as shown in the previous technical coverage where we saw it retracing towards 1.1220 with some rejections within the zone. At this point the scenario is the same. As long as 1.1175 holds we should see EUR/USD potentially up, rejecting from 1.1200-20 towards 1.1260 (H4,50.0,EMA89) with a potential towards 1.1312 - H5 resistance.

Below 1.1175 targets are 1.1140 and 1.1095. Expect, volatility spike just before and during FOMC.


“Original analysis is provided by Admiral Markets
 
EUR/GBP shorting from the top of the right shoulder possible


The EUR/GBP has formed inverted head and shoulder and traders might try to short into the top of the right shoulder, exploiting the best possible r:r. POC for counter trend trades comes within 0.9670-0.9695 (H4, bearish divergence, Pin bar, the top of the right shoulder). The first target is 0.7892. If 0.7890 is broken it will form bearish M pattern towards 0.7850 where we could see buyers due to trend confluence zone (WPP, L3, EMA89, historical buyers) - remember the pair is still in an uptrend. So pay attention to price action within these important levels and you might be able to trade it both ways.


“Original analysis is provided by Admiral Markets
 
Back
Top