Sive Morten
Special Consultant to the FPA
- Messages
- 18,664
Monthly
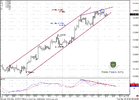
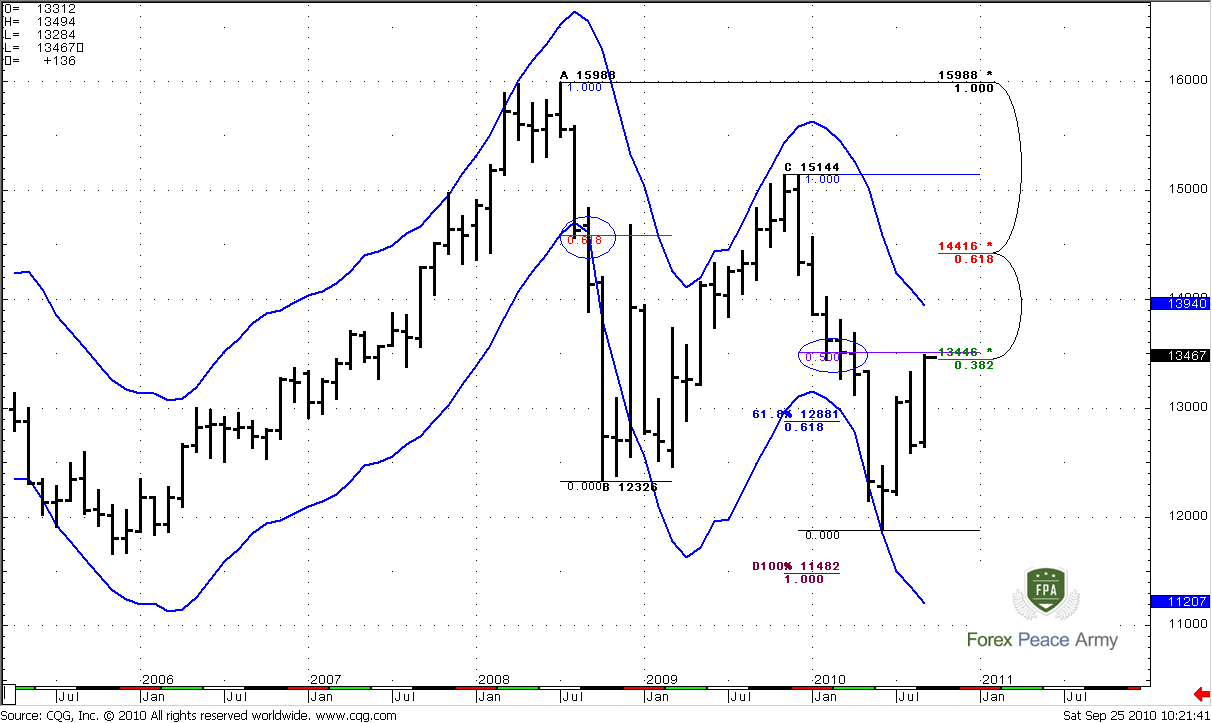
Today we will talk about resistances, rather then supports, all the more so, as market shows strength. Monthly trend is bearish, and it will be bearish until 1.40 roughly due to MACD Predictor (I don’t have it on the chart). The more important for us now is an Oscillator Predictor – look at blue lines. Lower line shows level of monthly oversold, upper line is for overbought. So, sometime ago, we’ve already talked about that, but currently this is important so I’ll repeat main things. Look at price action in 2008, how strong market was below blue line. It even has closed below it for 3 times. After that market just jumped out and has reached 0.618 Fib resistance. Only after that there was a retracement to the downside. And now let’s look at our situation – two months ago market also has reached an oversold condition, but did not close below and just touched the blue line twice. Other words, current level of oversold is less than in 2008 and we can count on smaller retracement. That is a logical fundament and now let’s shifts to definite numbers.
1.3446 is major 0.382 Fib resistance from all time high, 1.3509 is 50% resistance from the previous swing down. I can’t call this as a Confluence, because this is not a combination of 0.382 and 0.618. Nevertheless, this is strong resistance area. Besides, If during previous jump out from deep oversold market has shown 0.618 retracement, why it shouldn’t show 50% retracement, because oversold was not so deep? But there is another important nuance exists. Very often from deep oversold market goes to overbought - so as in 2008 – market has made move to the downside and then reached an overbought. So how we should act then? Well, first of all, monthly time frame is very long-term and we will have a lot of time to react at changing situation here. Second, we have to move gradually. Now we know in advance, that market is just below the strong resistance. Why don’t we look at price action around this level first? If market will show strong “Sell” signals on weekly or daily time frame – we will take them.
Monthly#1
Weekly
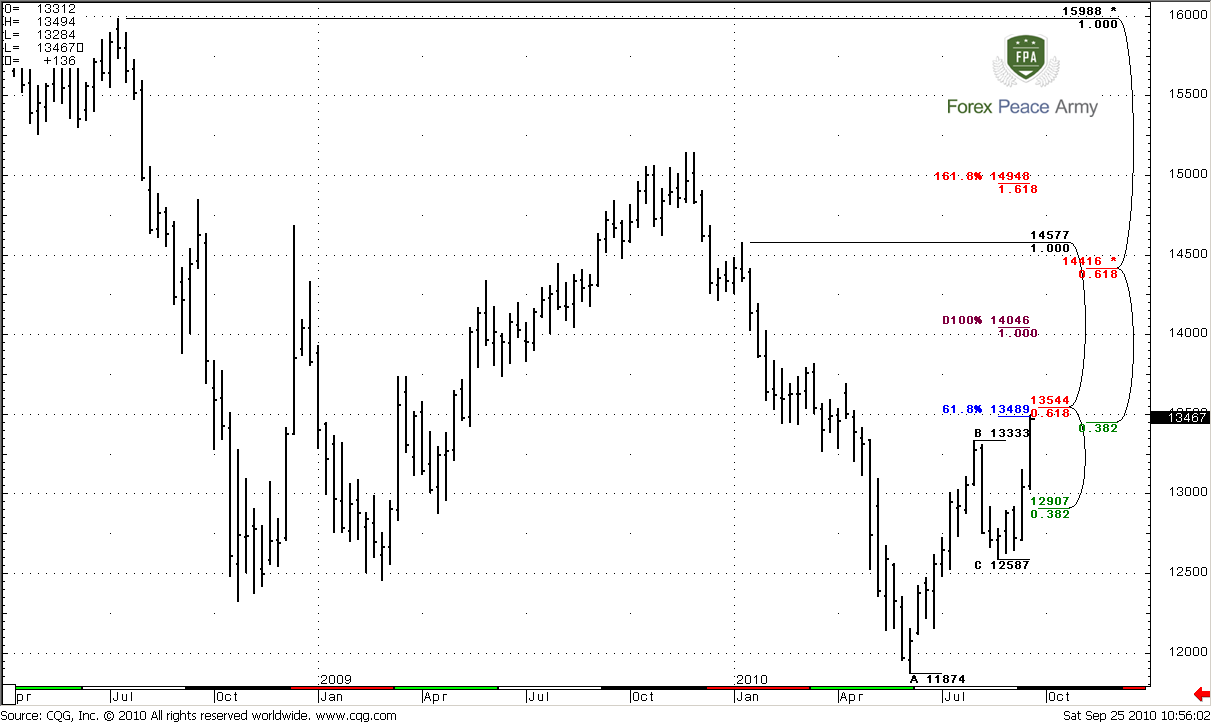
As market goes up further we should look at extended levels. Weekly trend is bullish and market has reached 61.8% expansion target from ABC-bottom weekly move at 1.3489 and weekly Confluence resistance area 1.3446-1.3544. As you remember, combination of Fib expansion with Fib resistance makes an Agreement. This is a really strong combination and the probability suggests that market should bounce a bit to the downside.
Let’s look at the last price action with more scrutiny on #2 chart.
Weekly#1
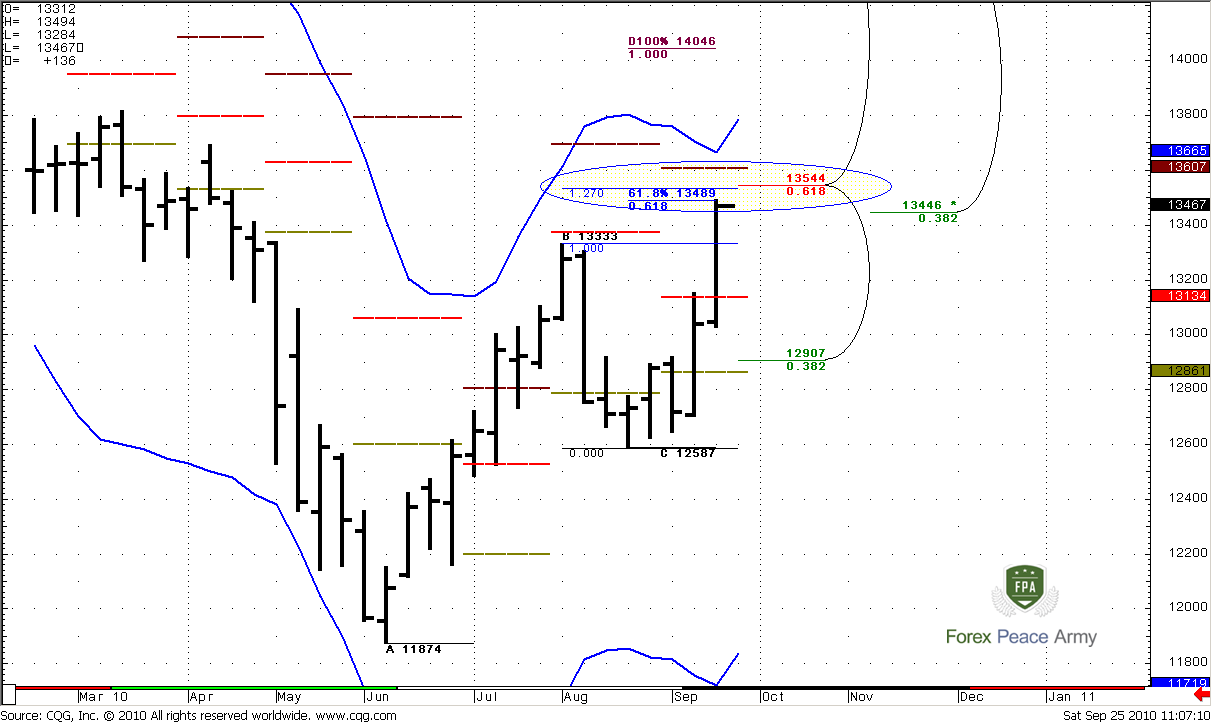
I’ve talked about this in video on the previous week, but not all of you ,guys, have a possibility to watch it, so, I bring to you this picture. Besides, Agreement at Confluence support, we have 1.27 expansion target from previous down retracement, monthly pivot resistance 2 at 1.3607 and weekly overbought level a bit higher.
Weekly#2
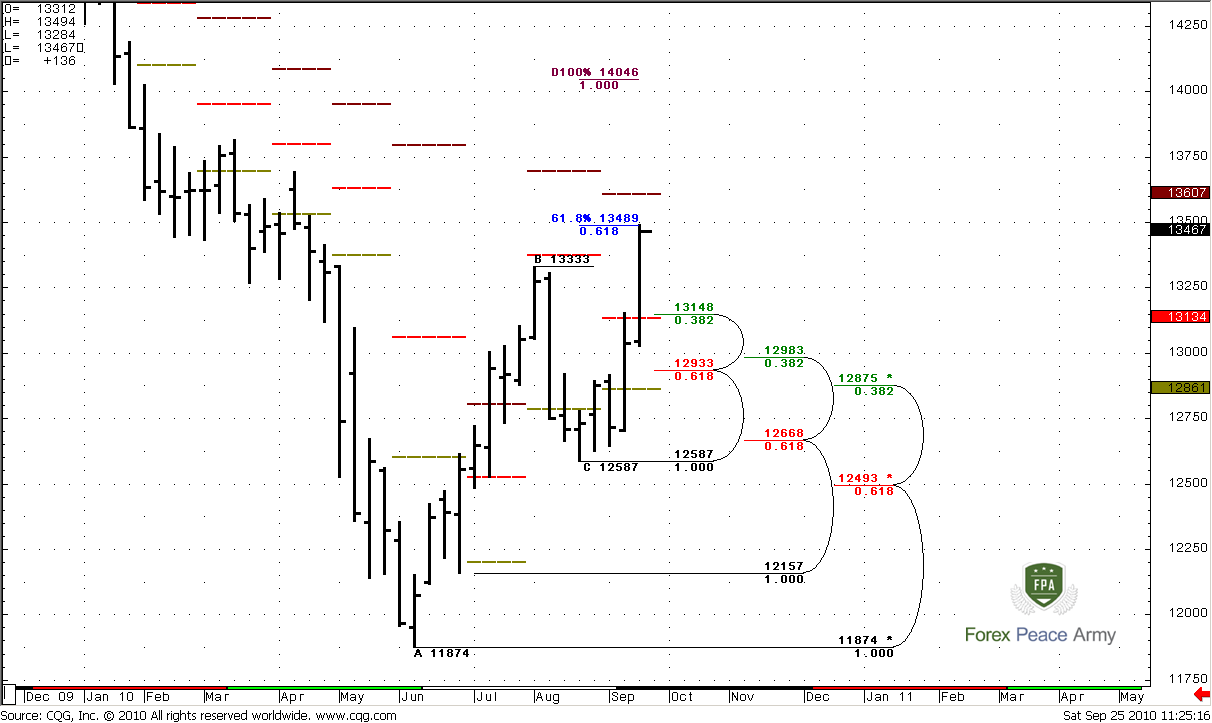
And here are support levels. You can see strong Confluence support area at 1.2875-1.2933, the monthly pivot point just below this area at 1.2861. The main rule here as follows. If market intends to go up further, it shouldn’t show deep retracement after 0.618 expansion target. For the upward perspective the perfect event if retracement will stop at 1.3148 Fib support and weekly pivot resistance1 at 1.3134. Anyhow, market should not move below weekly Confluence support. If it will happen, the further up move will be under question.
Weekly#3
Daily
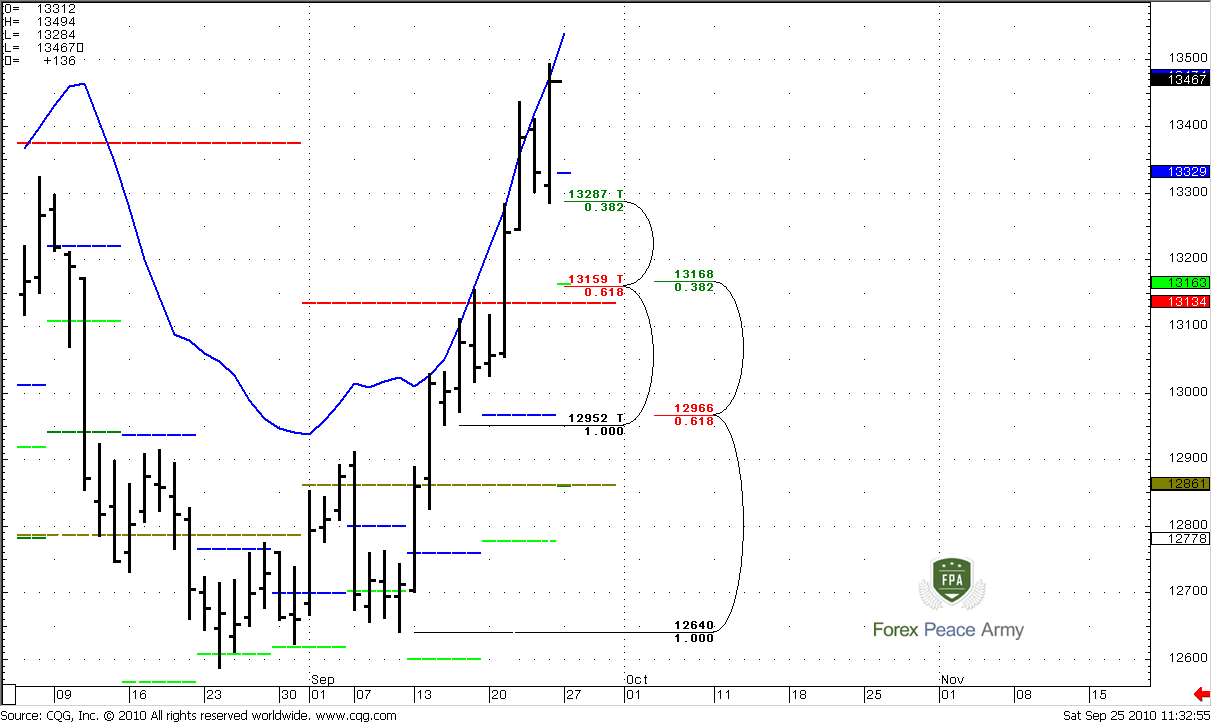
On daily chart only support levels make sense currently. Weekly trend is bullish, daily trend is bullish, price action is strongly bullish, so in general I would like to be a buyer, based on daily time frame and context. At the same time, market has reached COP target at weekly time frame, it just under weekly Confluence resistance and we at daily overbought. Odds suggest a pullback, so I do not want to buy right here. Let’s look where it will make a sense to do it…
There is couple of areas that personally I like. First one is 1.3287-1.3329, that includes Fib support and weekly pivot point, the second one and is my preferable – 1.3159-1.3168 Confluence support and weekly pivot support 1 – 1.3163. At 1.3134 there is a monthly pivot resistance 1, by the way.
I prefer the second area, because we overbought and retracement can be deeper, second, because this area is stronger.
The second moment that I would like to talk about is a combination of overbought level and strong Fib resistance. As you know this combination creates a Directional “Stretch” Sell pattern. The main risk with taking this signal is that you should trade against the trend. But there is a better opportunity exists and we will discuss it below.
Daily#1
1-Hour
This issue is for those who like to trade intraday aggressively or has a small account that does not allow to trade at larger time frame. Personally, if price action will be in a row with expectation, I intend to take this trade.
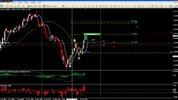
This is a scalp “Short” trade. We know that market has reached weekly target at strong area of resistance and daily overbought, and odds suggest that we have not bad chances to get some pips on the “Short” side of the market. Here is how we will do this...
First of all, look at two hourly ABC’s. Both of them have a target around 1.3540 and I think that market should reach them first. Two blue horizon lines is a weekly confluence resistance area that we’ve talked about already. The red line – is a weekly 61.8% expansion target and market has hit it already. Now, look at red line – this is MACD Predictor. You, guys, may use simple MACD. It’s absolutely suitable for current purpose. On Monday (or another day) wait, until hourly trend will turn bearish. If you use simple MACD, you should wait bearish line crossing at close of the bar, i.e. confirmed bearish crossing. Then wait, until the first leg to the downside will start to retrace up and enter on the first 0.382 retracement. Unfortunately there are no rules to choosing a target, but usually this is some ABC-top on hourly chart to the downside.
That’s being said, on longer term frame market has reached 61.8% expansion target and stays just under strong resistance area. Odds suggest that market should bounce to the downside. Although we have a strong bullish context at daily time frame, I do not want to buy right now, because of strong resistance just above the market and daily overbought. My preferable area to enter long is 1.3160-1.3170.
Also I do not see any problem to make a scalp intraday “Short” trade if market will confirm our expectation about a bouncing.
The technical portion of Sive's analysis owes a great deal to Joe DiNapoli's methods, and uses a number of Joe's proprietary indicators. Please note that Sive's analysis is his own view of the market and is not endorsed by Joe DiNapoli or any related companies.
Today we will talk about resistances, rather then supports, all the more so, as market shows strength. Monthly trend is bearish, and it will be bearish until 1.40 roughly due to MACD Predictor (I don’t have it on the chart). The more important for us now is an Oscillator Predictor – look at blue lines. Lower line shows level of monthly oversold, upper line is for overbought. So, sometime ago, we’ve already talked about that, but currently this is important so I’ll repeat main things. Look at price action in 2008, how strong market was below blue line. It even has closed below it for 3 times. After that market just jumped out and has reached 0.618 Fib resistance. Only after that there was a retracement to the downside. And now let’s look at our situation – two months ago market also has reached an oversold condition, but did not close below and just touched the blue line twice. Other words, current level of oversold is less than in 2008 and we can count on smaller retracement. That is a logical fundament and now let’s shifts to definite numbers.
1.3446 is major 0.382 Fib resistance from all time high, 1.3509 is 50% resistance from the previous swing down. I can’t call this as a Confluence, because this is not a combination of 0.382 and 0.618. Nevertheless, this is strong resistance area. Besides, If during previous jump out from deep oversold market has shown 0.618 retracement, why it shouldn’t show 50% retracement, because oversold was not so deep? But there is another important nuance exists. Very often from deep oversold market goes to overbought - so as in 2008 – market has made move to the downside and then reached an overbought. So how we should act then? Well, first of all, monthly time frame is very long-term and we will have a lot of time to react at changing situation here. Second, we have to move gradually. Now we know in advance, that market is just below the strong resistance. Why don’t we look at price action around this level first? If market will show strong “Sell” signals on weekly or daily time frame – we will take them.
Monthly#1
Weekly
As market goes up further we should look at extended levels. Weekly trend is bullish and market has reached 61.8% expansion target from ABC-bottom weekly move at 1.3489 and weekly Confluence resistance area 1.3446-1.3544. As you remember, combination of Fib expansion with Fib resistance makes an Agreement. This is a really strong combination and the probability suggests that market should bounce a bit to the downside.
Let’s look at the last price action with more scrutiny on #2 chart.
Weekly#1
I’ve talked about this in video on the previous week, but not all of you ,guys, have a possibility to watch it, so, I bring to you this picture. Besides, Agreement at Confluence support, we have 1.27 expansion target from previous down retracement, monthly pivot resistance 2 at 1.3607 and weekly overbought level a bit higher.
Weekly#2
And here are support levels. You can see strong Confluence support area at 1.2875-1.2933, the monthly pivot point just below this area at 1.2861. The main rule here as follows. If market intends to go up further, it shouldn’t show deep retracement after 0.618 expansion target. For the upward perspective the perfect event if retracement will stop at 1.3148 Fib support and weekly pivot resistance1 at 1.3134. Anyhow, market should not move below weekly Confluence support. If it will happen, the further up move will be under question.
Weekly#3
Daily
On daily chart only support levels make sense currently. Weekly trend is bullish, daily trend is bullish, price action is strongly bullish, so in general I would like to be a buyer, based on daily time frame and context. At the same time, market has reached COP target at weekly time frame, it just under weekly Confluence resistance and we at daily overbought. Odds suggest a pullback, so I do not want to buy right here. Let’s look where it will make a sense to do it…
There is couple of areas that personally I like. First one is 1.3287-1.3329, that includes Fib support and weekly pivot point, the second one and is my preferable – 1.3159-1.3168 Confluence support and weekly pivot support 1 – 1.3163. At 1.3134 there is a monthly pivot resistance 1, by the way.
I prefer the second area, because we overbought and retracement can be deeper, second, because this area is stronger.
The second moment that I would like to talk about is a combination of overbought level and strong Fib resistance. As you know this combination creates a Directional “Stretch” Sell pattern. The main risk with taking this signal is that you should trade against the trend. But there is a better opportunity exists and we will discuss it below.
Daily#1
1-Hour
This issue is for those who like to trade intraday aggressively or has a small account that does not allow to trade at larger time frame. Personally, if price action will be in a row with expectation, I intend to take this trade.
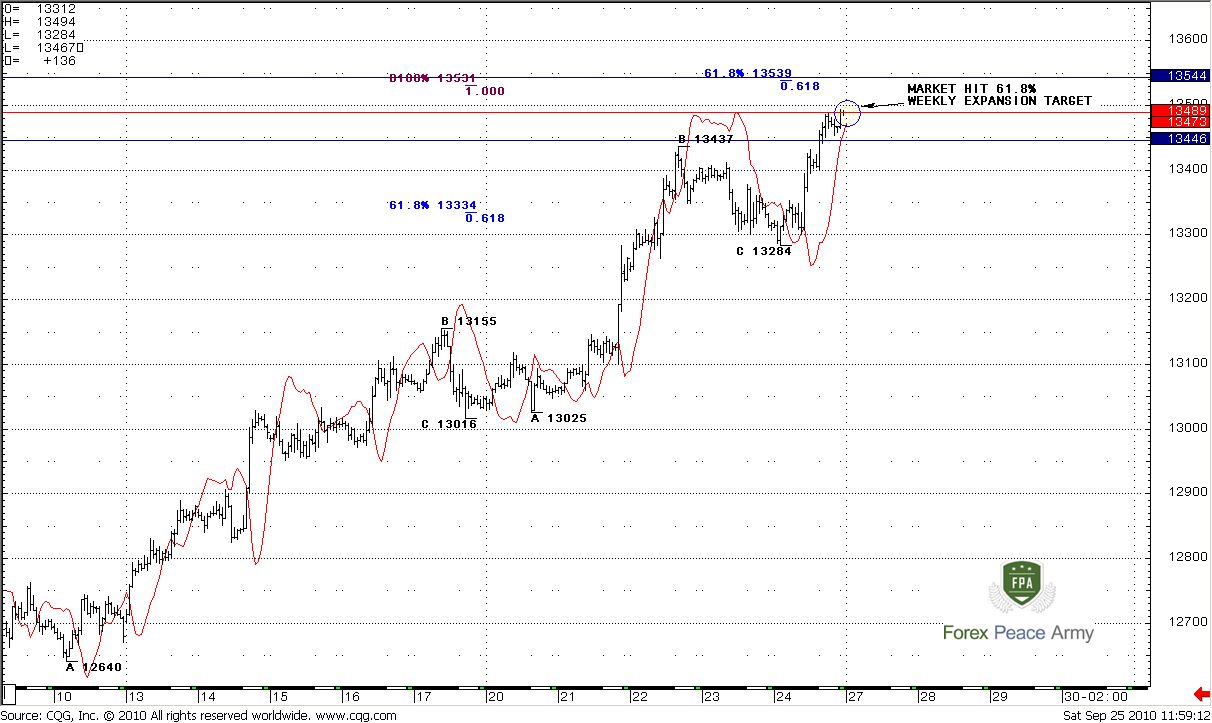
This is a scalp “Short” trade. We know that market has reached weekly target at strong area of resistance and daily overbought, and odds suggest that we have not bad chances to get some pips on the “Short” side of the market. Here is how we will do this...
First of all, look at two hourly ABC’s. Both of them have a target around 1.3540 and I think that market should reach them first. Two blue horizon lines is a weekly confluence resistance area that we’ve talked about already. The red line – is a weekly 61.8% expansion target and market has hit it already. Now, look at red line – this is MACD Predictor. You, guys, may use simple MACD. It’s absolutely suitable for current purpose. On Monday (or another day) wait, until hourly trend will turn bearish. If you use simple MACD, you should wait bearish line crossing at close of the bar, i.e. confirmed bearish crossing. Then wait, until the first leg to the downside will start to retrace up and enter on the first 0.382 retracement. Unfortunately there are no rules to choosing a target, but usually this is some ABC-top on hourly chart to the downside.
That’s being said, on longer term frame market has reached 61.8% expansion target and stays just under strong resistance area. Odds suggest that market should bounce to the downside. Although we have a strong bullish context at daily time frame, I do not want to buy right now, because of strong resistance just above the market and daily overbought. My preferable area to enter long is 1.3160-1.3170.
Also I do not see any problem to make a scalp intraday “Short” trade if market will confirm our expectation about a bouncing.
The technical portion of Sive's analysis owes a great deal to Joe DiNapoli's methods, and uses a number of Joe's proprietary indicators. Please note that Sive's analysis is his own view of the market and is not endorsed by Joe DiNapoli or any related companies.