FOREX PRO Weekly, December 06-10, 2010

There is no gainsaying the fact that u are a great blessing to forex traders
may the Lord Bless U and Ur family with Happy home and may he favour You and your family Likewise all FPA members who have made this free analysis possible and signal possible.
Thanks
Pls. 1 How can I identify double ripo buy or sell?
Is it when 2 opposite candle is form and it open and close almost at the same price level
2. pls how can I place MACD predictor Line on my chart. the I usually see in my trading platform is MACD Histogramme.
Your assistance will be highly appreciated thanks.

I have posted this pos 2day on USD /CHF but I think My Questions may not be seen.
Thanks

1. It will be better if you read DiNapoli book, because he gives excellent explanation for DRPO. But, in general, DRPO "Buy" pattern happens after strong thrust down. Market should close above 3x3 MA then below and above again. The second close above is a confirmation bar. This pattern has a lot of nuance - I suggest that you find my archive recent AUD/USD video. I've given very detail explanation of DRPO pattern.
DRPO sell, as you undertand, happens at tops after strong thrust up.
2. There is no apropriate Dinapoli indicators pack for MT 4, so MACD Predictor for MT4 does not exist. Furthermore, even MT4's MACD is not correct, because it uses simple averaging for signal line, but DiNapoli uses exponential. Also MT4's MACD does not allow to use fraction periods....
 
Pls what platform can I use that will give me the opportunity to use this indicator with correct MACD Predictor
 
Thanks Sive

pls can u hel me with the Dinapoli book or how I can get it.
Thanks greatly.
 
Dear Sive

First of all I want to thank you for your free lessons on forex market trading and the use of Dinapoli levels.

As Dinapoli's book states Time aligned bars are very important. I see my charts are not in-line with yours and im not getting the correct values for indicators (dayly OB/OS etc) compared to yours. Im using GFT's dealbook to make my analysis. So would you please tell me how to fix this issue? is it a time zone problem? configuration problem of the platform?

Thank you once again, im learning a lot thanks to your kindness.

This is very good question pal, although I've answered on it a couple of time, since I work with FPA.
The simple answer is no way to fix it, because as you know forex is an OTC market and there is no single source of quotes. So, it's a bit tricky from this point of view to trade forex lower than weekly time frame :)

So, personally I think that when you'll make solid profit, the better way to trade is to shift to CME FX futures market. It's a bit more complex, but it worthy of it. The huge advantage of exchange traded market is quotes definition, because every tick is fixed in exchange data base...
Besides, clients assets are safer with exchange tradable market than on spot FOREX due to legislative rules of using segregate accounts by the brokers, etc...
 
Pls what platform can I use that will give me the opportunity to use this indicator with correct MACD Predictor

Well, these platforms are rather expensive. For example, CQG, that I am using has DiNapoli pack, Genesis trade navigator and as I know, CIS - platform (DiNapoli software). Also, it seems that Omega trade station has them, at least partially, but I do not sure

Concerning the book - you can buy it in any e-shop. As I know, DiNapoli gives some discount to FPA's members.
 
EUR/USD Daily Update, Wed 08, December 2010

Good morning,
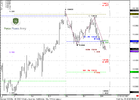
yesterday I've said, that market still can show AB-CD retracement to the upside, so this currently is happening. Market just reaches 100% expansion of Gartley's AB-CD "Buy" pattern that Agrees with 50% support area from the whole move up.
It means that current level is a key level to watch for during current trading session. If market will fail here - the next target is 1.618 Fib expansion and weekly pivot support 1 at 1.3085. If it will return above the weekly pivot point (1.3261) it will tell us that current downmove was just an AB-CD retracement in new upside trend and we can count on larger ABC that has target above the market (the first one around 1.35 area).
 

Attachments

  • EUR_H1_08_12_10.PNG
    EUR_H1_08_12_10.PNG
    43.9 KB · Views: 85
Sive,
as always, thank you for your analysis. Two questions:
1. "Market just reaches 100% expansion of Gartley's AB-CD "Buy" pattern that Agrees with 50% support area from the whole move up." - that area would be 1.3200 - 1.3220?
2. Untill the stop loss for the Swiss that you mentioned yesterday (0.9960) is not broken the possible scenario for the swiss (movement to the downside) remains in force?

Thank you

Hi, MidnightRun
1. Yes
2. Yes, the point is that 0.9960 - is almost the point from which current move has started and weekly pivot resistance1. Furthermore, to reach it market will have to break 4-hour Confluence resistance, weekly pivot and monthly pivot. If market will erase all these levels, obviously, further move down will be under question.
 
Back
Top