FOREX PRO Weekly May 23-27, 2011

Hi sive....

After looking at examples of DRPO's, I'm trying to put down some key points as a check list to determin wheather to take trades or not.

Would be very interested in some clarification on some of the points I've listed or corrections.

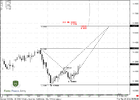
1 thrust, minumim 8 bars ( the more the better)

2 greater distance from the 3x3 better and as little consolidation during the thrust as possible

3 best if it devleops at major S/R and/or confluence

4 first penitration shallow (would you not take trades if the pentration is deeper than say .5 fib retrace?)

5 second penetration should be as few bars as possible from first penetration (what would you consider too many bars in a good DRPO? )
And would higher highs (or lower lows) in second penetration negate this in some small way?


6 price consolidation after a confirmed dpro can indicate a pending failure ?

7 you have mentioned that signals on lower time frames such as 1hr can lead to failure... would you take these only as confirmation in combination with other signals such as the example on the EURUSD yesterday?

do you often take the reverse position in a failed pattern?

Thanks so much for your continued efforts
P

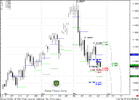
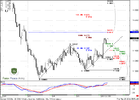
in this example .. although it is coiling on daily, and this is 1 hr ... all that aside, would this qualify as a reasonable example ?

thanks again

Everything correct, except
point 3. Here is a confusion of DRPO and B&B. DRPO during first penetration should not reach significant Fib level.

The major difference between DRPO and B&B is that DRPO is a reverse pattern, while B&B continuation.

There is could be some difference between peaks of DRPO, but it should not too large.
Well, speaking about number of bars in consolidation between tops. Look at the thrust. If it takes 10 -12 bars - it should not be longer than 6 bars I suppose.

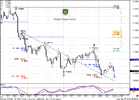
On your chart this is more probable B&B trade, because it seems that this is too deep penetration for DRPO.

Yes, there is exist DRPO "Failure" pattern. It assumes reversal of the position, that has been opened on direct signal.

For further clarification read DiNapoli "Trading with DiNapoli Levels". He has invented these signals.
 
EUR/USD Daily Update, Wed 25, May 2011

Good morning,
It's a bit difficult to analyze market in current environment. Is it coiling due strong support below the market, or due possible shifting in momentum?

On daily there is only one interesting thing - inside days again. If today trading session will be inside, then market is building an energy and we should be ready to some strong move.
Also I have some worries about the grade of bounce from weekly support. It's totally abscent - market has not shown any pullback. It's a bearish sign, but probably we should wait a bit more.

On 4-hour chart I've decided to shift to EW and take a look at the picture. You can see, that currenty 5-th wave is developing and potentionally points on some deeper retracement up. But I'm not the big fan of EW, hope this will help someone. Also, due to 5th wave - may be market will hit our first mentioned target at 1.3950. But we will know this only tomorrow.

What we can do today? Not much.
On hourly chart we see that market has reached 0.618 Fib support from previous move up. If market will hold here, then potentially it could turn to larger AB-CD with 1.42 target.
So, our time frames today 1-hour, 30 min and 15 min. Look for price behavior. If you will see some bullish signs, you may try to enter Long. It's a bit risky, but your stop will be tight.
This is only thing that I see currently. If market will not hold here - probably we should wait a bit more for clearer clues.
 

Attachments

  • EUR_D_25_05_11.PNG
    EUR_D_25_05_11.PNG
    44.6 KB · Views: 176
  • EUR_4H_25_05_11.PNG
    EUR_4H_25_05_11.PNG
    45.6 KB · Views: 176
  • EUR_1H_25_05_11.PNG
    EUR_1H_25_05_11.PNG
    41.3 KB · Views: 177
EUR/USD Daily Update, Thu 26, May 2011

Good morning,
Finally there are some signs, that probably market will show some solid bounce in mid-term perspective. Although here are just signs that point on bounce but not on its depth...

On daily there is nothing interesting still - 3 inside days and current trading session develops up. The major interest is linked with 1.42 area - here will cross pivot point and MACD Predictor. If market will shift daily trend bullish - this will give us more confidence with expectations of move to 1.4550

On 4-hour chart here is another animal - Crab "Sell". This is a possible perspective of upside move. Take a note that the targets of crab coincide with 0.618 Fib resistance - i.e. our target of momentum trade on weekly.

On hourly chart the major important issues for current trading session. Market has turned to larger AB-CD, as we discussed yesterday and has hit it's target already. But acceleration right to "D" point tells that market has not bad chances to continue.
Just above the market weekly pivot and 5/8 Fib resistance. So, we can count on some retracement, but it should not be deep. Probably we should keep an eye on 1.41-1.4110 area to search for buy opportunities. Stop looks reasonable somewhere below 1.4050.
 

Attachments

  • EUR_D_26_05_11.PNG
    EUR_D_26_05_11.PNG
    42.6 KB · Views: 124
  • EUR_4H_26_05_11.PNG
    EUR_4H_26_05_11.PNG
    37.4 KB · Views: 126
  • EUR_1H_26_05_11.PNG
    EUR_1H_26_05_11.PNG
    44.1 KB · Views: 131
Good Morning Sive,

What mean another animal - Crab "Sell" ? Looks like butterfly ?

Hi Jimmy,
It's almost the same, the major difference in depth of retracement inside the pattern and potential extension. You may treat it as Butterfly - you will not be wrong at all.

Hi Sive i might sound stupid ,the red line that indicates your trend on the daily chart ,is it a MA .

Hi Johan,
This DiNapoli MACD Predictor - derrivative from MACD. While MACD has two lines, MACDP - 1 line and instead of second line - price chart. It allows to see precise price when trend will change and some additional signals, like Stop grabber and Dynamic pressure.
But you may use simple MACD. They are the same.
 
Hi Jimmy,
It's almost the same, the major difference in depth of retracement inside the pattern and potential extension. You may treat it as Butterfly - you will not be wrong at all.


Hi Johan,
This DiNapoli MACD Predictor - derrivative from MACD. While MACD has two lines, MACDP - 1 line and instead of second line - price chart. It allows to see precise price when trend will change and some additional signals, like Stop grabber and Dynamic pressure.
But you may use simple MACD. They are the same.

Thanks Sive
 
Hi Jimmy,
It's almost the same, the major difference in depth of retracement inside the pattern and potential extension. You may treat it as Butterfly - you will not be wrong at all.


Hi Johan,
This DiNapoli MACD Predictor - derrivative from MACD. While MACD has two lines, MACDP - 1 line and instead of second line - price chart. It allows to see precise price when trend will change and some additional signals, like Stop grabber and Dynamic pressure.
But you may use simple MACD. They are the same.

Sive, Do you mind if I shared it with my friend and put in my personal blog.
 
Back
Top