nicolebobbin
Private
- Messages
- 76
I'm not sure what you mean.
If 14450 holds we can enter short.
EURUSD is currently at 14620.
Can you explain what you mean ?
Regards,
BackSpace
sorry, typo mistake, what I mean is 1.4650 level
I'm not sure what you mean.
If 14450 holds we can enter short.
EURUSD is currently at 14620.
Can you explain what you mean ?
Regards,
BackSpace
Hello Mr. Morten!
Thank you for sharing...
I noticed that you didn't mentioned pivots this week, except for the Monthly Pivot. Aren't they important? Right bellow the 31.8 support there is weekly pivot support 1. Isn't that the target of the current move down? I'm looking forward for the pivots lesson because I don't understand when do they come in play... :unhappy:
Hi Sive, could you make an example of what was, in your opinion, a nice entry point today, and where you have/would have put SL and TP? Eventually posting graph? It would be really useful.
Thank you!
Andrea
Hi Sive, could you make an example of what was, in your opinion, a nice entry point today, and where you have/would have put SL and TP? Eventually posting graph? It would be really useful.
Thank you!
Andrea
Hi Andrea,
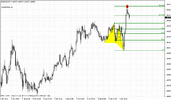
This is a 5 min chart. I wanted to attach it yesterday, but there were some problems with that.
Here you can see, excellent Butterfly Buy, that has ultimate target of 1.618 presicely at the same level - 1.4650. Market has hit it and then down move has started.
I place stop loss 40-50 pips, because if market triggers it - it negates H&S and Butterfly target: