- Forex, Gold, BTC Market Analysis | Trading Signals
- Forex News Daily Trading Signals
- Current Forex Trading Signals
You are using an out of date browser. It may not display this or other websites correctly.
You should upgrade or use an alternative browser.
You should upgrade or use an alternative browser.
Forex Signal (Tuesday October 18, 2011 NY TIME 4:30am EDT) – UK CPI
- Thread starter Stavro D'Amore
- Start date
Good Explanation
Excellent explanation Boko! You may want to copy your answer and paste it in a Word file...makes for a good place to copy/paste from later. Based upon my experience, you will be answering this question again and again and again and....
I'm not Pip Dog but I maybe can respond. Viewing what's happening with global stock markets can give you an indication of whether markets are in risk appetite or risk aversion mode. If they are up, it's appetite; if down, aversion.
Risk appetite=USD weakness. Risk aversion=USD strength.
So, for today, with major indices down at the time of this UK news (risk aversion), the "default" mindset would have been to look for opportunities to go long the USD. So short GU (which is long USD) would have been the favored position to be in. And per the price action at news, this is what played out obviously. Historically a +0.3 deviation on CPI sends GU up 50-70 pips, but today it only blipped up 30 pips, then plummeted down below pre-release.
Markets you can watch are FTSE, DAX, S&P 500 futures, ASX 200 (Aussie index), and Nikkei. A lot of demo MT4 platforms have those indices, so download like an FxPro demo and you can view them that way. Or, just use Yahoo finance and input the correct symbols for those indices and track them that way (you'll have to look up what the symbols are).
Hope that helps...
Excellent explanation Boko! You may want to copy your answer and paste it in a Word file...makes for a good place to copy/paste from later. Based upon my experience, you will be answering this question again and again and again and....
Markets you can watch are FTSE, DAX, S&P 500 futures, ASX 200 (Aussie index), and Nikkei. A lot of demo MT4 platforms have those indices, so download like an FxPro demo and you can view them that way. Or, just use Yahoo finance and input the correct symbols for those indices and track them that way (you'll have to look up what the symbols are).
Hope that helps...
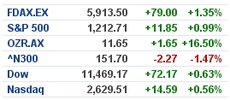
It really did help, once again, thank you for such a clear and informative explanation! I followed your advice and added those mentioned stocks to yahoo finance. Here is the snapshot of my modified yahoo finance. I did not delete 2 default ones: dow and nasdaq..but do we really need them for this purpose? Also the asx 200, there are so many different asx's..do you think this is the correct one (OZR.AX)?
And a very basic confirmation: when (almost) all are (clearly) down or at least, let's say, red, it means that at that moment risk aversion is on, and we should only buy USD, right? ..and that's for all USD-pairs, or is it mainly valid for gbpusd, audusd, nzdusd and eurusd..not usdjpy nor usdchf, due to last two being also a "safe haven" ones?
PipDog, what stocks do you usually look at?
Attachments
Last edited:
Boko Maru
Sergeant
- Messages
- 250
I really did help, once again, thank you for such a clear and informative explanation! I followed your advice and added those mentioned stocks to yahoo finance. Here is the snapshot of my modified yahoo finance. I did not delete 2 default ones: dow and nasdaq..but do we really need them for this purpose? Also the asx 200, there are so many different asx's..do you think this is the correct one (OZR.AX)?
And a very basic confirmation: when (almost) all are (clearly) down or at least, let's say, red, it means that at that moment risk aversion is on, and we should only buy USD, right? ..and that's for all USD-pairs, or is it mainly valid for gbpusd, audusd, nzdusd and eurusd..not usdjpy nor usdchf, due to last two being also a "safe haven" ones?
PipDog, what stocks do you usually look at?
That looks pretty good. For ASX, try symbol XJO, and for DAX just use "DAX." Using DOW along with or instead of S&P 500 I think is fine, as they are closely correlated. NASDAQ is probably unnecessary.
Yes, when all are down, that generally means risk aversion is in play, and you should expect USD strength. So shorting GU, EU, AU, NU, etc. And yes, I'd avoid USDJPY for sure, but possibly you could trade USDCHF, although I don't think it's your best bet. If you did want a "USD first" pair to trade this way, try USDCAD. If you check on a chart, that pair is inversely correlated to S&P 500 (i.e. if S&P up, USDCAD down, etc.)
One note though: determining the current "market sentiment" is not an exact science, but more of an art. And the stock indices we're talking about are actually only showing what the sentiment WAS, not necessarily what it is right now or what it will be. Also, there is long term and short term sentiment, and they can be different. However, watching the stock indices we're talking about is a great way to at least get a handle on what's going on. If you use this and nothing else to determine sentiment, you'll be right many more times than wrong. But just don't take it as something infallible.
Seems like you have a very good handle on it though
")
Boko Maru
Sergeant
- Messages
- 250
Excellent explanation Boko! You may want to copy your answer and paste it in a Word file...makes for a good place to copy/paste from later. Based upon my experience, you will be answering this question again and again and again and....
Ha, gotcha Pip Dog lol. I agree many traders don't fully grasp risk aversion/appetite, but as you know it sure does help your trading once it's understood.
Congrats on your pip gains today
Boko Maru
Sergeant
- Messages
- 250
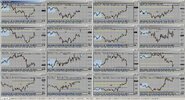
Hi Digamer; tried to edit earlier post with this attachment but couldn't. Anyway, fyi, this is an FxPro demo I keep up when trading. One quick look at it and I can get a sense of what's going on in the markets.
Bottom row is FTSE, DAX, and S&P 500 (then EURGBP too-didn't have room for it anywhere else). You can see the correlation between the moves in those indices and the strength or weakness of USD. Also you can see the inverse correlation between USDCAD and S&P 500.
Not saying you or anyone needs to setup a chart like this, but it's one good way to see what's up at a glance...
Attachments
Stock Indexs to Watch
When looking at setting up for FX trades, I will look to see what the Asian (Hang Seng and Nikkei), European, and US (SP500 or Dow Jones) markets and/or futures are doing. Boko is right in that how to make the call on Risk Aversion or Risk On is at least as much art as science. If you watch it long enough...I've done this for years...you will establish a correlation in your mind.
Ideally, I want flat stock markets for FX trades...then the FX news will drive the price action. If markets are down big...like this morning at the UK CPI trade, I am very leary about shorting the USD in any trade.
PipDog, what stocks do you usually look at?
When looking at setting up for FX trades, I will look to see what the Asian (Hang Seng and Nikkei), European, and US (SP500 or Dow Jones) markets and/or futures are doing. Boko is right in that how to make the call on Risk Aversion or Risk On is at least as much art as science. If you watch it long enough...I've done this for years...you will establish a correlation in your mind.
Ideally, I want flat stock markets for FX trades...then the FX news will drive the price action. If markets are down big...like this morning at the UK CPI trade, I am very leary about shorting the USD in any trade.
Boko Maru, many thanks for clearing this out and for your chart. I've never fully understood this concept to the level of using it with, at least, some confidence...until today. Much appreciated!
PipDog, thank you, as well, for your always direct and informative replies!
I'm glad to have a possibility to learn from you guys!
Good trading!
PipDog, thank you, as well, for your always direct and informative replies!
I'm glad to have a possibility to learn from you guys!
Good trading!
Boko Maru
Sergeant
- Messages
- 250
How would you define a flat market and a strong risk aversion/appetite mode? Like DOW +50 points is that flat enough? If its +100 points is that risk appetite already? Thanks for sharing. Boko whats your take on this as well?
My take is that there really is no set formula for determining things like that, as it's more getting a "feel" for what's happening in the markets. What's the market sentiment? Is there overriding pessimism or optimism occurring? If you can answer that accurately, then trading gets a lot easier, as you simply look for entries in line with that sentiment.
Watching the stock indices is one way to get this sense of the markets, but in my opinion you also need to be reading some news as well. You might try having Forex Live up while you trade: Forex News by Forex Live Read through just the headlines to get a sense of what's up. You can also use Talking Forex for a live audio feed: Talking Forex - First for FX News
As has been mentioned, determining aversion or appetite is probably as much art as science. However, re. your question, I usually look at % gain/loss in the indices rather than points. How much constitutes risk aversion/appetite? Again, no set answer for that, but obviously a 2% move in the index for example is more significant than a 0.50% move, etc. Anything beyond a 0.50% move I'd consider at least somewhat significant. These days it's nothing to have indices move 2-3% in a day.
You might consider just sticking a moving average on your indices charts to get a sense of trend also. I like to use a 50 EMA.
Personally though, if I don't have a good sense of what the sentiment is, I either trade conservatively, or I stay out altogether. So for me, a truly flat market is a time to stay out. But possibly Pip Dog might have some other comments about flat markets.
When risk aversion/fear is gripping the markets for example, it's pretty darn obvious. So I prefer to trade when the scenario is fairly clear one way or the other. If I really have no clue, I'd rather just stand aside until it is clear.
Similar threads
- Replies
- 0
- Views
- 7
- Replies
- 0
- Views
- 18
- Replies
- 0
- Views
- 12
- Replies
- 0
- Views
- 6
- Forex, Gold, BTC Market Analysis | Trading Signals
- Forex News Daily Trading Signals
- Current Forex Trading Signals