Sive Morten
Special Consultant to the FPA
- Messages
- 18,681
Monthly
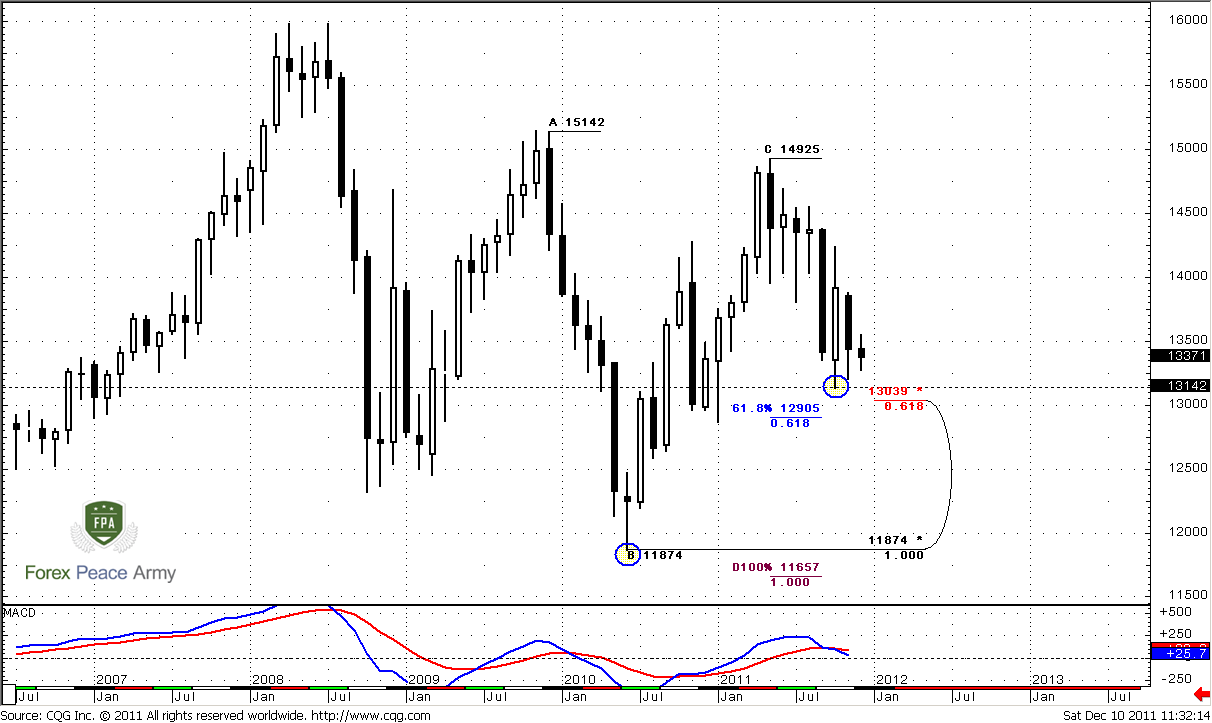
December candle remains almost the same, so there is nothing to add on monthly chart and I’ve left analysis intact. Our long-term forecast, that assumes possible move to 1.15 area still holds. Monthly trend is bearish, and, in general, we can see downward move during November. Market stands neither at oversold nor at overbought, next support area is 1.2905-1.3040. Pay attention that as this target as next one around 1.15 area stands below previous lows. It means that these lows hardly will hold if market will reach them, of cause.
Weekly
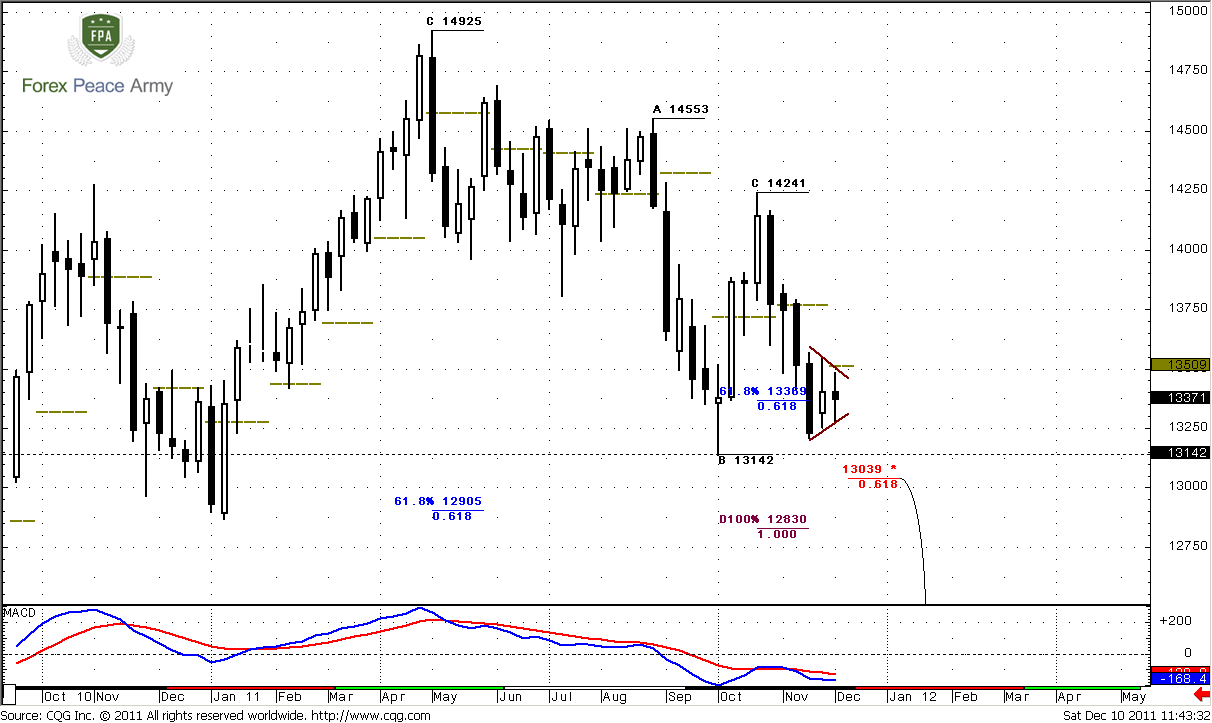
Here we see another inside week – it does not add much action on the chart. Weekly trend is bearish. Our major focus in medium-term perspective is most recent AB=CD pattern with target at 1.2830 and weekly oversold – very close to monthly Agreement. Monthly and weekly analysis tell that market should continue move to the downside, at least to 1.28-1.30 area – both trends are bearish, no oversold and absence of any solid support levels below the market. Currently we just see some kind of tight consolidation that probably could be treated as pennant. From classical approach, if market will show downward breakout, then move should be equal to mast of pennant – this is about 1000 pips till 1.22 area.
Daily
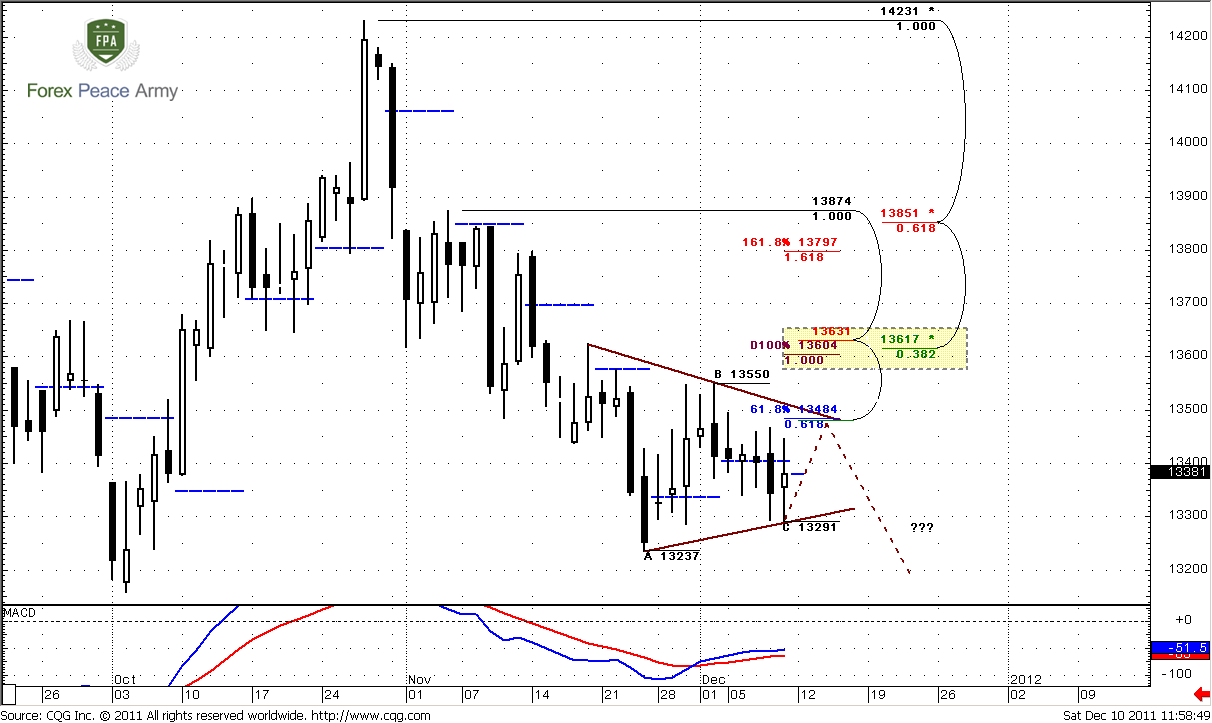
Finally daily time frame gives us at least possible scenarios for near future. Since trend still holds bullish, it tells that deeper upward retracement is still possible. Although market has closed below pivot point – this is not tells much, since market trades inside the triangle pattern, or weekly pennant. So what are two possible ways of development? First one is a classical downward breakout of triangle. Usually market ping-pong inside triangle with 5 waves – we see that 3 waves have been completed already. The 4th wave should be to the upside, during 5th wave market should break triangle. Also additional bearish sign is if 4th wave will not be able to reach upper border of triangle. If you take a look at AB-CD pattern inside the triangle, you’ll see that 4th wave could stop at 0.618 extension around 1.3484.
Second possible pattern is Gartley “222” if market will break triangle to upside. Then AB=CD creates Agreement with daily K-resistance area around 1.3605-1.3630.
That situation allows as create a trading plan. First, trend holds bullish, and both scenarios assume some upward move but to different targets. So, if you are bearish you should wait of 1.3484 or 1.3630 area. Bulls have no context to trade on daily time frame now, since weekly trend is bearish, only those who trade on intraday charts - let’s take a look at them.
4-hour
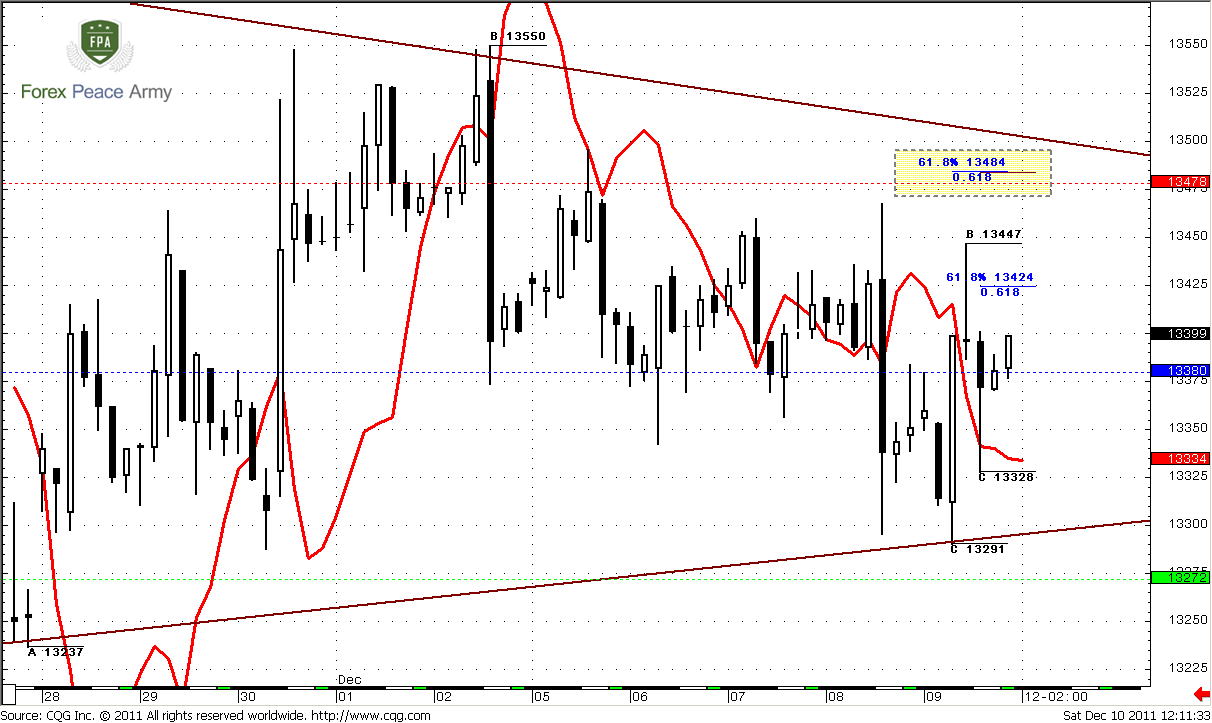
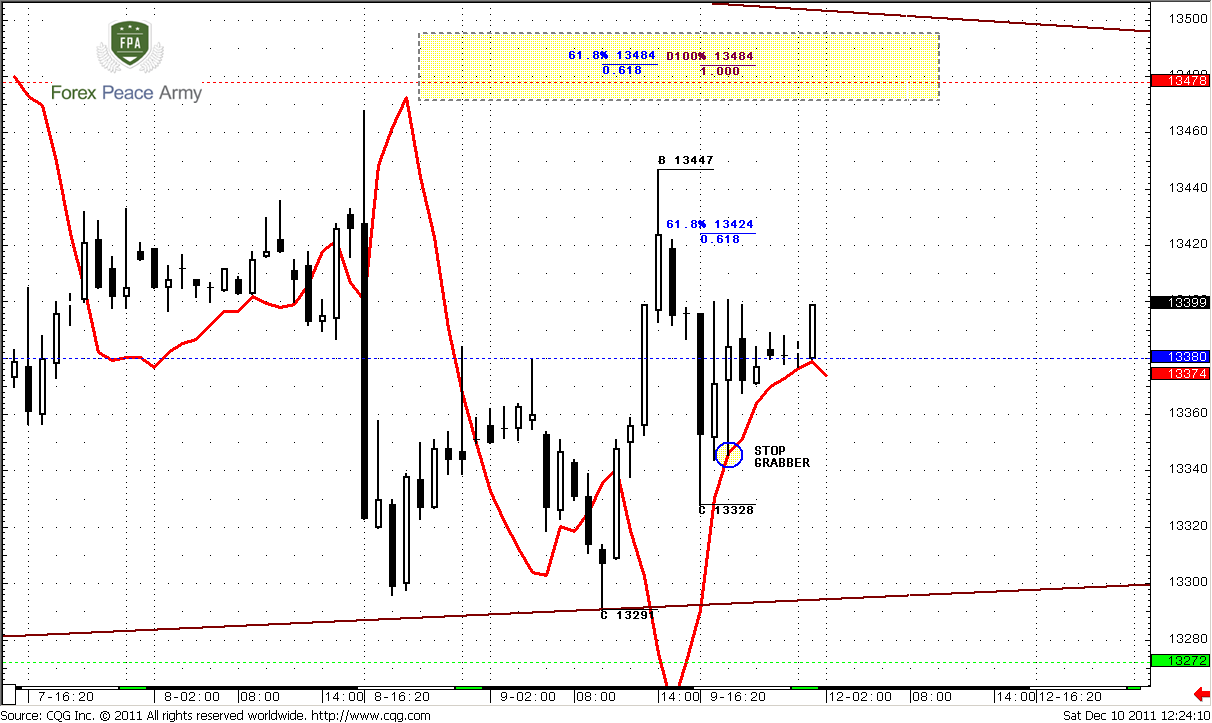
This time frame gives us some more details and they confirm potential upward continuation. First, 4-hour trend is bullish. Appearing of strong candles in opposite direction right near the low border of triangle points on momentum shifting in market behavior. Also pay attention that current pivot at 1.3380 coincides with classical support/resistance level inside the triangle, and now market has returned above it again. A bit later we see some kind of bullish stop grabber, may be it will work. It’s target at minimum 1.3447 high. Another important beacon is 1.3484 level. This is 0.618 target of daily AB-CD, that we’ve just discussed, also this is AB-CD target of recent pattern on 4-hour time frame, and what is more important – this is weekly pivot resistance 1 at 1.3478. This forces us to pay more attention to that level. As we’ve said when market holds in some bear trend and turns to retracement – this retracement usually to weekly pivot resistance 1. So, retracement should stop there and turn to triangle breakout. If market will move and hold above it, then 1.36-1.3630 becomes very probable.
Hourly
Hourly chart in general supports previous analysis. Trend holds bullish, there is another bullish stop grabber that suggests reaching of 1.3447 at minimum, but here price behavior with MACDP line looks much more attractive from bullish perspective. Since market has shown 0.618 retracement already next retracement probably will happen only after reaching 1.3434 0.618 target. But if it will come before that, those who trade intraday charts could try to enter long at nearest Fib support level around pivot point 1.3380
Conclusion:
Long-term bias holds bearish. It makes sense to hold long-term bearish positions.
Daily chart is forming potentially bearish patterns. Currently they could be either Triangle or “222” Sell pattern. If you’re bullish and trade daily – you have to sit on your hands, since weekly trend is bearish and you have no context to enter long. If you’re bearish – wait at least 1.3480 area to search for sell signals, or, if it will be “222” – 1.36-1.3630 area.
Intraday charts have bullish context, since all trend are bullish. Nearest target, I suppose is 1.3478-1.3485.
The technical portion of Sive's analysis owes a great deal to Joe DiNapoli's methods, and uses a number of Joe's proprietary indicators. Please note that Sive's analysis is his own view of the market and is not endorsed by Joe DiNapoli or any related companies.
December candle remains almost the same, so there is nothing to add on monthly chart and I’ve left analysis intact. Our long-term forecast, that assumes possible move to 1.15 area still holds. Monthly trend is bearish, and, in general, we can see downward move during November. Market stands neither at oversold nor at overbought, next support area is 1.2905-1.3040. Pay attention that as this target as next one around 1.15 area stands below previous lows. It means that these lows hardly will hold if market will reach them, of cause.
Weekly
Here we see another inside week – it does not add much action on the chart. Weekly trend is bearish. Our major focus in medium-term perspective is most recent AB=CD pattern with target at 1.2830 and weekly oversold – very close to monthly Agreement. Monthly and weekly analysis tell that market should continue move to the downside, at least to 1.28-1.30 area – both trends are bearish, no oversold and absence of any solid support levels below the market. Currently we just see some kind of tight consolidation that probably could be treated as pennant. From classical approach, if market will show downward breakout, then move should be equal to mast of pennant – this is about 1000 pips till 1.22 area.
Daily
Finally daily time frame gives us at least possible scenarios for near future. Since trend still holds bullish, it tells that deeper upward retracement is still possible. Although market has closed below pivot point – this is not tells much, since market trades inside the triangle pattern, or weekly pennant. So what are two possible ways of development? First one is a classical downward breakout of triangle. Usually market ping-pong inside triangle with 5 waves – we see that 3 waves have been completed already. The 4th wave should be to the upside, during 5th wave market should break triangle. Also additional bearish sign is if 4th wave will not be able to reach upper border of triangle. If you take a look at AB-CD pattern inside the triangle, you’ll see that 4th wave could stop at 0.618 extension around 1.3484.
Second possible pattern is Gartley “222” if market will break triangle to upside. Then AB=CD creates Agreement with daily K-resistance area around 1.3605-1.3630.
That situation allows as create a trading plan. First, trend holds bullish, and both scenarios assume some upward move but to different targets. So, if you are bearish you should wait of 1.3484 or 1.3630 area. Bulls have no context to trade on daily time frame now, since weekly trend is bearish, only those who trade on intraday charts - let’s take a look at them.
4-hour
This time frame gives us some more details and they confirm potential upward continuation. First, 4-hour trend is bullish. Appearing of strong candles in opposite direction right near the low border of triangle points on momentum shifting in market behavior. Also pay attention that current pivot at 1.3380 coincides with classical support/resistance level inside the triangle, and now market has returned above it again. A bit later we see some kind of bullish stop grabber, may be it will work. It’s target at minimum 1.3447 high. Another important beacon is 1.3484 level. This is 0.618 target of daily AB-CD, that we’ve just discussed, also this is AB-CD target of recent pattern on 4-hour time frame, and what is more important – this is weekly pivot resistance 1 at 1.3478. This forces us to pay more attention to that level. As we’ve said when market holds in some bear trend and turns to retracement – this retracement usually to weekly pivot resistance 1. So, retracement should stop there and turn to triangle breakout. If market will move and hold above it, then 1.36-1.3630 becomes very probable.
Hourly
Hourly chart in general supports previous analysis. Trend holds bullish, there is another bullish stop grabber that suggests reaching of 1.3447 at minimum, but here price behavior with MACDP line looks much more attractive from bullish perspective. Since market has shown 0.618 retracement already next retracement probably will happen only after reaching 1.3434 0.618 target. But if it will come before that, those who trade intraday charts could try to enter long at nearest Fib support level around pivot point 1.3380
Conclusion:
Long-term bias holds bearish. It makes sense to hold long-term bearish positions.
Daily chart is forming potentially bearish patterns. Currently they could be either Triangle or “222” Sell pattern. If you’re bullish and trade daily – you have to sit on your hands, since weekly trend is bearish and you have no context to enter long. If you’re bearish – wait at least 1.3480 area to search for sell signals, or, if it will be “222” – 1.36-1.3630 area.
Intraday charts have bullish context, since all trend are bullish. Nearest target, I suppose is 1.3478-1.3485.
The technical portion of Sive's analysis owes a great deal to Joe DiNapoli's methods, and uses a number of Joe's proprietary indicators. Please note that Sive's analysis is his own view of the market and is not endorsed by Joe DiNapoli or any related companies.
