- Forex, Gold, BTC Market Analysis | Trading Signals
- Sive Morten- Currencies, Gold, Bitcoin Daily Video
You are using an out of date browser. It may not display this or other websites correctly.
You should upgrade or use an alternative browser.
You should upgrade or use an alternative browser.
FOREX PRO Weekly December 19-23, 2011
- Thread starter Sive Morten
- Start date
Venelin
Master Sergeant
- Messages
- 430
Hey, guys-on 30 min chart I see a potential for a B&B buy from around 1.3040 and later a butterfly sell from around 1.3120 level( in agreement 100% AB=CD)! Cheers!
So far is working pretty nice
")
Damian1987
Corporal
- Messages
- 149
hi can somebody tells me why GBPUSD is buyed heavily and also EURUSD
For 1,3130 area it's been calculated as a straong resistance area, price reached it once, bounced from it, reached it again....this is a very normal type of behaviour against resistance or support levels. read weekly analysis on page 1 of this thread until you undesrstand it.
So far is working pretty nice
I wuold say this is is B&B look-a-like (LAL). we should see at least 8 thrusting bars above 3x3 DMA . here we see some move up, consolidation, move up , consoloditation, and some closes below 3x3. and also this is 30-min chart, Dinapoli studies confirme better succes ratio of this directional signals for daily, weekly, and above time-frame. it's good to be aware of this signals on lower time frames in order to do NOT trade against them, however playh them carefullly. Target from B&B is .618 retracement of last swing (in this case, down) , so think about taking profit.
Sive Morten
Special Consultant to the FPA
- Messages
- 18,706
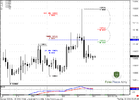
EUR/USD Daily Update, Wed 21, December 2011
Good morning,
How we just have said about curious silence market at once has shown solid move up.
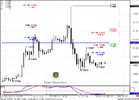
On daily time frame there are two important moments to watch:
1. Behavior around pivot - if market will close above it, then the next target will be daily K-resistance area and Pivot resistance around 1.3270-1.3290. Still this will not break overall bearish bias, since we know that in bear trend market very often retraces to pivot resistance 1.
2. Crossing with MACDP. If market will close above it today and holds there - it will turn intraday context to bullish and make moving to 1.3270-1.3290 more probable.
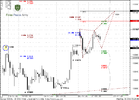
On 4-hour chart trend holds bullish well. Market is showing move with AB=CD pattern, and CD leg is much faster. Market has reached 1.0 extension at pivot point and upper border of daily flag pattern. Taking into account this price action, very probable that market could proceed to 1.3205 - 1.618 extension.
Hourly chart shows that market has reached 0.618 extension from most recent AB=CD and now is flirting with pivot by forming some kind of triangle pattern. Triangles very often coincide with butterflies - and here we see possible one. 1.618 target is 1.3185, 1.27 is very close to daily resistance at 1.3157.
The major level to watch is 1.3073 low - if market will take it, then butterfly will be cancelled, but this could shift to "222" buy pattern and Butterfly could shift to AB=CD move.
So if you still want to trade it on long side and want to anticipate any of this patterns - it's better to place stop below 0.618 support at 1.3052 and below D point of AB=CD pattern.
Good morning,
How we just have said about curious silence market at once has shown solid move up.
On daily time frame there are two important moments to watch:
1. Behavior around pivot - if market will close above it, then the next target will be daily K-resistance area and Pivot resistance around 1.3270-1.3290. Still this will not break overall bearish bias, since we know that in bear trend market very often retraces to pivot resistance 1.
2. Crossing with MACDP. If market will close above it today and holds there - it will turn intraday context to bullish and make moving to 1.3270-1.3290 more probable.
On 4-hour chart trend holds bullish well. Market is showing move with AB=CD pattern, and CD leg is much faster. Market has reached 1.0 extension at pivot point and upper border of daily flag pattern. Taking into account this price action, very probable that market could proceed to 1.3205 - 1.618 extension.
Hourly chart shows that market has reached 0.618 extension from most recent AB=CD and now is flirting with pivot by forming some kind of triangle pattern. Triangles very often coincide with butterflies - and here we see possible one. 1.618 target is 1.3185, 1.27 is very close to daily resistance at 1.3157.
The major level to watch is 1.3073 low - if market will take it, then butterfly will be cancelled, but this could shift to "222" buy pattern and Butterfly could shift to AB=CD move.
So if you still want to trade it on long side and want to anticipate any of this patterns - it's better to place stop below 0.618 support at 1.3052 and below D point of AB=CD pattern.
Attachments
Triantus Shango
Sergeant Major
- Messages
- 1,371
hi can somebody tells me why GBPUSD is buyed heavily and also EURUSD
here you go: Euroland euphoria on Mario Draghi bank rescue | ForexLive
Triantus Shango
Sergeant Major
- Messages
- 1,371
nice bull run!
Triantus Shango
Sergeant Major
- Messages
- 1,371
3199--brutal reversal!!
mr market not only is grumpy but rude.
mr market not only is grumpy but rude.
WaveRider
Master Sergeant
- Messages
- 350
Thanks, Sive. I got 120 pips over the last 5 trading days because of your help including 22 this morning. Have you noticed that you personally are becoming a better trader because of your posting every morning on FPA and also because of the school? Just curious.
Sive Morten
Special Consultant to the FPA
- Messages
- 18,706
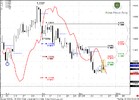
EUR/USD Daily Update, Thu 22, December 2011
Good morning,
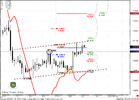
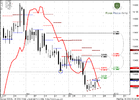
looks like finally we've got what we want - market has shown solid pattern on possible downward continuation and we've spoken about it yesterday. This is bearish stop grabber on daily time frame. Second important moment on daily is that the high of this pattern stands right between previous lows - 1.3142-1.3212, that is as we've said "perfect" for bears. Market just retested them from the downside.
So, our next target is 1.2830-1.2880 level. Also we can't exclude continuation to 1.2750 due reasons, that we've discussed in weekly analysis.
After that some deep retracement is possible, because market now at monthly Agreement.
On 4-hour time frame, we see that trend has turned bearish after market has reached 1.618 target of our AB-CD and has shown failure break of daily flag.
Hourly trend slightly bullish, and market turns to some retracement. Most probable level, that this retracement could reach is 1.3106-1.3109 - Agreement near weekly pivot. Since market is not at oversold and both trends are bearish - market should not show deep retracement. Absolute failure point is a high of stop grabber at 1.3224, but if even market will move above pivot and hold there - this will be worry sign.
Also market could show even smaller retracement to 1.3083 - 0.618 extension. So, you should decide how you will act in current circumstances.
Good morning,
looks like finally we've got what we want - market has shown solid pattern on possible downward continuation and we've spoken about it yesterday. This is bearish stop grabber on daily time frame. Second important moment on daily is that the high of this pattern stands right between previous lows - 1.3142-1.3212, that is as we've said "perfect" for bears. Market just retested them from the downside.
So, our next target is 1.2830-1.2880 level. Also we can't exclude continuation to 1.2750 due reasons, that we've discussed in weekly analysis.
After that some deep retracement is possible, because market now at monthly Agreement.
On 4-hour time frame, we see that trend has turned bearish after market has reached 1.618 target of our AB-CD and has shown failure break of daily flag.
Hourly trend slightly bullish, and market turns to some retracement. Most probable level, that this retracement could reach is 1.3106-1.3109 - Agreement near weekly pivot. Since market is not at oversold and both trends are bearish - market should not show deep retracement. Absolute failure point is a high of stop grabber at 1.3224, but if even market will move above pivot and hold there - this will be worry sign.
Also market could show even smaller retracement to 1.3083 - 0.618 extension. So, you should decide how you will act in current circumstances.
Attachments
Similar threads
- Replies
- 1
- Views
- 69
- Replies
- 17
- Views
- 314
- Replies
- 8
- Views
- 213
- Replies
- 0
- Views
- 46
- Replies
- 7
- Views
- 210
- Forex, Gold, BTC Market Analysis | Trading Signals
- Sive Morten- Currencies, Gold, Bitcoin Daily Video