Sive Morten
Special Consultant to the FPA
- Messages
- 18,695
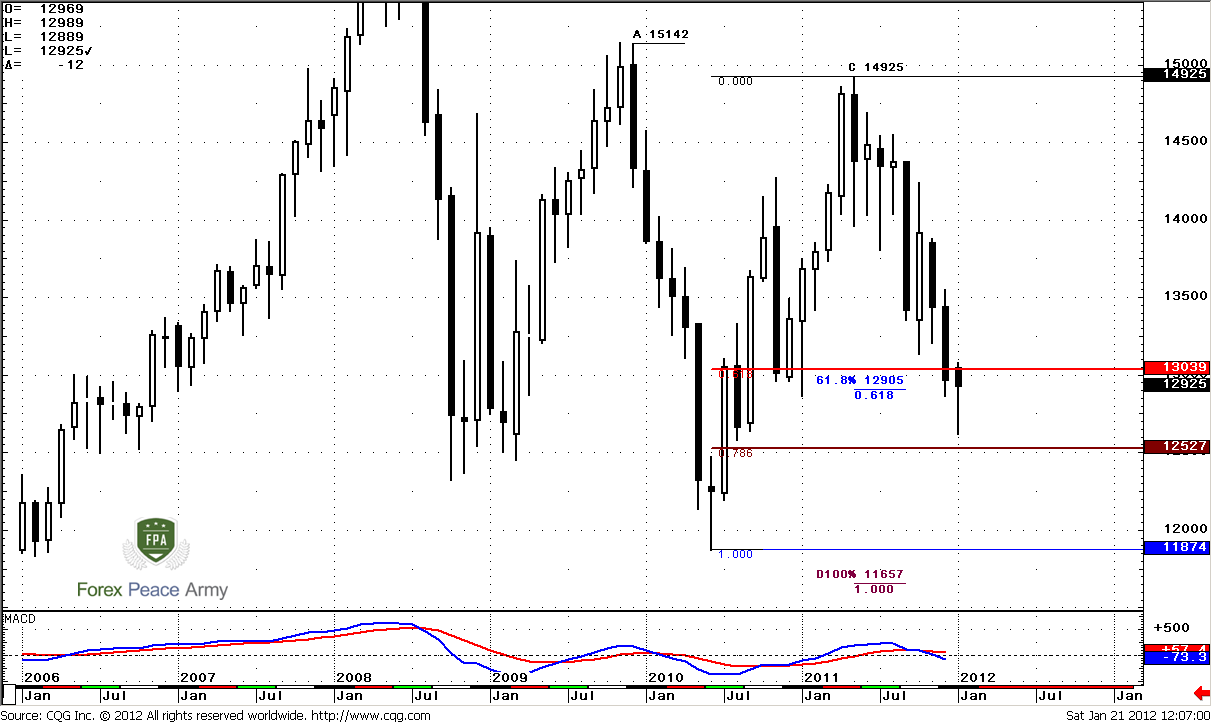
Monthly
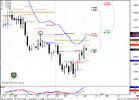
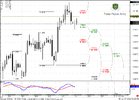
Trend is strongly bearish, market is not at oversold. We see now some pullback to the upside. Personally, I a bit confused how to treat it – still as a respect of Agreement area or as pullback from 0.786 support. Was it too deep penetration of Agreement area – decide by yourself. Still, if you will treat area between 0.768 and 0.618 as some support zone, then we might say that market has found some support here, and may be we will see some notable retracement. That reminds me widespread situation, when you expect something and get a thought that this even will not come at all right at the moment when it starts.
Well, probably that’s all that we need from monthly chart – market in some support area and we can expect bullish signs on lower time frames. We do not need much trend direction, since most of us do not trade on monthly chart.
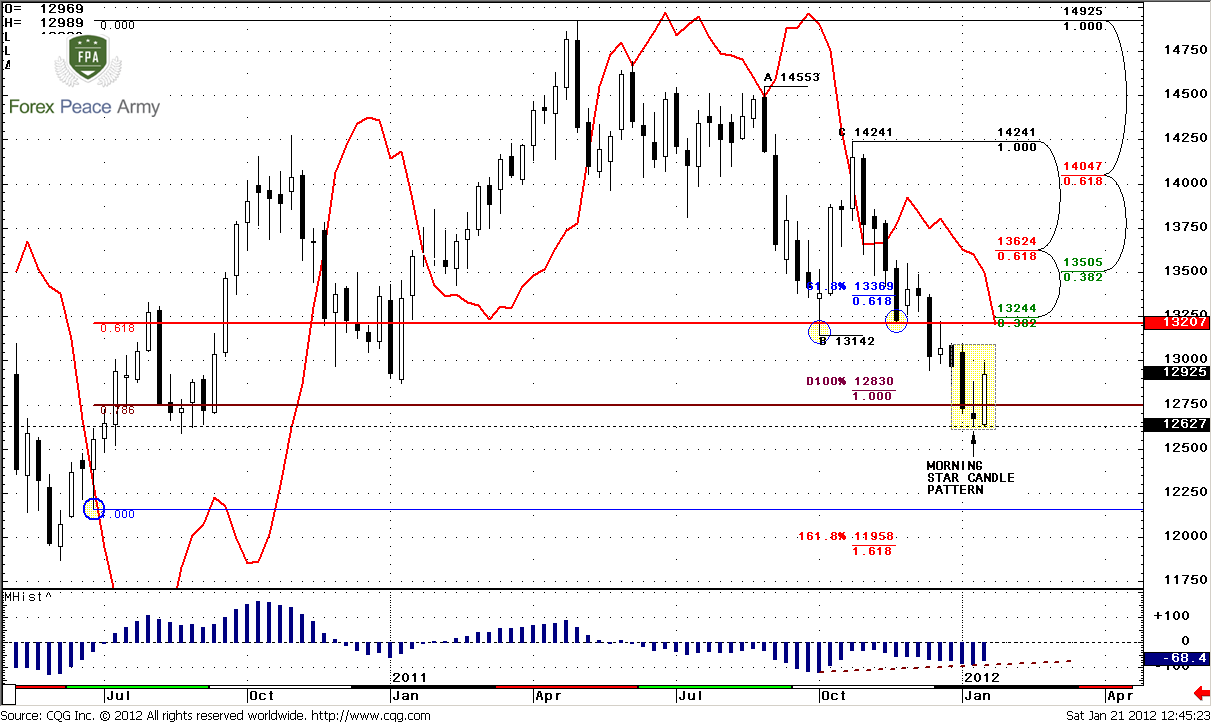
Weekly
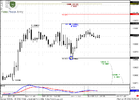
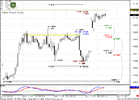
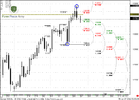
This chart is a bit overloaded with details, but we need all of them. First, probably we can explain, why market has bounced right from that level, if we choose as reaction low a bit higher level 1.2157 instead of major one 1.1874 – take a look at blue circle in left bottom corner of the chart. In this case you might see that market as better response on touching 0.618 support as it has reached 0.786 support.
Trend is bearish, but if you apply simple MACD you will not get any divergence. Here I’ve decided to use MACD Histogram. I like this indicator to monitor changes in market’s momentum. Here we can see by divergence that momentum has become slightly weaker. You can find another bullish sign, if you compare slope of AB and CD legs of our AB-CD pattern that has been completed recently. CD leg is slower. This usually makes support at D point stronger and could lead to deeper retracement.
Finally, market has formed Morning star candlestick pattern. Although it is not 100% perfect, but I suppose we can treat is like that. This gives us large advantage, since hope on bullish pullback will stand alive as long as market will hold above 1.2627 low of this pattern. If market will close below it – then odds will shift to downward continuation and this pattern will be vanished.
Now, how deep retracement could be? First important level is 1.3244 Fib resistance. Also take a note that trend will hold bearish right till that area. Next significant resistance is 1.3505-1.3624 K-resistance. Unfortunately we do not have any Fib extensions to estimate it more precise, so may be we will find something on lower time frames.
Daily
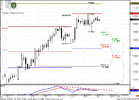
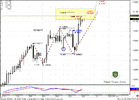
Let’s start here from the chart that has a lot of relation to weekly one. Daily trend is bullish and market has not reached overbought level yet. We see that market has started reversal more or less from 3-Drive pattern completion point. As we already specified many times, the minimum potential target of 3-Drive “Buy” is a high between 2nd and 3rd drives that should be taken out. This is 1.3224 level. Interesting, that particularly this level stands in agreement with nearest weekly Fib resistance 1.3244 and slightly higher than monthly pivot point 1.3129. Pay attention though, that monthly pivot also has not been traded yet and it stands right at overbought level of daily time frame. That’s, I suppose, minimum medium-term target that could be achieved during couple of weeks.
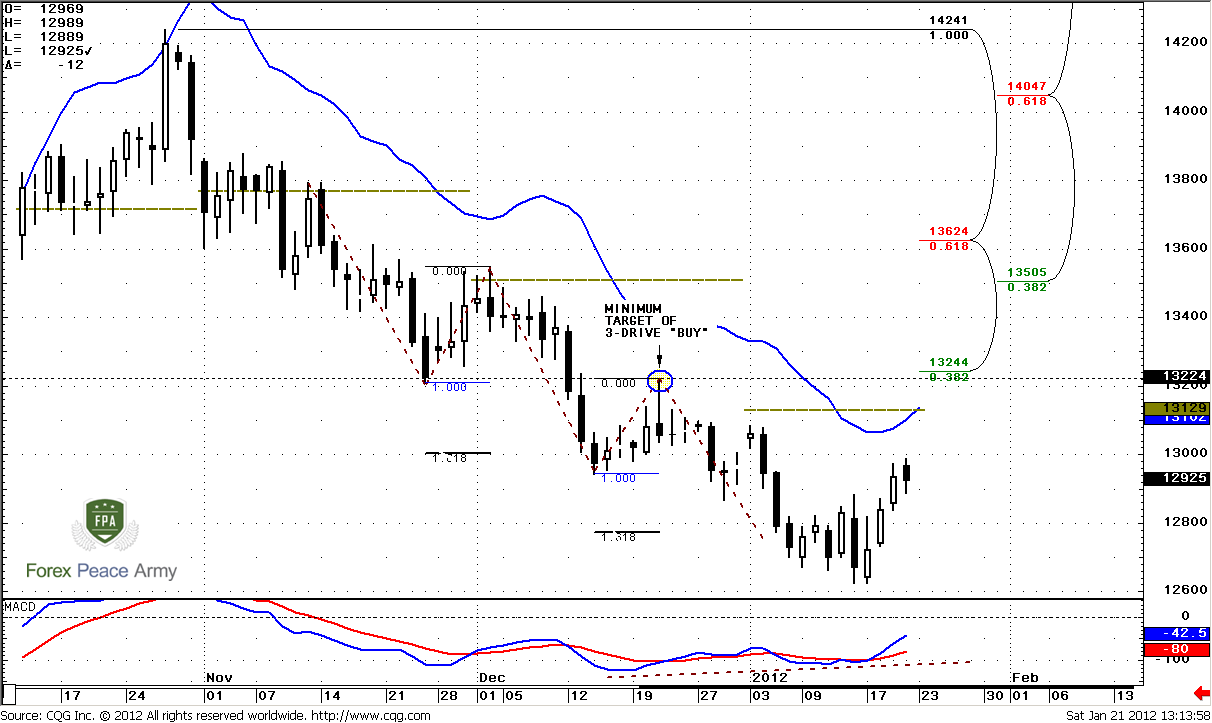
But since these weekly level stands beyond of daily overbought, it is not so interesting for us right in the beginning of trading week. Let’s take a look at another daily chart that is interesting from that stand point.
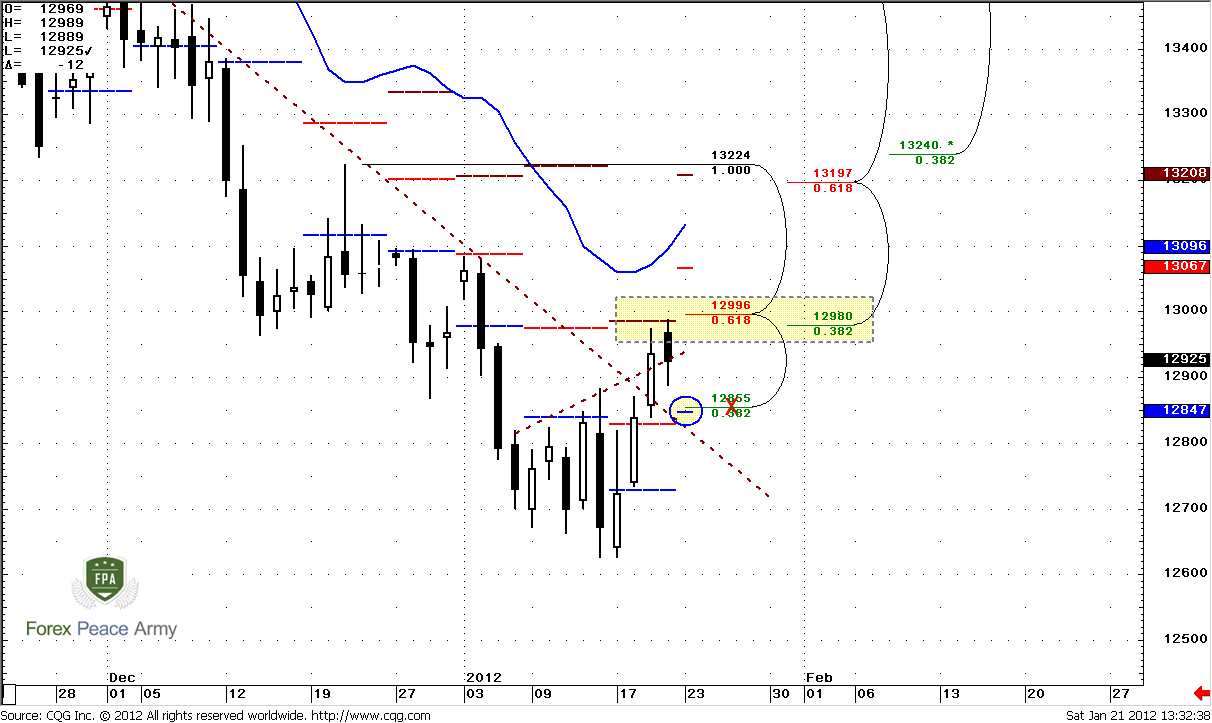
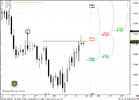
Looks like market has accomplished our conditions that give us confidence to think that probably deeper move up could happen – trend has shifted to bullish, market has broken broadening bottom pattern, long-term parallel channel and accelerated to weekly pivot resistance 2. This usually could be a sign of pause in bearish trend as deeper upward retracement or even reversal.
So, we’ve estimated that our context is bullish. Still, market has reached solid resistance area, that includes pivot resistance 2, daily K-resistance 1.2980-1.996, and as we’ve specified on Friday, some retracement could come that we can use to enter on long side of the market.
4-hour
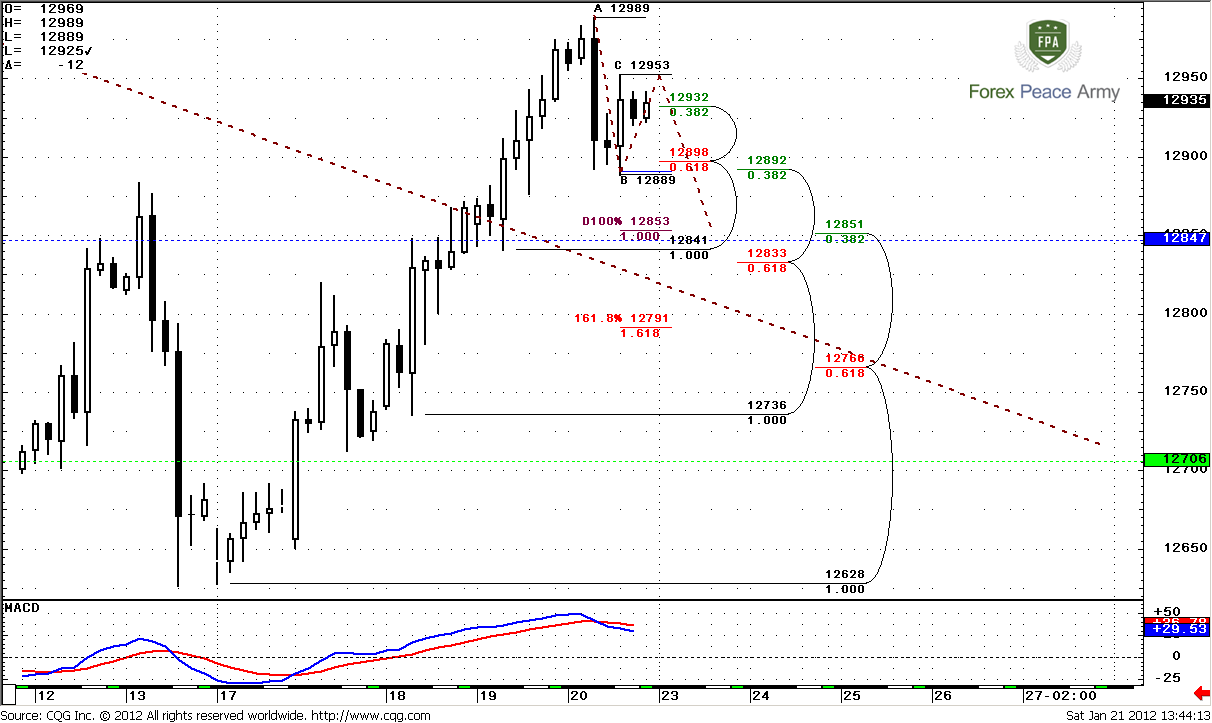
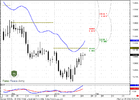
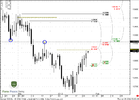
Bearish 4-hour trend suggests that market probably will show deeper retracement. But first take a look – market has perfectly accomplished B&B “Buy” directional pattern that we’ve discussed on Friday. It has found support at 1.2892-1.2898 K-area and has hit by upward retracement from this level 0.618 resistance, so B&B trade has completed.
Now, next area that is worthy of our attention is 1.2833-1.2851. This is K-support and Agreement with potential AB=CD pattern, weekly pivot 1.2847 and also broken upper border of daily parallel channel. Market very often tends to retest significant levels after breakout. So that is our number 1 to monitor level on Monday.
1-hour
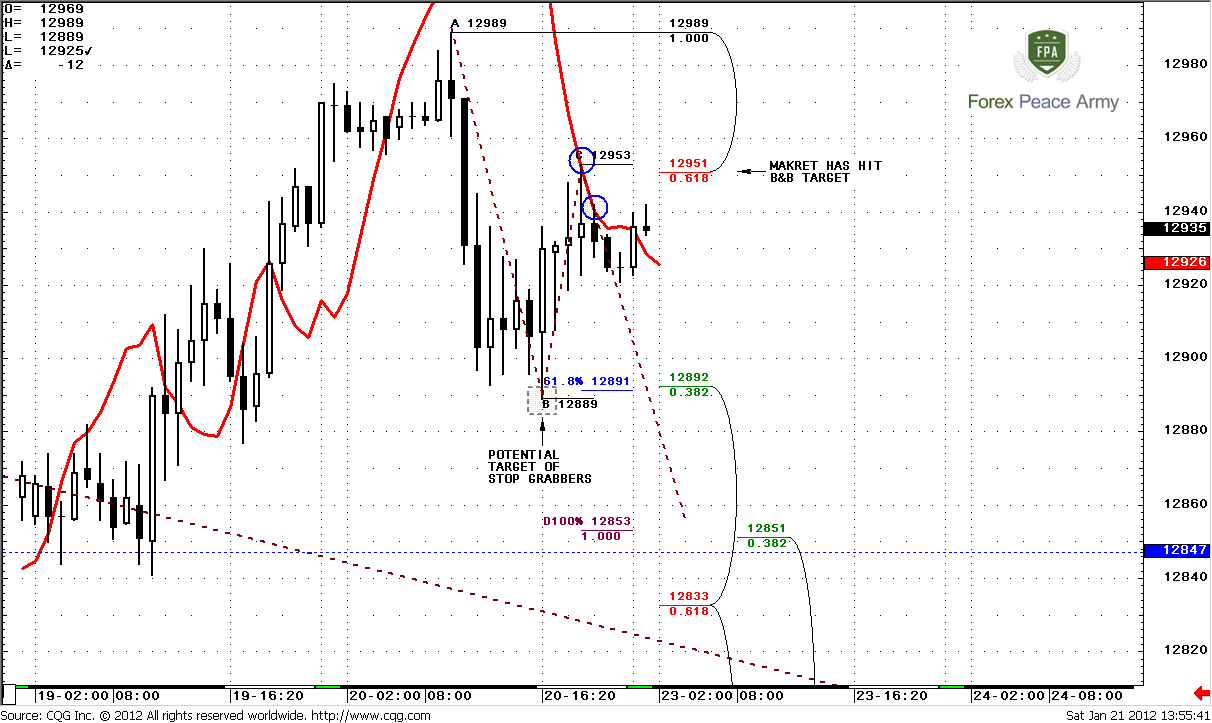
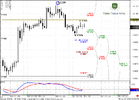
I suppose that hourly time frame does not contradict to 4-hour. Although trend is bullish, but previously we have two side-by-side stop grabbers that weren’t erased yet. If market will move above 1.2953 then hourly situation will need additional clarification, but currently it seems so, that market is ready for some deeper move. Stop grabbers suggest that market should take out 1.2889 low. This issue stands in a row with 4-hour picture that assumes move to 1.2850 area.
Conclusion:
Long-term bias still holds bearish. Although currently we have some hints on potential upward retracement, but now we have not any signs how deep it could be. Currently potential move to 1.16 level was not cancelled. Still, may be it makes sense to take some chips of the table and re-enter when signs of retracement finish will come – may be it will be even weekly directional trade - B&B or DRPO. So, any retracement to significant Fib level (B&B) could be used for enter short without scare been trapped in wrong direction, mostly because this will be first retracement that usually sold-off by new participants.
Daily context is bullish, but market now stands at solid resistance and we need to wait pullback completion to enter long. Medium-term target that logic suggests is 1.3220 level.
As 4-hour trend holds bearish, it points on possible deeper move down and our preferable level to watch as suitable to enter long on Monday is 1.2830-1.2850
The technical portion of Sive's analysis owes a great deal to Joe DiNapoli's methods, and uses a number of Joe's proprietary indicators. Please note that Sive's analysis is his own view of the market and is not endorsed by Joe DiNapoli or any related companies.
Trend is strongly bearish, market is not at oversold. We see now some pullback to the upside. Personally, I a bit confused how to treat it – still as a respect of Agreement area or as pullback from 0.786 support. Was it too deep penetration of Agreement area – decide by yourself. Still, if you will treat area between 0.768 and 0.618 as some support zone, then we might say that market has found some support here, and may be we will see some notable retracement. That reminds me widespread situation, when you expect something and get a thought that this even will not come at all right at the moment when it starts.
Well, probably that’s all that we need from monthly chart – market in some support area and we can expect bullish signs on lower time frames. We do not need much trend direction, since most of us do not trade on monthly chart.
Weekly
This chart is a bit overloaded with details, but we need all of them. First, probably we can explain, why market has bounced right from that level, if we choose as reaction low a bit higher level 1.2157 instead of major one 1.1874 – take a look at blue circle in left bottom corner of the chart. In this case you might see that market as better response on touching 0.618 support as it has reached 0.786 support.
Trend is bearish, but if you apply simple MACD you will not get any divergence. Here I’ve decided to use MACD Histogram. I like this indicator to monitor changes in market’s momentum. Here we can see by divergence that momentum has become slightly weaker. You can find another bullish sign, if you compare slope of AB and CD legs of our AB-CD pattern that has been completed recently. CD leg is slower. This usually makes support at D point stronger and could lead to deeper retracement.
Finally, market has formed Morning star candlestick pattern. Although it is not 100% perfect, but I suppose we can treat is like that. This gives us large advantage, since hope on bullish pullback will stand alive as long as market will hold above 1.2627 low of this pattern. If market will close below it – then odds will shift to downward continuation and this pattern will be vanished.
Now, how deep retracement could be? First important level is 1.3244 Fib resistance. Also take a note that trend will hold bearish right till that area. Next significant resistance is 1.3505-1.3624 K-resistance. Unfortunately we do not have any Fib extensions to estimate it more precise, so may be we will find something on lower time frames.
Daily
Let’s start here from the chart that has a lot of relation to weekly one. Daily trend is bullish and market has not reached overbought level yet. We see that market has started reversal more or less from 3-Drive pattern completion point. As we already specified many times, the minimum potential target of 3-Drive “Buy” is a high between 2nd and 3rd drives that should be taken out. This is 1.3224 level. Interesting, that particularly this level stands in agreement with nearest weekly Fib resistance 1.3244 and slightly higher than monthly pivot point 1.3129. Pay attention though, that monthly pivot also has not been traded yet and it stands right at overbought level of daily time frame. That’s, I suppose, minimum medium-term target that could be achieved during couple of weeks.
But since these weekly level stands beyond of daily overbought, it is not so interesting for us right in the beginning of trading week. Let’s take a look at another daily chart that is interesting from that stand point.
Looks like market has accomplished our conditions that give us confidence to think that probably deeper move up could happen – trend has shifted to bullish, market has broken broadening bottom pattern, long-term parallel channel and accelerated to weekly pivot resistance 2. This usually could be a sign of pause in bearish trend as deeper upward retracement or even reversal.
So, we’ve estimated that our context is bullish. Still, market has reached solid resistance area, that includes pivot resistance 2, daily K-resistance 1.2980-1.996, and as we’ve specified on Friday, some retracement could come that we can use to enter on long side of the market.
4-hour
Bearish 4-hour trend suggests that market probably will show deeper retracement. But first take a look – market has perfectly accomplished B&B “Buy” directional pattern that we’ve discussed on Friday. It has found support at 1.2892-1.2898 K-area and has hit by upward retracement from this level 0.618 resistance, so B&B trade has completed.
Now, next area that is worthy of our attention is 1.2833-1.2851. This is K-support and Agreement with potential AB=CD pattern, weekly pivot 1.2847 and also broken upper border of daily parallel channel. Market very often tends to retest significant levels after breakout. So that is our number 1 to monitor level on Monday.
1-hour
I suppose that hourly time frame does not contradict to 4-hour. Although trend is bullish, but previously we have two side-by-side stop grabbers that weren’t erased yet. If market will move above 1.2953 then hourly situation will need additional clarification, but currently it seems so, that market is ready for some deeper move. Stop grabbers suggest that market should take out 1.2889 low. This issue stands in a row with 4-hour picture that assumes move to 1.2850 area.
Conclusion:
Long-term bias still holds bearish. Although currently we have some hints on potential upward retracement, but now we have not any signs how deep it could be. Currently potential move to 1.16 level was not cancelled. Still, may be it makes sense to take some chips of the table and re-enter when signs of retracement finish will come – may be it will be even weekly directional trade - B&B or DRPO. So, any retracement to significant Fib level (B&B) could be used for enter short without scare been trapped in wrong direction, mostly because this will be first retracement that usually sold-off by new participants.
Daily context is bullish, but market now stands at solid resistance and we need to wait pullback completion to enter long. Medium-term target that logic suggests is 1.3220 level.
As 4-hour trend holds bearish, it points on possible deeper move down and our preferable level to watch as suitable to enter long on Monday is 1.2830-1.2850
The technical portion of Sive's analysis owes a great deal to Joe DiNapoli's methods, and uses a number of Joe's proprietary indicators. Please note that Sive's analysis is his own view of the market and is not endorsed by Joe DiNapoli or any related companies.
") I hope we`ll have no issues viewing the web site next week! Спосибо большое!
I hope we`ll have no issues viewing the web site next week! Спосибо большое!