acetraderfx
AceTrader.com Representative
- Messages
- 1,109
27 May 2013 00:20GMT
Trend Daily Chart
Sideways
Daily Indicators
Falling
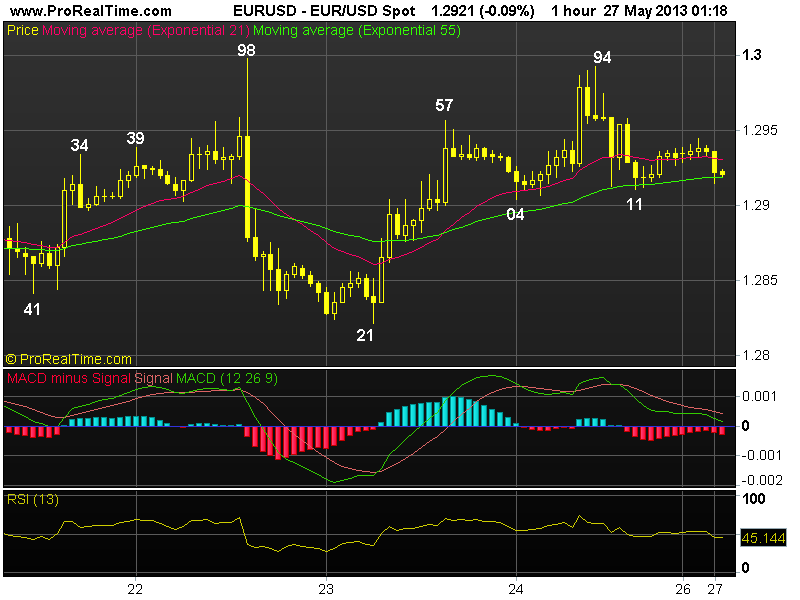
21 HR EMA
1.2933
55 HR EMA
1.2919
Trend Hourly Chart
Sideways
Hourly Indicators
Turning down
13 HR RSI
53
14 HR DMI
+ve
Daily Analysis
Initial recovery b4 down
Resistance
1.3085 - May 09 hourly sup
1.3030 - May 14 high
1.2998 - Wed's high
Support
1.2911 - Fri's low
1.2821 - Thur's low
1.2796 - May 17 5-week low.
EUR/USD - 1.2938 ... Euro went through several 'roller-coaster' sessions last week. The single currency rebounded strongly to 1.2998 on Wed b4 retreating swiftly to 1.2834 on hawkish Fed minutes. Price extended to 1.2821 on Thur b4 rebounding strongly to 1.2957. Euro rose to 1.2994 Fri n then dropped to 1.2911.
. As mentioned earlier, the price action fm 1.2796 (May 17 5-week low) is possibly developing into a 'triangle' with a-leg:1.2796-1.2998; b-leg:1.2821 n c-leg has possibly ended at 1.2994 last Fri, suggesting as long as strg res area at 1.2994/98 holds, consolidation with downside bias remains for another drop to 1.2904/11 sup area (Fri's Asian n NY low respectively), below wud bring further weakness to 1.2887 (61.8% r of 1.2821-1.2994), however, breach of 1.2821 sup
(Thur's low) needed to signal a downside break of 1.2796-1.2998 range has occured n yield resumption of decline fm this month's high of 1.3243 for re-test of said sup n then twds Apr's 4-1/2 month low at 1.2745 later.
. Today, selling euro on recovery in anticipation of another drop is still favoured with stop abv 1.2998, break wud risk stronger retrace. to 1.3030/33.