• Please try to select the correct prefix when making a new thread in this folder.

    Discuss is for general discussions of a financial company or issues related to companies.

    Info is for things like "Has anyone heard of Company X?" or "Is Company X legit or not?"

    Compare is for things like "Which of these 2 (or more) companies is best?"

    Searching is for things like "Help me pick a broker" or "What's the best VPS out there for trading?"

    Problem is for reporting an issue with a company. Please don't just scream "CompanyX is a scam!" It is much more useful to say "I can't withdraw my money from Company X" or "Company Y is not honoring their refund guarantee" in the subject line.
    Keep Problem discussions civil and lay out the facts of your case. Your goal should be to get your problem resolved or reported to the regulators, not to see how many insults you can put into the thread.

    More info coming soon.

Discuss BumbleBeeFX.com

General discussions of a financial company
Please login to account using Investor password and try again :)))
Account: 154660
Investor Pass: Investor2014
Server: 59.188.216.137:444
 
Ive read most of the thread on this EA,
off course seems awesome if it can do even a quarter what the broker statement says, and I wanted to believe it, but Ive seen too many things not make any money after looking so promising so I researched it best I could.
Im a programmer in 3 platforms, and Ive looked through some of the trade statement of bumblebee to try to piece together what its using as signals.
Problem is Ive found a false set of entry prices that look suspiciously different enough to me that Im unsure this system is legit.
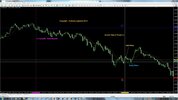
example is ticket: 1419406 for EURUSD buy of 2.1 lots, there is a 2 hour time difference to GMT of the chart Im going to try to attach so the account statement says 2nd Dec 2014 15:44 entry time, and my chart has 13:44 entry. And ive drawn a line and arrows showing where the entry price and exit prices supposedly were at minutes of :44 and :45. There is about a 2.5pip discrepency I can see in a price that is not that volatile to be any explanation, and remember this EURUSD on this trade not XAU or somewhere you expect to see much difference in teh quote prices from a different broker. the chart Im using is from dukascopy set to a custom 3 seconds, verify for yourself if you like, but this dont look good. the blue line is the entry price where the supposed buy was done, which means the ask price of the broker (which is off course above the bid price bars we're looking at) somehow got a buy in minute :44 exactly where the blue horizontal line is drawn, if you dont know what that means I just said above, then you should let others that do know, to comment on my post.

I welcome any informed comments and opinions, maybe ive overlooked something
The truth is more important than for me to be right.
View attachment 17833

Hello Recruit JasonSi,
.
Welcome to FPA! We really appreciate your participation; but programmer or not, you have made a most basic forex newbie error.
This is a common occurrence and should be of no concern to you, the other 50,000+ FPA members, or the general public at-large who now have access to your post.
Your confusion affords us an opportunity to again address this basic, but very important issue for all readers (especially for newer FX traders); and an opportunity for you all to avoid some serious pain as experienced by so many others in whose path you tread.
.
The test of BumbleBeeFx EA as posted on FPA is established on a broker that uses the standard rollover time, while your chart appears to be offset by 2 hours.
'Rollover Time' is that moment more commonly known in other markets as 'Settlement Time', after which you become obligated to pay (or shall receive) the swap premium calculated up to that moment for the time value of the margined currency position you choose to hold 'overnight' in the Quote Currency, relative to your Base Currency.
.
The MT4 platform never reports trades in your local CPU time or GMT time; rather it always reports trades on your 'Broker Server Time' within any MT4 Statement.
Contact your broker to learn your proper GMT offset, or go to your 'Chart Properties' and enable 'Period Separators' then examine an intraday chart timeframe like H1.
You will see the rollover time as a dotted vertical line each 24 bars (hours), except for possibly Sundays and Fridays. That time is your specific 00:00.
.
Industry standard is for brokers to roll at 5pm NY time daily, which starts their 24-hour clocks at their 00:00 when the forex market opens for the week each Sunday afternoon.
This time is key because it is dawn Monday on the international dateline, beginning the business week in Asia first and ending the week in the USA last.
This produces a precise 5x24 hour week with a close precisely at 5pm NY time on Friday (22:00 London).
.
Some brokers do not observe this standard. choosing to run on London time, Swiss time, GMT, Russian time, etc.
Most non-conformers roll at Midnight in London or GMT, which is sometimes 24:00 or 00:00 at this time of year (due to issues with Daylight Savings Time, etc.).
This ALWAYS results in 6 daily bars per week, with irregular Sundays and Fridays.
Although no impediment to experienced traders, this can result in wild deviations amongst inadequate EAs and confusion amongst inexperienced traders.
.
It appears your broker offset is different by 24 - 22 = 2.
This is the reason your chart examination seemed to result in suspicious activity.
You misinterpreted trades done two hours after the times you thought were shown in the statement.
"We have met the enemy, and he is us."
.
Due to your limited understanding of the FX market environment at this time, I highly recommended you attend the FPA Military School self-study course and avoid this EA like the plague, until you have a much stronger grasp of the serpent you intend to slay.

https://www.forexpeacearmy.com/fore...y-school-complete-forex-education-pro-banker/
.
Below, a markup of your ticket issue made from the real money historical account data my test will be running on shortly.
.
Ticket 1419406.jpg
 
Last edited:
Big Ti,
In my post I said I compensated for the obvious 2 hour difference in the server time, which I did, and I checked at least 4 other trades which all seemed to confirm the 2 hour offset and the direction of the 2 hour offset that I stated.

have you compared from an independent or the same broker feed what I have pointed out? Or just decided Im wrong without a fair look into it.

If you show me a graph that shows otherwise and a way for me to independently confirm this, I will be glad to apologize to all for my error if there was one on my part.
 
I see youve attached a chart, I thought it was just a copy of mine.

Edited ---

in your chart the minute :44 it doesnt seem to touch the supposed entry price at all, Same as in my chart.
 
JasonSi,
.
Review the chart I posted earlier, in detail.
It is from my broker: ATC Brokers of California clearing FXCM USA, as was clearly posted on it.
There is no meaningful deviation in time or price from any other legitimate broker with which I have dealings.
Perhaps you are unaware that I am an NFA registered CTA, and a senior member of FPA? I do not speak lightly, nor should you.
.
Perhaps also you are unaware that charting is done on BID price only.
When buying you are paying a price that will never be plotted.
There is no spread price indicated between buyers and seller; this is always an issue.
You must also recognize that these prices are sales accomplished and reported in RETROSPECT!
THE WHOLE POINT OF THIS EA IS IT IS IN AND OUT BEFORE THE BROKER EVEN FEELS IT!
DO YOUR REALLY EXPECT THE BROKER TO PLOT IT FOR YOU, LIKE SOME GIRLYMAN?
HE JUST GOT SHAFTED; THAT IS THE WHOLE POINT!
.
The differentials are in a few milliseconds, while your M1 chart has only 4 points needed to construct it: OHLC, AFTER THE MINUTE HAS ENDED!
So tell me how in an M1 chart a buyer above the market would appear in your 'Chart'?
THE ANSWER IS: HE DOESN'T!
Example:
Open:
1.12520
Low:
1.12515
High:
1.12582
Close:
1.12570
BOT: 92.0 LOT
1.12677
DONE
.
WHERE DOES MY TRADE APPEAR ON YOUR LOUSY CHART?
.
THERE ARE 60,000,000 MICROSECONDS IN A 1 MINUTE BAR; HELLO!
.
Since you seem to have reiterated your erroneous position, from now on please send me or the FPA forum any suspect information you have by private message first; should you have issues you think you can substantiate; for a rapid review.
.
This EA has generated so very much heat and interest that THIS THREAD cannot be permitted to tolerated nonsense or be entertained as a playground for ineptitude, for which you seem to have a penchant.
 
Last edited:
Lesson I learned in 1966:
"Engage Brain Before Putting Mouth in Motion"
 
Last edited:
BigT1

Ok, so are you saying both our charts, mine and yours didnt plot a tick (to show a low) for the minute of :44 that none the less crosses <= 1.24145 Ask price on the mentioned broker, so the trader caught a lucky spike downward in price of 2.5pips PLUS spread, since yes we cant all see the asking price but you and I both know on a mt4 platform the ask can not be below the bid price?

Ok possible. But since it isnt a pending order it is BUY (at market price) order this would be quite a fluke to say the least but I guess after hundreds of trades you may catch a fluke entry. But if this can happen on an entry with this particular broker, maybe it can happen on a stop loss too that doesnt show up on the chart, I wouldnt expect any observant clients to be happy about that. Do you see how unlikely this sounds to me?, since the broker needs to cover his back by the chart simply showing all prices that may have occurred in any time frame, So in answer to one of your questions, YES I do expect my broker to plot it for me when I have an open or close of a trade I expect that the relevant bid or ask price to have touched that price, but anyway that is getting a bit off the point.

As possible as the above being the case is (microscopic chance in my opinion), maybe its just me but Ill be just fine not buying this EA till I see some evidence from more brokers.
Jason
 
Back
Top