Sive Morten
Special Consultant to the FPA
- Messages
- 18,695
Fundamentals
Reuters reports The U.S. dollar posted its worst week in four against a currency basket on Friday after data showing a rise in consumer prices failed to alleviate concerns that recent soft U.S. economic data could delay the Federal Reserve's first rate hike. The dollar rebounded against major currencies in morning trading after data showed U.S. consumer prices rose 0.2 percent in March, while closely watched core consumer prices rose 1.8 percent year-on-year, inching closer to the Fed's 2.0 percent target.
The move was short-lived, however, as traders reverted to selling the dollar on the view that the data was not strong enough to offset a batch of weaker-than-expected economic readings for the first quarter, ranging from retail sales to housing starts.
"The markets feel that the small price increase is not enough to force a June rate increase," said Chris Gaffney, president of EverBank World Markets in St. Louis. Analysts are still pricing in just one rate increase this year, sometime late in the fourth quarter.
The euro's gain steered the dollar to its biggest weekly drop in four against a basket of major currencies. Analysts said the dollar has become more vulnerable to pull-backs given outsized bullish bets on the currency. The greenback had rallied by as much as 30 percent since last May, hitting 12-year highs in March. "We're going to see significant downward pressure at some point on equities as well as on the dollar as people are forced to reduce their long dollar position," said Sebastien Galy, currency strategist at Societe Generale in New York.
It was a bit difficult choice – what currency to choose for today’s discussion. Mostly I was looking either at GBP or at NZD. Still I’ve chosen GBP since it cares a bit more hidden moments and nuances, while on NZD situation is clearer.
And currently, guys, it is impossible to ignore election topic in UK.
As “Alpha now” tells it its article, the UK election is around a month away and a key focus of the debate is how much money the government should spend. This week’s chart looks at the level of public expenditure under different governing parties.
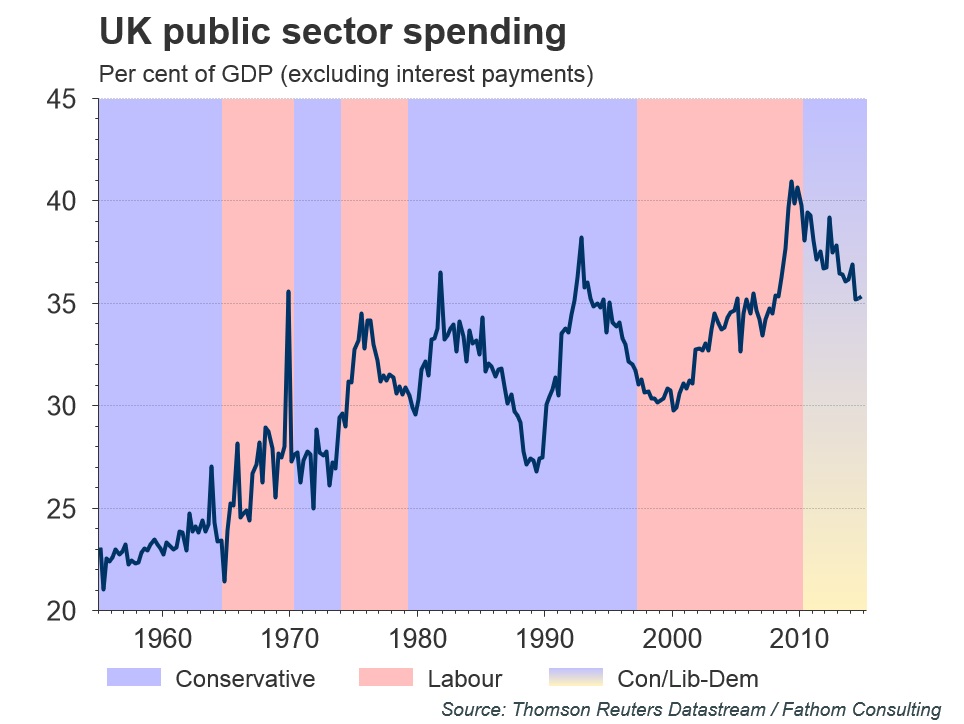 Public spending as a share of GDP has increased under every Labour government since the 1960s, while Conservative governments have generally kept public expenditure stable or falling. The difference in spending over time generally reflects the usual perceptions about the ideological differences between the Labour and Conservative parties. The same is true in this election. While both parties plan to reduce the deficit, the Labour party want to spend more over the course of the next parliament than the Conservative party.
In political terms the upcoming General Election on May 7th could be the least certain for generations. From the two-party politics of old there are now a range of possible outcomes which could include a range of different parties having some form of power.
While the political environment is uncertain, the economic backdrop is all-too clear. The artificial boost to the demand side of the UK economy has faded, and productivity continues to stagnate. Whatever the outcome of the election, the task of fixing the economy has barely begun. Dealing with the deficit may be a job half-done, but the task of fixing the supply-side of the UK economy has not even begun. That is a more important issue economically than the debate over the pace of deficit reduction.
Recent news on election battle comes from Scotland. In Scotland's biggest city, nationalists have triggered a once-in-a-century shift in political loyalties that could dash Labour leader Ed Miliband's dreams of winning the May 7 election and thrust secessionist 'kingmakers' to the heart of British power.
The shifting currents in Glasgow, the citadel of Scottish socialism for more than a century, show the seriousness of the nationalists' bid to end Labour's dominance of Scotland, a significant change in recent British political history.
The nationalist challenge could trigger events after the election that threaten the future of the United Kingdom and possibly its membership of the European Union.
Scots voted to preserve the United Kingdom in a Sept. 18 referendum but the once marginal Scottish National Party (SNP) has spent two decades persuading Scots that it is a worthy alternative to Labour, which many voters say has abandoned its Scottish heritage.
"We're recovering from a period where the Scottish Labour party wasn't strong enough, and it wasn't good enough. And that takes time," said Jim Murphy, leader of the Scottish Labour Party.
"We've got less than three weeks to turn it round but I'm confident that we can," said Murphy, a 47-year-old teetotal vegetarian who opinion polls show has so far failed to stem a flood of support from Labour to the SNP.
The destiny of Glasgow's once safe Labour seats will show whether Labour has lost Scotland, a defeat that would scupper Miliband's bid to win an overall majority in the 650-seat London parliament and potentially give the SNP a kingmaker position from which to bargain for more powers for Scotland.
The loss of Glasgow, a party stronghold for so many decades, would symbolise the extent of Labour's decline in Scotland and the emerging supremacy of the nationalists.
Labour won all seven of Glasgow's seats in the British parliament in the 2010 election with apparently unassailable majorities of up to 16,000 votes.
Now all but one are threatened by the SNP, according to John Curtice, professor of politics at the University of Strathclyde and Scotland's most respected opinion poll analyst.
"Glasgow North East is the safest Labour seat in the country and nobody has yet come up with an opinion poll that suggests it could be lost," he told Reuters. "But everything else in the city is absolutely up for grabs."
Labour became Scotland's biggest party in the British parliament in 1922 and the last time it lost Scotland in a national election was in 1955. By 2014, 45 percent of Scots would vote for independence.
In a small campaign office in a block of council flats, the SNP candidate for Glasgow Central, Alison Thewliss, is trying to sow the seeds of Labour's defeat.
Asked why so many Scots were turning away from Labour, she said: "They saw Labour joining up with the Tories during the referendum, and it's hurt people actually."
Labour's joint effort with the Conservative Party to urge Scots to reject independence alienated some voters, even those who support the 308-year-old union, she said.
'SENSE OF ENTITLEMENT'
Labour's potential loss of Scotland illustrates the divergence of England and Scotland and what many Scots see as an arrogant London political establishment that has failed to heed or address their needs.
While Conservative Prime Minister Margaret Thatcher moved England rightwards from 1979 to 1990, Scots stood opposed, especially to Thatcher's use of Scotland to test an unpopular poll tax.
Her successors, from John Major to Labour prime ministers Tony Blair and Gordon Brown, broadly accepted Thatcher's legacy while millions of Scots held to their socialist traditions.
Those traditions go back to the dawn of the British Labour movement when Keir Hardie, the Scottish trade unionist born in Glasgow in 1856, helped found the Labour Party.
As Blair moved Labour rightwards to win voters in England and established the Scottish parliament, the party assumed its Scottish flank would be secure.
That opened an opportunity for the SNP, which pitches itself as the social conscience of Scotland opposed to what leader Nicola Sturgeon calls the crumbling institutions of the London elite.
Just 12 years after the establishment of the Scottish Parliament, the SNP would topple Labour, winning a majority in the 2011 Scottish election.
"Labour has, from the 1970s, been regarded as the natural party of government in Scotland," said Stewart MacLennan, 64, a former Labour candidate who now backs the SNP.
But now Murphy is greeted on the campaign trail by SNP taunts that Labour, whose party colour is red, are the "Red Tories", in reference to the Conservatives' nickname.
'REAPING THE WHIRLWIND'
While the SNP has added members since the referendum, opinion polls show its share of the vote has risen just a few percentage points.
What has changed is that Scots now appear to have broken a tradition of voting SNP only in Scottish elections and have now also fixed their sights on the London parliament.
Such a change in voting habits could shake the foundations of Britain's political establishment.
A YouGov poll on April 8-9 found the SNP had 49 percent support in Scotland, with Labour on 25 percent. It was the biggest lead so far for the SNP and the lowest level for Labour since 2007 in a YouGov poll.
Under a uniform swing, the poll showed the SNP would win 53 seats out of all 59 in Scotland, up from 6 in the 2010 general election, while Labour would win four Scottish seats, down from 41 in 2010, making it Labour's worst result in Scotland since 1918, YouGov said.
The Liberal Democrats would win one seat, down from 11 in 2010, while the Conservatives would hold its one seat.
Losing so many seats would scupper Miliband's chances of leading a majority government and potentially allow Prime Minister David Cameron's Conservatives to win a second term.
Sturgeon has given mixed signals on seeking a second independence referendum but has warned that a vote on Britain's membership of European Union, which Cameron has promised, could trigger another referendum.
"The referendum last year was the culmination of a long process of political disillusionment," said Professor Gregor Gall, editor of the Scottish Labour History Society. "The whirlwind from that is still being reaped for Labour."
CFTC recent data does not show big shifts in sentiment. In recent three weeks as open interest as speculative positions mostly stand flat. Shorts stand two times greater than longs, as longs were significantly contracted in March. So, CFTC data is not very useful right now since it is not clarified situation. Thus, we mostly will have to rely on technical tools on coming week.
Open interest:
 Shorts:
 Longs:

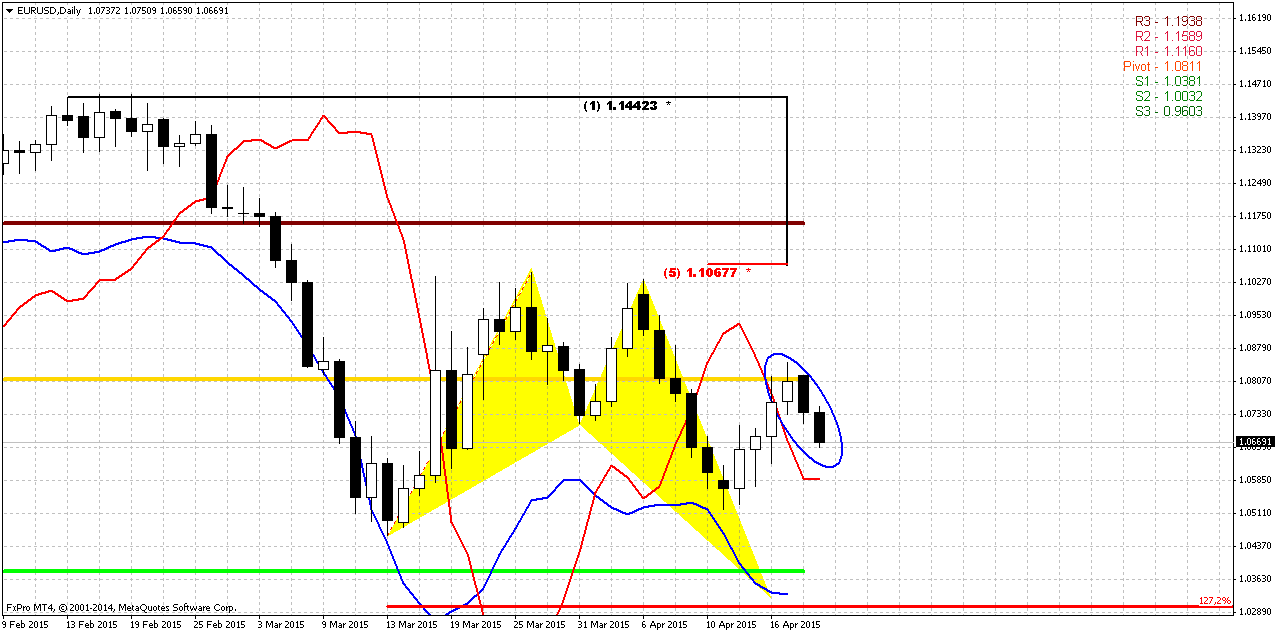
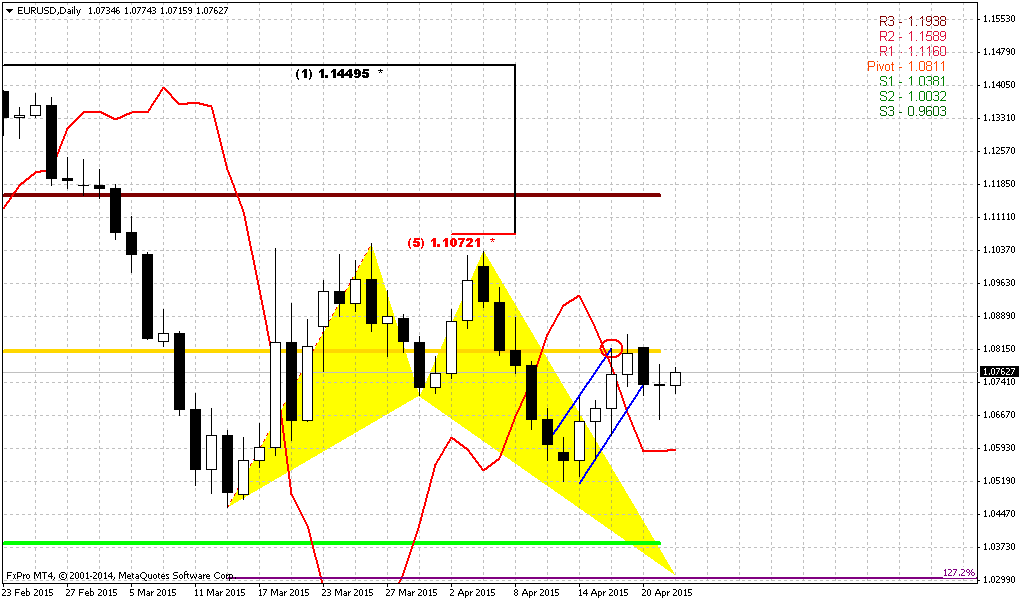
Technicals
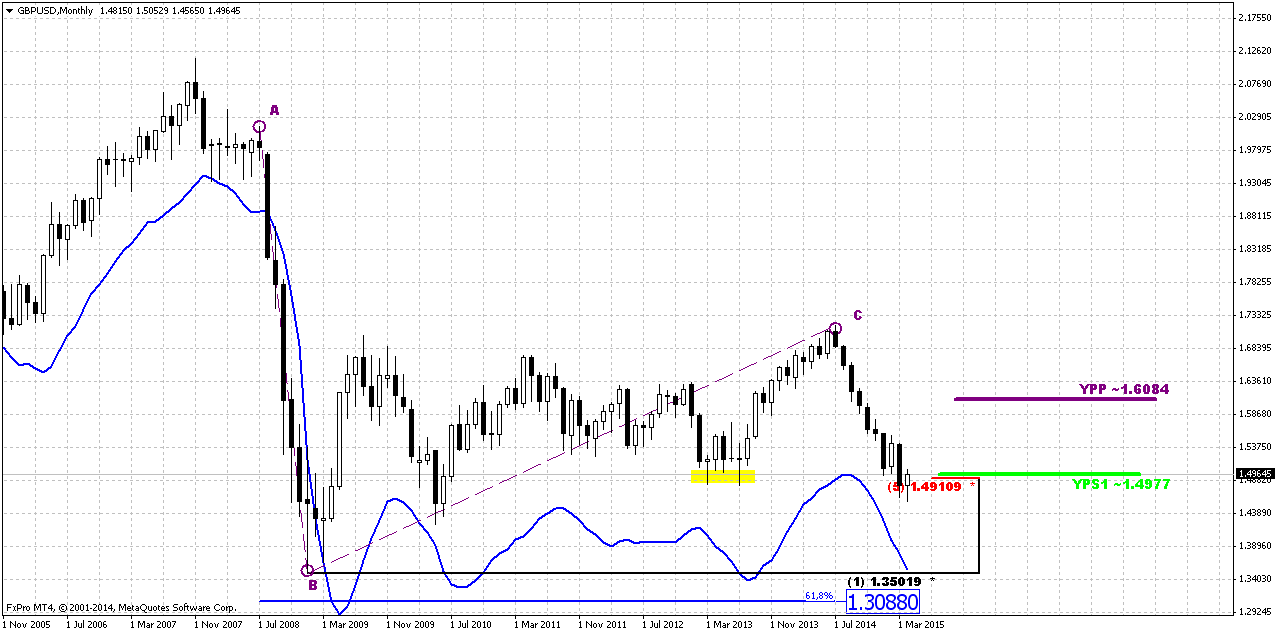
Monthly
Since it is still valid – I would like to keep showing you monthly chart and analysis that we’ve made in December 2013 in our Forex Military School Course, where we were learning Elliot Waves technique.
https://www.forexpeacearmy.com/fore...-16-part-v-trading-elliot-waves-page-7-a.html
Our long term analysis suggests first appearing of new high on 4th wave at ~1.76 level and then starting of last 5th wave down. First condition was accomplished and we’ve got new high, but it was a bit lower – not 1.76 but 1.72. This was and is all time support/resistance area. Now we stand in final part of our journey. According to our 2013 analysis market should reach lows at 1.35 area. Let’s see what additional information we have right now.
Trend is bearish here, but GBP is not at oversold. Approximately month ago market has reached strong support area – Yearly Pivot support 1 and 5/8 major monthly Fib level. As we’ve mentioned on our previous research – “although market right now stands ~200 pips below this level, it seems that it has not been broken totally yet” and now market confirms this thought. Market gradually struggling through YPS1 but it seems that first attempt to pass through it has failed. It means that we could meet meaningful pullback in nearest future. Although in long term it will not mean the capitulation of the bears. This will be probably just temporal pullback, respect of support and correction after unsuccessful attempt to pass through support right on first challenge.
In fact here we have just one major downward destination point. Monthly chart give us just single AB-CD pattern with nearest target at 0.618 extension – 1.3088. Still, here we have another one non-Fib orienteer – lower border of current consolidation. If we will treat it as sideways action then lower border will stand ~1.42-1.43 area. But first we need to get over current support level and see what market could give us here. Currently 1.30-1.31 area looks unbelievable, but if we would suggest parity on EUR/USD and starting rate hiking cycle in US – why not? Still, this is very long-term picture and right now we’re mostly interested in reaction of the market on current support level.
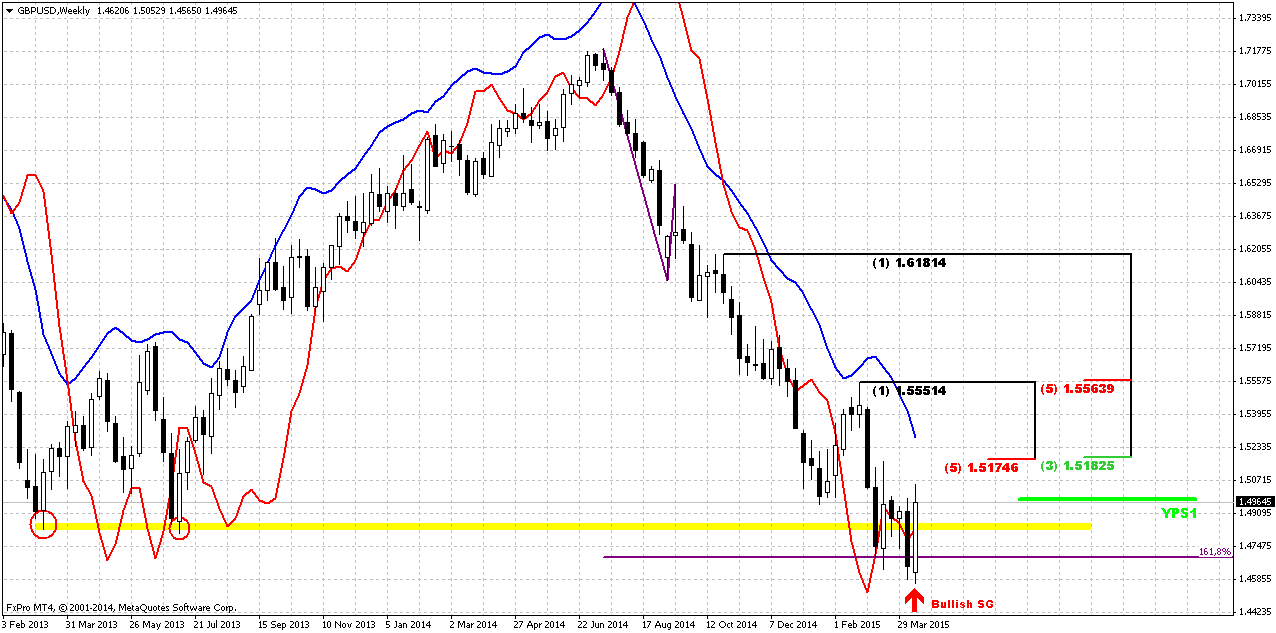
Weekly
Weekly chart is a centre of bullish sentiment. Here we see a lot of signs that point on possible upward pullback. Last month we mostly have discussed multiple bullish grabbers that were formed since GBP has tested YPS1 for the first time. And are waited when finally, GBP will start upward reaction on these grabbers.
Ones it has not happened and market has dropped further we’ve abandoned GBP for some time, but now situation has changed again and becomes worthy of our attention.
Thus, action in recent two weeks we could treat as 2-period bullish grabber. DiNapoli does not have this name in his arsenal, but may experience tells that when market shifts trend and on the next period restores it back – it works as simple grabber in most cases. It means that theoretically market could exceed 1.5550 top. We will keep in mind this level.
Meantime we will focus on closer targets. These 2-candles action also is pretty bullish engulfing pattern. But its nicety comes not just from engulfing feature but because this is also W&R of previous lows. This moment significantly increases bullishness of this pattern. Classical target of this pattern will stand probably somewhere above K-resistance and should be equal to the length of the bars. May be it even will stand close to the same 1.5550 top. Based on weekly analysis we mostly should think about taking long position.
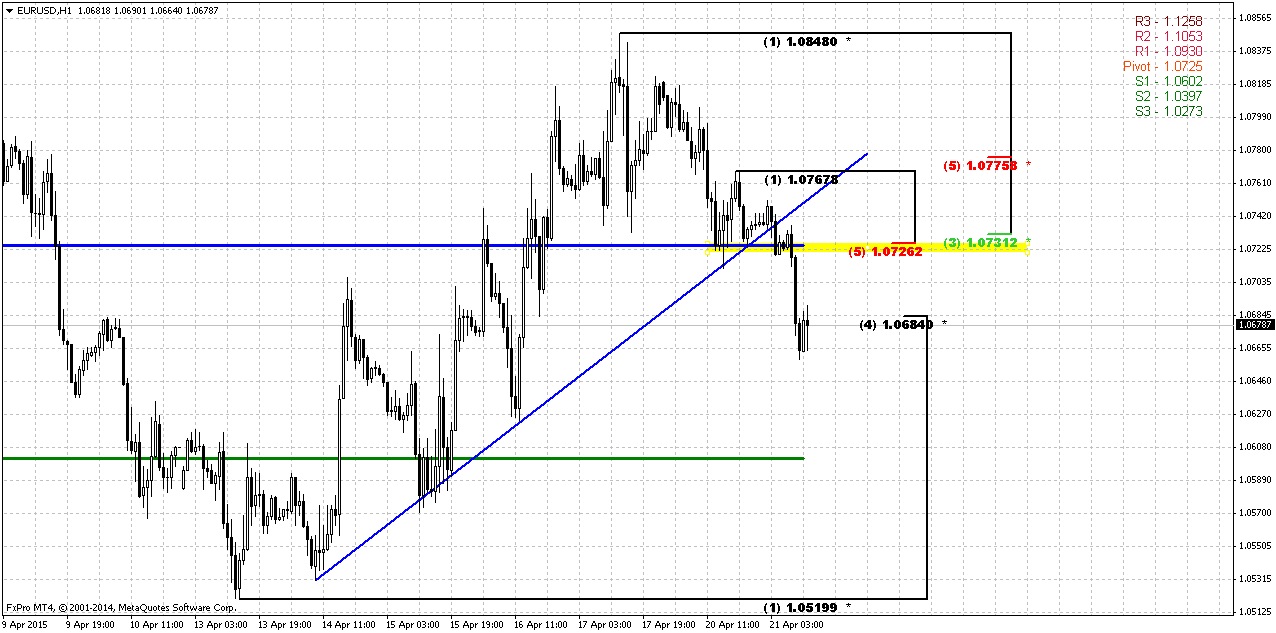
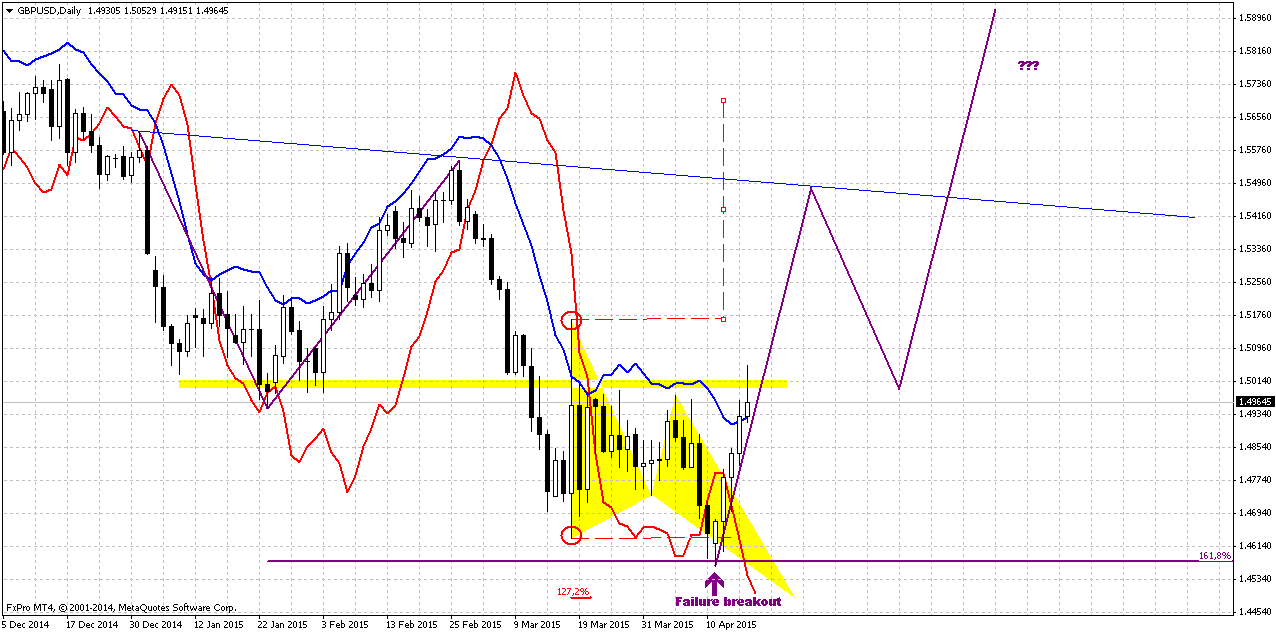
Daily
And here, guys, we’re coming to most important picture. Picture is also bullish here, including trend by MACD. Do you remember this long-ranged candle and what we’ve said about it? Just to remind you – such long candles usually holds price action for considerable period of time. In our case this is approximately 3 weeks. This time lets investors to make a decision on next direction. And market usually continues action in direction of breakout of this long candle. But here we have more sophisticated situation. You can see that breakout has failed. On this case we also have some experience rule – in the situation of failure breakout market theoretically (as it usually happens) should show opposite breakout and pass the distance equals to the length of long-ranged candle. I’ve drawn it by upside red line.
By taking more extended view, we could get reverse H&S pattern here, guys. In general, this corresponds with picture that we have on weekly chart. We’ll see…
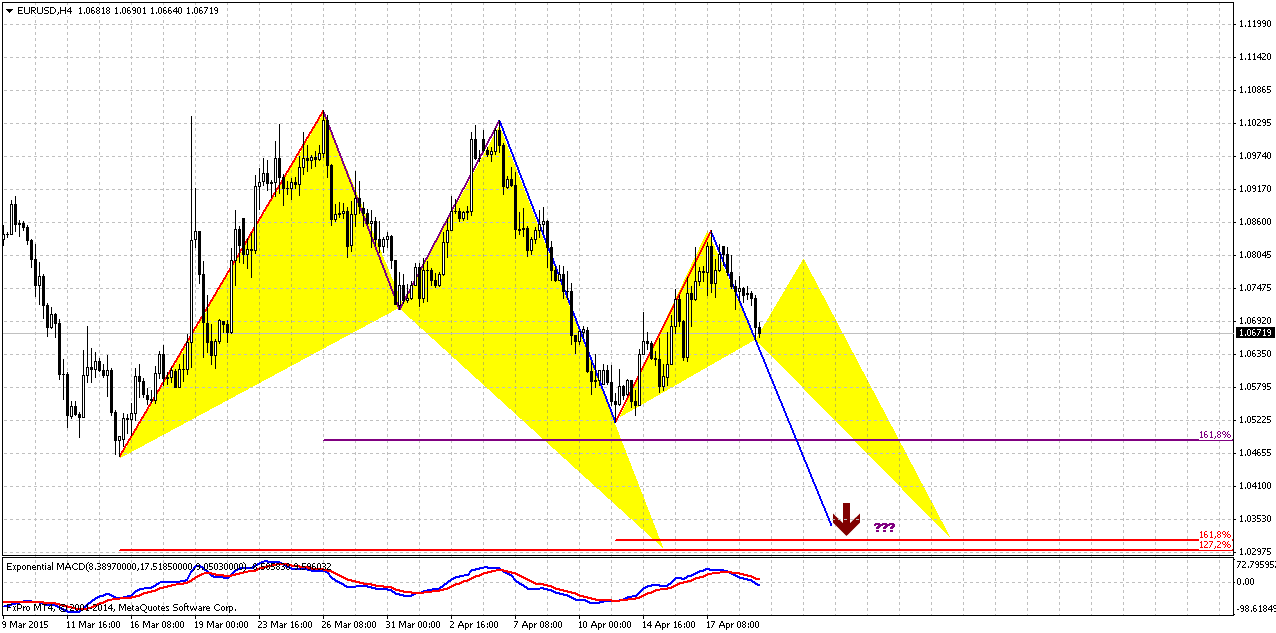
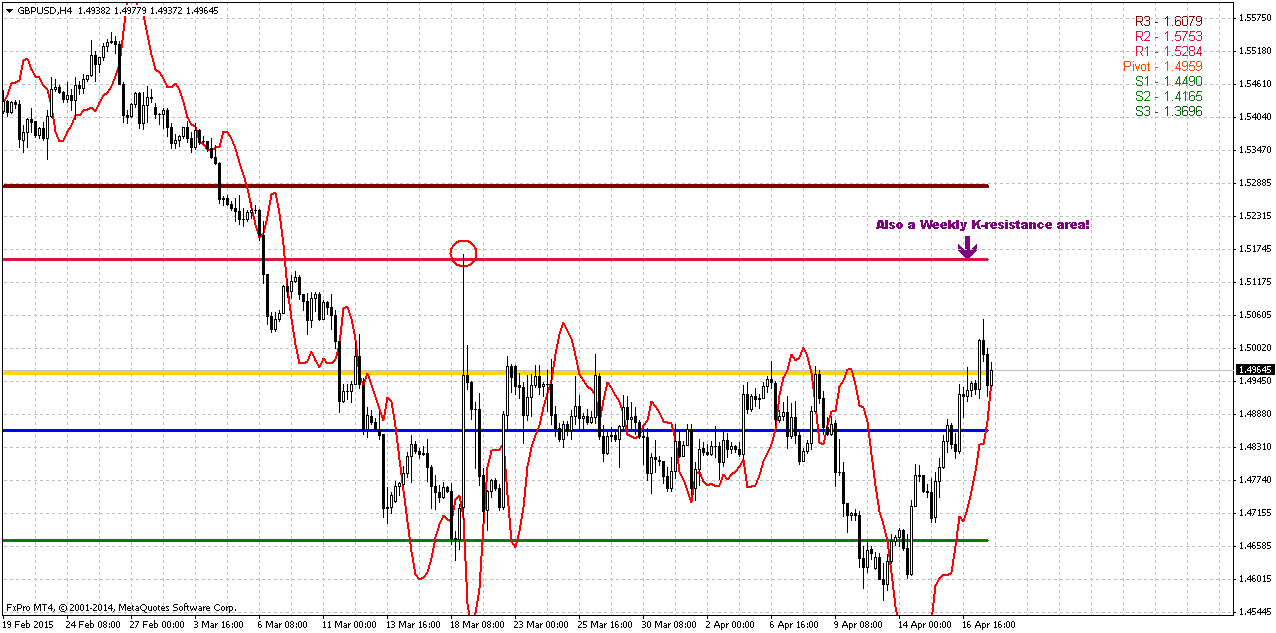
4-Hour
Here chart looks like double bottom pattern or something of that sort. Theoretically I would expect some retracement that could be used for taking long position somewhere from 1.5180 area – weekly K-resistance and WPR1. This is also the top of long-ranged candle. And bullish grabber that we have here points on possible upward continuation.
At the same time, market right now stands at daily overbought and GBP hardly will move higher immediately.
Conclusion:
Recently GBP has formed some patterns and price action that mostly hints on bullish action in short-term perspective.
The technical portion of Sive's analysis owes a great deal to Joe DiNapoli's methods, and uses a number of Joe's proprietary indicators. Please note that Sive's analysis is his own view of the market and is not endorsed by Joe DiNapoli or any related companies.
Reuters reports The U.S. dollar posted its worst week in four against a currency basket on Friday after data showing a rise in consumer prices failed to alleviate concerns that recent soft U.S. economic data could delay the Federal Reserve's first rate hike. The dollar rebounded against major currencies in morning trading after data showed U.S. consumer prices rose 0.2 percent in March, while closely watched core consumer prices rose 1.8 percent year-on-year, inching closer to the Fed's 2.0 percent target.
The move was short-lived, however, as traders reverted to selling the dollar on the view that the data was not strong enough to offset a batch of weaker-than-expected economic readings for the first quarter, ranging from retail sales to housing starts.
"The markets feel that the small price increase is not enough to force a June rate increase," said Chris Gaffney, president of EverBank World Markets in St. Louis. Analysts are still pricing in just one rate increase this year, sometime late in the fourth quarter.
The euro's gain steered the dollar to its biggest weekly drop in four against a basket of major currencies. Analysts said the dollar has become more vulnerable to pull-backs given outsized bullish bets on the currency. The greenback had rallied by as much as 30 percent since last May, hitting 12-year highs in March. "We're going to see significant downward pressure at some point on equities as well as on the dollar as people are forced to reduce their long dollar position," said Sebastien Galy, currency strategist at Societe Generale in New York.
It was a bit difficult choice – what currency to choose for today’s discussion. Mostly I was looking either at GBP or at NZD. Still I’ve chosen GBP since it cares a bit more hidden moments and nuances, while on NZD situation is clearer.
And currently, guys, it is impossible to ignore election topic in UK.
As “Alpha now” tells it its article, the UK election is around a month away and a key focus of the debate is how much money the government should spend. This week’s chart looks at the level of public expenditure under different governing parties.
In political terms the upcoming General Election on May 7th could be the least certain for generations. From the two-party politics of old there are now a range of possible outcomes which could include a range of different parties having some form of power.
While the political environment is uncertain, the economic backdrop is all-too clear. The artificial boost to the demand side of the UK economy has faded, and productivity continues to stagnate. Whatever the outcome of the election, the task of fixing the economy has barely begun. Dealing with the deficit may be a job half-done, but the task of fixing the supply-side of the UK economy has not even begun. That is a more important issue economically than the debate over the pace of deficit reduction.
Recent news on election battle comes from Scotland. In Scotland's biggest city, nationalists have triggered a once-in-a-century shift in political loyalties that could dash Labour leader Ed Miliband's dreams of winning the May 7 election and thrust secessionist 'kingmakers' to the heart of British power.
The shifting currents in Glasgow, the citadel of Scottish socialism for more than a century, show the seriousness of the nationalists' bid to end Labour's dominance of Scotland, a significant change in recent British political history.
The nationalist challenge could trigger events after the election that threaten the future of the United Kingdom and possibly its membership of the European Union.
Scots voted to preserve the United Kingdom in a Sept. 18 referendum but the once marginal Scottish National Party (SNP) has spent two decades persuading Scots that it is a worthy alternative to Labour, which many voters say has abandoned its Scottish heritage.
"We're recovering from a period where the Scottish Labour party wasn't strong enough, and it wasn't good enough. And that takes time," said Jim Murphy, leader of the Scottish Labour Party.
"We've got less than three weeks to turn it round but I'm confident that we can," said Murphy, a 47-year-old teetotal vegetarian who opinion polls show has so far failed to stem a flood of support from Labour to the SNP.
The destiny of Glasgow's once safe Labour seats will show whether Labour has lost Scotland, a defeat that would scupper Miliband's bid to win an overall majority in the 650-seat London parliament and potentially give the SNP a kingmaker position from which to bargain for more powers for Scotland.
The loss of Glasgow, a party stronghold for so many decades, would symbolise the extent of Labour's decline in Scotland and the emerging supremacy of the nationalists.
Labour won all seven of Glasgow's seats in the British parliament in the 2010 election with apparently unassailable majorities of up to 16,000 votes.
Now all but one are threatened by the SNP, according to John Curtice, professor of politics at the University of Strathclyde and Scotland's most respected opinion poll analyst.
"Glasgow North East is the safest Labour seat in the country and nobody has yet come up with an opinion poll that suggests it could be lost," he told Reuters. "But everything else in the city is absolutely up for grabs."
Labour became Scotland's biggest party in the British parliament in 1922 and the last time it lost Scotland in a national election was in 1955. By 2014, 45 percent of Scots would vote for independence.
In a small campaign office in a block of council flats, the SNP candidate for Glasgow Central, Alison Thewliss, is trying to sow the seeds of Labour's defeat.
Asked why so many Scots were turning away from Labour, she said: "They saw Labour joining up with the Tories during the referendum, and it's hurt people actually."
Labour's joint effort with the Conservative Party to urge Scots to reject independence alienated some voters, even those who support the 308-year-old union, she said.
'SENSE OF ENTITLEMENT'
Labour's potential loss of Scotland illustrates the divergence of England and Scotland and what many Scots see as an arrogant London political establishment that has failed to heed or address their needs.
While Conservative Prime Minister Margaret Thatcher moved England rightwards from 1979 to 1990, Scots stood opposed, especially to Thatcher's use of Scotland to test an unpopular poll tax.
Her successors, from John Major to Labour prime ministers Tony Blair and Gordon Brown, broadly accepted Thatcher's legacy while millions of Scots held to their socialist traditions.
Those traditions go back to the dawn of the British Labour movement when Keir Hardie, the Scottish trade unionist born in Glasgow in 1856, helped found the Labour Party.
As Blair moved Labour rightwards to win voters in England and established the Scottish parliament, the party assumed its Scottish flank would be secure.
That opened an opportunity for the SNP, which pitches itself as the social conscience of Scotland opposed to what leader Nicola Sturgeon calls the crumbling institutions of the London elite.
Just 12 years after the establishment of the Scottish Parliament, the SNP would topple Labour, winning a majority in the 2011 Scottish election.
"Labour has, from the 1970s, been regarded as the natural party of government in Scotland," said Stewart MacLennan, 64, a former Labour candidate who now backs the SNP.
But now Murphy is greeted on the campaign trail by SNP taunts that Labour, whose party colour is red, are the "Red Tories", in reference to the Conservatives' nickname.
'REAPING THE WHIRLWIND'
While the SNP has added members since the referendum, opinion polls show its share of the vote has risen just a few percentage points.
What has changed is that Scots now appear to have broken a tradition of voting SNP only in Scottish elections and have now also fixed their sights on the London parliament.
Such a change in voting habits could shake the foundations of Britain's political establishment.
A YouGov poll on April 8-9 found the SNP had 49 percent support in Scotland, with Labour on 25 percent. It was the biggest lead so far for the SNP and the lowest level for Labour since 2007 in a YouGov poll.
Under a uniform swing, the poll showed the SNP would win 53 seats out of all 59 in Scotland, up from 6 in the 2010 general election, while Labour would win four Scottish seats, down from 41 in 2010, making it Labour's worst result in Scotland since 1918, YouGov said.
The Liberal Democrats would win one seat, down from 11 in 2010, while the Conservatives would hold its one seat.
Losing so many seats would scupper Miliband's chances of leading a majority government and potentially allow Prime Minister David Cameron's Conservatives to win a second term.
Sturgeon has given mixed signals on seeking a second independence referendum but has warned that a vote on Britain's membership of European Union, which Cameron has promised, could trigger another referendum.
"The referendum last year was the culmination of a long process of political disillusionment," said Professor Gregor Gall, editor of the Scottish Labour History Society. "The whirlwind from that is still being reaped for Labour."
CFTC recent data does not show big shifts in sentiment. In recent three weeks as open interest as speculative positions mostly stand flat. Shorts stand two times greater than longs, as longs were significantly contracted in March. So, CFTC data is not very useful right now since it is not clarified situation. Thus, we mostly will have to rely on technical tools on coming week.
Open interest:
Technicals
Monthly
Since it is still valid – I would like to keep showing you monthly chart and analysis that we’ve made in December 2013 in our Forex Military School Course, where we were learning Elliot Waves technique.
https://www.forexpeacearmy.com/fore...-16-part-v-trading-elliot-waves-page-7-a.html
Our long term analysis suggests first appearing of new high on 4th wave at ~1.76 level and then starting of last 5th wave down. First condition was accomplished and we’ve got new high, but it was a bit lower – not 1.76 but 1.72. This was and is all time support/resistance area. Now we stand in final part of our journey. According to our 2013 analysis market should reach lows at 1.35 area. Let’s see what additional information we have right now.
Trend is bearish here, but GBP is not at oversold. Approximately month ago market has reached strong support area – Yearly Pivot support 1 and 5/8 major monthly Fib level. As we’ve mentioned on our previous research – “although market right now stands ~200 pips below this level, it seems that it has not been broken totally yet” and now market confirms this thought. Market gradually struggling through YPS1 but it seems that first attempt to pass through it has failed. It means that we could meet meaningful pullback in nearest future. Although in long term it will not mean the capitulation of the bears. This will be probably just temporal pullback, respect of support and correction after unsuccessful attempt to pass through support right on first challenge.
In fact here we have just one major downward destination point. Monthly chart give us just single AB-CD pattern with nearest target at 0.618 extension – 1.3088. Still, here we have another one non-Fib orienteer – lower border of current consolidation. If we will treat it as sideways action then lower border will stand ~1.42-1.43 area. But first we need to get over current support level and see what market could give us here. Currently 1.30-1.31 area looks unbelievable, but if we would suggest parity on EUR/USD and starting rate hiking cycle in US – why not? Still, this is very long-term picture and right now we’re mostly interested in reaction of the market on current support level.
Weekly
Weekly chart is a centre of bullish sentiment. Here we see a lot of signs that point on possible upward pullback. Last month we mostly have discussed multiple bullish grabbers that were formed since GBP has tested YPS1 for the first time. And are waited when finally, GBP will start upward reaction on these grabbers.
Ones it has not happened and market has dropped further we’ve abandoned GBP for some time, but now situation has changed again and becomes worthy of our attention.
Thus, action in recent two weeks we could treat as 2-period bullish grabber. DiNapoli does not have this name in his arsenal, but may experience tells that when market shifts trend and on the next period restores it back – it works as simple grabber in most cases. It means that theoretically market could exceed 1.5550 top. We will keep in mind this level.
Meantime we will focus on closer targets. These 2-candles action also is pretty bullish engulfing pattern. But its nicety comes not just from engulfing feature but because this is also W&R of previous lows. This moment significantly increases bullishness of this pattern. Classical target of this pattern will stand probably somewhere above K-resistance and should be equal to the length of the bars. May be it even will stand close to the same 1.5550 top. Based on weekly analysis we mostly should think about taking long position.
Daily
And here, guys, we’re coming to most important picture. Picture is also bullish here, including trend by MACD. Do you remember this long-ranged candle and what we’ve said about it? Just to remind you – such long candles usually holds price action for considerable period of time. In our case this is approximately 3 weeks. This time lets investors to make a decision on next direction. And market usually continues action in direction of breakout of this long candle. But here we have more sophisticated situation. You can see that breakout has failed. On this case we also have some experience rule – in the situation of failure breakout market theoretically (as it usually happens) should show opposite breakout and pass the distance equals to the length of long-ranged candle. I’ve drawn it by upside red line.
By taking more extended view, we could get reverse H&S pattern here, guys. In general, this corresponds with picture that we have on weekly chart. We’ll see…
4-Hour
Here chart looks like double bottom pattern or something of that sort. Theoretically I would expect some retracement that could be used for taking long position somewhere from 1.5180 area – weekly K-resistance and WPR1. This is also the top of long-ranged candle. And bullish grabber that we have here points on possible upward continuation.
At the same time, market right now stands at daily overbought and GBP hardly will move higher immediately.
Conclusion:
Recently GBP has formed some patterns and price action that mostly hints on bullish action in short-term perspective.
The technical portion of Sive's analysis owes a great deal to Joe DiNapoli's methods, and uses a number of Joe's proprietary indicators. Please note that Sive's analysis is his own view of the market and is not endorsed by Joe DiNapoli or any related companies.