Sive Morten
Special Consultant to the FPA
- Messages
- 18,705
Fundamentals
(Reuters) The U.S. dollar weakened on Friday after U.S. retail sales were unexpectedly flat in July, while producer prices also fell in the same month, contrary to expectations, raising concerns about the strength of third-quarter economic growth.
Economists had forecast overall retail sales to rise 0.4 percent. The drop in producer prices, meanwhile, was the first since March and the largest since September 2015.
“The U.S. retail sales data in particular is causing the dollar to weaken,” said Nick Bennenbroek, head of currency strategy at Wells Fargo Securities in New York, adding that "producer prices are also signaling limited inflation."
A third report on Friday showed consumer sentiment stable in early August, though households' views on income softened a bit. A fourth report showed businesses made significant progress in June in reducing an inventory overhang that has weighed on economic growth since the second quarter of 2015.
The dollar fell 0.15 percent against a basket of six major currencies to 95.725, after falling as low as 95.254, the lowest in a week. The greenback also tumbled 0.77 percent against the yen to 101.19 yen and 0.20 percent against the euro to $1.1159.
The dollar had rallied last Friday on data showing employers added more jobs than expected in July, raising expectations the Federal Reserve will raise U.S. interest rates this year.
It gave up those gains this week, however, as investors see a rate hike in September as a long shot and with the Fed’s December meeting still far away.
The Fed will release minutes from its July meeting next Wednesday, with the focus then likely to turn to Chair Janet Yellen’s speech at the Fed’s Jackson Hole symposium on Aug. 26.
Antipodean currencies ended lower after briefly turning positive on the U.S. data. They fell overnight after data showed China’s economic activity slowed in July, with investment growing at its slowest pace since the turn of the century.
The weaker-than-expected Chinese data covered investment, lending, retail spending and factory output.
The Australian dollar fell 0.65 percent against the greenback to $0.7645. The New Zealand dollar dropped 0.18 percent to $0.7189.
The kiwi and Australian dollar were buoyed earlier this week by investors reaching for yields as European and Japanese bond yields offer, in many cases, negative returns.
How Many Jobs Make a Good US Jobs Report?
by Fathom Consulting
We think that the slowdown in the average rate of monthly US jobs gains this year is a symptom of a tighter labor market and does not reflect a fragile economy. We also estimate that net payroll growth in excess of 60,000 per month is sufficient for the labor market to tighten. This is a lot lower than in the past, and probably a lot lower than investors realize. As such, we think that both US inflation and short-term interest rates are likely to rise faster than generally anticipated.

Although the average rate of net payroll growth has slowed from around 230,000 in 2016 to around 170,000 per month this year, we do not think that the US economy is in a fragile state. Instead we think that this is more likely to be a reflection of growing supply constraints as the US economy approaches full employment. After all, wages are rising, job openings are close to an all-time high, businesses are reporting labor shortages and consumer surveys are showing that Americans are feeling more optimistic about their job prospects. In short, we suspect that there is less slack left in the US labor market than is generally perceived.
We also suspect that this slack will be absorbed sooner than many anticipate, even if the rate of payroll growth slows further. We estimate that the so-called break-even rate of payroll growth is just 60,000 per month. In other words, we think that, on average, 60,000 net payrolls are needed each month to absorb growth in the labor force, without changing the unemployment rate. Job creation in excess of this will cause the labor market to tighten as illustrated in our chart.
This is a lot lower than it was in the past and probably lower than many investors realize. For example, we estimate that the break-even rate of payroll growth between 1980 and 2008 was close to 140,000. Looking ahead, it is highly likely that the break-even rate will remain a lot closer to 60,000 per month than 140,000, given prospects for population growth and the ongoing retirement of baby boomers.
The upshot is that even if the pace of jobs gains slows further, we think that wage pressures will build and the US Federal Reserve will raise interest rates faster than investors anticipate, provided that more than 60,000 net payrolls are added every month. Current market pricing implies just about one 25 basis point increase in the fed funds rate between now and the end of next year. In contrast, we forecast one 25 basis point rise this year, with at least two more to come in 2017.
COT Report
So, I"m intentionally put here contracted chart, just to show that speculative short position stands at extreme levels. Since beginning of 2016 short position has started to increase, but open interest was dropping. This tells about closing of long-term long postions on GBP that has let net short position to increase. But now, in recent 1-2 month open interest has turned to growth and this suggests new short positions on GBP. THe problem though that as greater net short position and open interest as greater chance to upside reversal either short-term or long term. Last time we also have talked about it. Before GBP will turn to next long-term bearish extension, it should show solid upside retracement. Now it becomes more probable week by week.

Technicals
Last week we haven't got any clarity on our major currencies. NZD has completed our short-term target and monthly pattern, but others mostly have spent time in consolidation and our long-term view on EUR and other currencies stands the same.
That's why today we again will take a look at GBP. Very long-term picture has not changed significantly, while on lower time frames GBP has confirmed our expectation and moved lower.
Right now monthly trend is bearish, but market is not at oversold on monthly chart. We've said that lows will not survive because market has all-time 0.618 AB=CD target below them, so that has happened. Market has dropped and right now stands there, no W&R.
Overall picture looks bearish by some signs. First is - acceleration down to AB-CD target. Usually fast drop on this point tells that market has chances to continue to AB=CD target, which stands at 1.06 area, and we think that it will be reached within some years. The point is if you will take a look at all-time GBP chart, you'll see that market already has broken major 5/8 Fib support and on a way down, drop is really fast since first leg was on 2008 crisis. Overall fundamental situation is mostly supportive to this scenario, besides, 20 points is not really big distance to GBP that is more volatile than many other major currencies:
That's why technically there is nothing impossible with 1.06 area. - that will be AB=CD on a way down.
Second stands for shorter-term perspective. GBP has dropped below YPS1 and this indicates starting of new bearish trend, not just a retracement down, but trend.
Swings right now are so large, that monthly chart let's us talk on very long-term perspective and does not bring any clarity on shorter-term perspective.
As it is suggested by COT, we still should be ready for upside bounce. In general, we have being waiting for it quite some time already, because this upside bounce should become final step in our daily trading plan.
So, as no bounce has happened yet, in short-term perspective market could try to reach another AB-CD 0.618 traget. Initially we were focused on AB-CD pattern with 1.3080 target since it was more probable. As GBP has hit it already but shows no reaction, it could mean that A'B-CD target around 1.2450 area also could be hit, if we adjust our initial "A" point and shift it to "A' " as it is shown on the chart. Last week GBP has moved closer to it. But stil, August month is inside one for July, so mostly it doesn't bring yet something new in analysis:

Weekly
Weekly chart shows very interesting information, and explains why our monthly AB-CD works. Actually guys, here we have rare pattern that calls Volatility Breakout (VOB). Those of you who follows our gold analysis knows that we've traded VOB on gold within 2 years and it has reached it's target around 1000$. Now GBP stands near its target as well:

Weekly chart was strongly oversold and major question is - do we have another VOB on Brexit? Usually VOB is absolute breakout as it was in 2008. Current breakout is smaller. But I think that we could treat it as VOB because more than 250 bars (weeks) has passed since first breakout. Although current VOB could be a bit weaker, but still it could have a downward continuation. It means that market could drop even lower than our monthly 1.3080 target, that is in general agrees with fundamental trend in UK economy. To understand how much lower - we need to get upside retracement first after VOB, to get AB-CD and calculate 0.618 extension target. In fact, upside action from 2008 till 2016 precisely was this "retracement" after VOB... As soon as we've got it - we've estimated 1.3080 target that currently is completed... Overall bearish Brexit impulse is also strong and sooner or later but it will get continuation, supported by BoE and MPC fiscal policy. Thus, technical VOB pattern is not isolated but supported by fundamental issues as well. Target of new VOB pattern could coincide, say, with monthly AB=CD around 1.06 area, we can't exclude this possibility.
As market has not turned up after our first AB-CD montlhy target has been completed on 1.30 area - next chance will be around 1.25. Here I've drawn really extended butterfly "Buy" pattern with first destination point around 1.25 area. Thus, let's take a look what will happen there.
Daily
On daily picture we have some interesting moments, that we could treat as confirmation of bearish sentiment. As BoE cut the rates, GBP has dropped. Recent action mostly reminds bearish dynamic pressure, because after Brexit collapse trend has turned bullish but price action mostly stands flat.
Last week market has dropped below MPP. It seems that market should create some reversal pattern before upside retracement will happen. It is high probability that it could be butterfly "Buy" pattern. 161.8% target coincides with huge AB-CD destination on monthly chart. May be appearing of butterfly will lead to H&S pattern.
Besides, daily butterfly target coincides with 1.27 monthly/weekly extended butterfly around 1.24-1.25. Next week GBP should reach lows around 1.28 area and MPS1. If it will be broken down - chances on further drop will increase significantly, because breakout will confirm that this is not a retracement any more. Also this action probably will trigger stops below the bottom and complete our bearish dynamic pressure pattern:

4-hour
Last week we've talked on unnatural shape of H&S pattern and made a suggestion that probably it should fail and market should drop below the head. Now, as you can see GBP has passed the half way in this direction. It is really interesting that GBP has not shown any reaction on "poor" USD data. This tells about real weakness. Slowly but stubbornly GBP drifts lower. Acceleration really could happen after drop below 1.28

Here, guys, at the end of weekly research I would like to make a comment on UK Foreign policy. Probably you know about Prime minister Ms. Theresa May meeting with Putin. This meeting could get fargoing consequences and really help UK to run through Brexit crisis. As UK is not a member of EU any more - they could not follow Brussel sanction policy against Russia and take huge advantage of new profitable mutual projects while Brussel will stay under bureaucrats burden and will loss all favorite positions. Russia now is driving huge amount of projects as force balance on Middle East is changing. This is South stream (Gas), Turkish Stream, North Stream-2, Transition projects with India, Iran and China, Syria repairing from ash of war. This is huge amount of contracts for private companies. Brexit releases hands to UK in communication with Russia. Who comes first will get more advantage, and UK now makes first steps while EU is still living in the shadow of US interests and external governing.
Conclusion:
That's being said, we confirm our bearish view on GBP that even has become worse as procedure of EU leaving has started. Based on patterns that we have right now we could make a conclusion that this is really possible that cable will reach 1-1.05 area within 3-5 years. Our first 1.3080 target that we've estimated in 2011 has been completed.
In short-term perspective, as market has failed to form immediate upside retracement, GBP could try to touch another 0.618 monthly AB-CD target around 1.2450 and then turn to upside retracement. At least some patterns have started to form that point on this scenario. Currently we think that it will be better to avoid long positions on cable, at least until these pattern will be completed. May be this will happen even on next week.
The technical portion of Sive's analysis owes a great deal to Joe DiNapoli's methods, and uses a number of Joe's proprietary indicators. Please note that Sive's analysis is his own view of the market and is not endorsed by Joe DiNapoli or any related companies.
(Reuters) The U.S. dollar weakened on Friday after U.S. retail sales were unexpectedly flat in July, while producer prices also fell in the same month, contrary to expectations, raising concerns about the strength of third-quarter economic growth.
Economists had forecast overall retail sales to rise 0.4 percent. The drop in producer prices, meanwhile, was the first since March and the largest since September 2015.
“The U.S. retail sales data in particular is causing the dollar to weaken,” said Nick Bennenbroek, head of currency strategy at Wells Fargo Securities in New York, adding that "producer prices are also signaling limited inflation."
A third report on Friday showed consumer sentiment stable in early August, though households' views on income softened a bit. A fourth report showed businesses made significant progress in June in reducing an inventory overhang that has weighed on economic growth since the second quarter of 2015.
The dollar fell 0.15 percent against a basket of six major currencies to 95.725, after falling as low as 95.254, the lowest in a week. The greenback also tumbled 0.77 percent against the yen to 101.19 yen and 0.20 percent against the euro to $1.1159.
The dollar had rallied last Friday on data showing employers added more jobs than expected in July, raising expectations the Federal Reserve will raise U.S. interest rates this year.
It gave up those gains this week, however, as investors see a rate hike in September as a long shot and with the Fed’s December meeting still far away.
The Fed will release minutes from its July meeting next Wednesday, with the focus then likely to turn to Chair Janet Yellen’s speech at the Fed’s Jackson Hole symposium on Aug. 26.
Antipodean currencies ended lower after briefly turning positive on the U.S. data. They fell overnight after data showed China’s economic activity slowed in July, with investment growing at its slowest pace since the turn of the century.
The weaker-than-expected Chinese data covered investment, lending, retail spending and factory output.
The Australian dollar fell 0.65 percent against the greenback to $0.7645. The New Zealand dollar dropped 0.18 percent to $0.7189.
The kiwi and Australian dollar were buoyed earlier this week by investors reaching for yields as European and Japanese bond yields offer, in many cases, negative returns.
How Many Jobs Make a Good US Jobs Report?
by Fathom Consulting
We think that the slowdown in the average rate of monthly US jobs gains this year is a symptom of a tighter labor market and does not reflect a fragile economy. We also estimate that net payroll growth in excess of 60,000 per month is sufficient for the labor market to tighten. This is a lot lower than in the past, and probably a lot lower than investors realize. As such, we think that both US inflation and short-term interest rates are likely to rise faster than generally anticipated.
Although the average rate of net payroll growth has slowed from around 230,000 in 2016 to around 170,000 per month this year, we do not think that the US economy is in a fragile state. Instead we think that this is more likely to be a reflection of growing supply constraints as the US economy approaches full employment. After all, wages are rising, job openings are close to an all-time high, businesses are reporting labor shortages and consumer surveys are showing that Americans are feeling more optimistic about their job prospects. In short, we suspect that there is less slack left in the US labor market than is generally perceived.
We also suspect that this slack will be absorbed sooner than many anticipate, even if the rate of payroll growth slows further. We estimate that the so-called break-even rate of payroll growth is just 60,000 per month. In other words, we think that, on average, 60,000 net payrolls are needed each month to absorb growth in the labor force, without changing the unemployment rate. Job creation in excess of this will cause the labor market to tighten as illustrated in our chart.
This is a lot lower than it was in the past and probably lower than many investors realize. For example, we estimate that the break-even rate of payroll growth between 1980 and 2008 was close to 140,000. Looking ahead, it is highly likely that the break-even rate will remain a lot closer to 60,000 per month than 140,000, given prospects for population growth and the ongoing retirement of baby boomers.
The upshot is that even if the pace of jobs gains slows further, we think that wage pressures will build and the US Federal Reserve will raise interest rates faster than investors anticipate, provided that more than 60,000 net payrolls are added every month. Current market pricing implies just about one 25 basis point increase in the fed funds rate between now and the end of next year. In contrast, we forecast one 25 basis point rise this year, with at least two more to come in 2017.
COT Report
So, I"m intentionally put here contracted chart, just to show that speculative short position stands at extreme levels. Since beginning of 2016 short position has started to increase, but open interest was dropping. This tells about closing of long-term long postions on GBP that has let net short position to increase. But now, in recent 1-2 month open interest has turned to growth and this suggests new short positions on GBP. THe problem though that as greater net short position and open interest as greater chance to upside reversal either short-term or long term. Last time we also have talked about it. Before GBP will turn to next long-term bearish extension, it should show solid upside retracement. Now it becomes more probable week by week.
Technicals
Last week we haven't got any clarity on our major currencies. NZD has completed our short-term target and monthly pattern, but others mostly have spent time in consolidation and our long-term view on EUR and other currencies stands the same.
That's why today we again will take a look at GBP. Very long-term picture has not changed significantly, while on lower time frames GBP has confirmed our expectation and moved lower.
Right now monthly trend is bearish, but market is not at oversold on monthly chart. We've said that lows will not survive because market has all-time 0.618 AB=CD target below them, so that has happened. Market has dropped and right now stands there, no W&R.
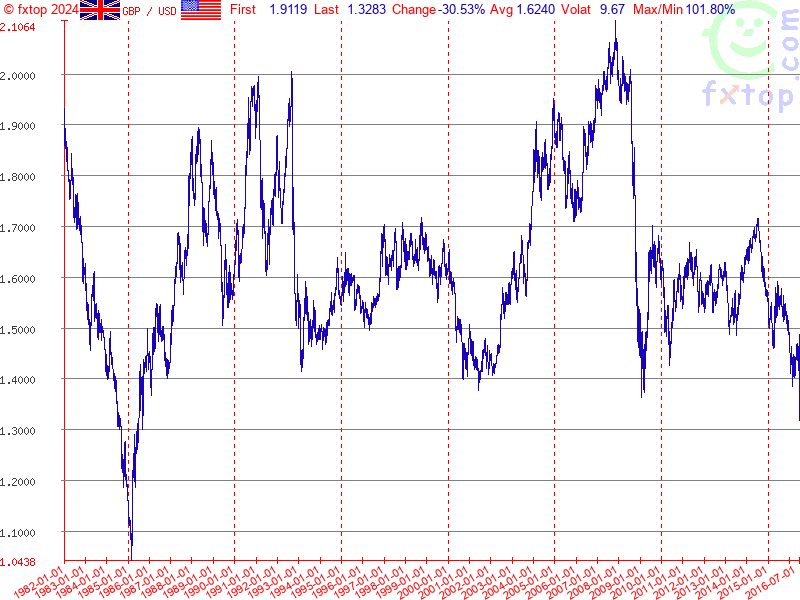
Overall picture looks bearish by some signs. First is - acceleration down to AB-CD target. Usually fast drop on this point tells that market has chances to continue to AB=CD target, which stands at 1.06 area, and we think that it will be reached within some years. The point is if you will take a look at all-time GBP chart, you'll see that market already has broken major 5/8 Fib support and on a way down, drop is really fast since first leg was on 2008 crisis. Overall fundamental situation is mostly supportive to this scenario, besides, 20 points is not really big distance to GBP that is more volatile than many other major currencies:
That's why technically there is nothing impossible with 1.06 area. - that will be AB=CD on a way down.
Second stands for shorter-term perspective. GBP has dropped below YPS1 and this indicates starting of new bearish trend, not just a retracement down, but trend.
Swings right now are so large, that monthly chart let's us talk on very long-term perspective and does not bring any clarity on shorter-term perspective.
As it is suggested by COT, we still should be ready for upside bounce. In general, we have being waiting for it quite some time already, because this upside bounce should become final step in our daily trading plan.
So, as no bounce has happened yet, in short-term perspective market could try to reach another AB-CD 0.618 traget. Initially we were focused on AB-CD pattern with 1.3080 target since it was more probable. As GBP has hit it already but shows no reaction, it could mean that A'B-CD target around 1.2450 area also could be hit, if we adjust our initial "A" point and shift it to "A' " as it is shown on the chart. Last week GBP has moved closer to it. But stil, August month is inside one for July, so mostly it doesn't bring yet something new in analysis:
Weekly
Weekly chart shows very interesting information, and explains why our monthly AB-CD works. Actually guys, here we have rare pattern that calls Volatility Breakout (VOB). Those of you who follows our gold analysis knows that we've traded VOB on gold within 2 years and it has reached it's target around 1000$. Now GBP stands near its target as well:
Weekly chart was strongly oversold and major question is - do we have another VOB on Brexit? Usually VOB is absolute breakout as it was in 2008. Current breakout is smaller. But I think that we could treat it as VOB because more than 250 bars (weeks) has passed since first breakout. Although current VOB could be a bit weaker, but still it could have a downward continuation. It means that market could drop even lower than our monthly 1.3080 target, that is in general agrees with fundamental trend in UK economy. To understand how much lower - we need to get upside retracement first after VOB, to get AB-CD and calculate 0.618 extension target. In fact, upside action from 2008 till 2016 precisely was this "retracement" after VOB... As soon as we've got it - we've estimated 1.3080 target that currently is completed... Overall bearish Brexit impulse is also strong and sooner or later but it will get continuation, supported by BoE and MPC fiscal policy. Thus, technical VOB pattern is not isolated but supported by fundamental issues as well. Target of new VOB pattern could coincide, say, with monthly AB=CD around 1.06 area, we can't exclude this possibility.
As market has not turned up after our first AB-CD montlhy target has been completed on 1.30 area - next chance will be around 1.25. Here I've drawn really extended butterfly "Buy" pattern with first destination point around 1.25 area. Thus, let's take a look what will happen there.
Daily
On daily picture we have some interesting moments, that we could treat as confirmation of bearish sentiment. As BoE cut the rates, GBP has dropped. Recent action mostly reminds bearish dynamic pressure, because after Brexit collapse trend has turned bullish but price action mostly stands flat.
Last week market has dropped below MPP. It seems that market should create some reversal pattern before upside retracement will happen. It is high probability that it could be butterfly "Buy" pattern. 161.8% target coincides with huge AB-CD destination on monthly chart. May be appearing of butterfly will lead to H&S pattern.
Besides, daily butterfly target coincides with 1.27 monthly/weekly extended butterfly around 1.24-1.25. Next week GBP should reach lows around 1.28 area and MPS1. If it will be broken down - chances on further drop will increase significantly, because breakout will confirm that this is not a retracement any more. Also this action probably will trigger stops below the bottom and complete our bearish dynamic pressure pattern:
4-hour
Last week we've talked on unnatural shape of H&S pattern and made a suggestion that probably it should fail and market should drop below the head. Now, as you can see GBP has passed the half way in this direction. It is really interesting that GBP has not shown any reaction on "poor" USD data. This tells about real weakness. Slowly but stubbornly GBP drifts lower. Acceleration really could happen after drop below 1.28
Here, guys, at the end of weekly research I would like to make a comment on UK Foreign policy. Probably you know about Prime minister Ms. Theresa May meeting with Putin. This meeting could get fargoing consequences and really help UK to run through Brexit crisis. As UK is not a member of EU any more - they could not follow Brussel sanction policy against Russia and take huge advantage of new profitable mutual projects while Brussel will stay under bureaucrats burden and will loss all favorite positions. Russia now is driving huge amount of projects as force balance on Middle East is changing. This is South stream (Gas), Turkish Stream, North Stream-2, Transition projects with India, Iran and China, Syria repairing from ash of war. This is huge amount of contracts for private companies. Brexit releases hands to UK in communication with Russia. Who comes first will get more advantage, and UK now makes first steps while EU is still living in the shadow of US interests and external governing.
Conclusion:
That's being said, we confirm our bearish view on GBP that even has become worse as procedure of EU leaving has started. Based on patterns that we have right now we could make a conclusion that this is really possible that cable will reach 1-1.05 area within 3-5 years. Our first 1.3080 target that we've estimated in 2011 has been completed.
In short-term perspective, as market has failed to form immediate upside retracement, GBP could try to touch another 0.618 monthly AB-CD target around 1.2450 and then turn to upside retracement. At least some patterns have started to form that point on this scenario. Currently we think that it will be better to avoid long positions on cable, at least until these pattern will be completed. May be this will happen even on next week.
The technical portion of Sive's analysis owes a great deal to Joe DiNapoli's methods, and uses a number of Joe's proprietary indicators. Please note that Sive's analysis is his own view of the market and is not endorsed by Joe DiNapoli or any related companies.