Sive Morten
Special Consultant to the FPA
- Messages
- 18,690
EUR/USD Daily Update, Fri 10, December 2010
Hello everybody,
Currently is one of these days, when market shows nothing really interesting -no thrusts, impulse moves, no particular patterns to trade.
But I would like to discuss with you couple of moments still.
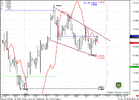
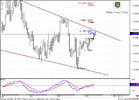
First, the fact that market has not be able to show continuation of up move, after it thouched Agreement at 1.3180-1.3200 area makes me think that currently downmove is more probable. Besides - look at recent sell-offs. Retracement up was sloppy, and sell-off was straight. It worries me in term of talking about bull trend.
Now market is forming falling wedge pattern, also you can see a bullish divergence. But, I'm not very impressed with these, well-known bullish signs.
I will be flat today, but you you still would like to trade - watch for wedge breakout - if it will be to the downside - next target is 1.3085 area of support
If it will be to the upside - be aware of 1.33 area because this is 100% expansion target. Market can just accomplish it and returns back in the wedge. So, for talking about real breakout to the upside - market should move above 1.33
Hello everybody,
Currently is one of these days, when market shows nothing really interesting -no thrusts, impulse moves, no particular patterns to trade.
But I would like to discuss with you couple of moments still.
First, the fact that market has not be able to show continuation of up move, after it thouched Agreement at 1.3180-1.3200 area makes me think that currently downmove is more probable. Besides - look at recent sell-offs. Retracement up was sloppy, and sell-off was straight. It worries me in term of talking about bull trend.
Now market is forming falling wedge pattern, also you can see a bullish divergence. But, I'm not very impressed with these, well-known bullish signs.
I will be flat today, but you you still would like to trade - watch for wedge breakout - if it will be to the downside - next target is 1.3085 area of support
If it will be to the upside - be aware of 1.33 area because this is 100% expansion target. Market can just accomplish it and returns back in the wedge. So, for talking about real breakout to the upside - market should move above 1.33
") hello girl!
hello girl!