Sive Morten
Special Consultant to the FPA
- Messages
- 18,690
Fundamentals
On Friday the major event was around GDP data in Europe and Michigan sentiment index in US. While sentiment has reduced – other currencies have got some support from temporal dollar weakness.
As our analysis on EUR still holds and next couple of weeks should clarify a lot of different moments, especially concerns around Greece and Ukraine. That’s why today we will prepare update on GBP. Pound has got some support on BoE comments on inflation level. Sterling looks stronger among other European currencies. As EU has fallen in turmoil as internal as external problems and nobody even speaks about rate hiking, franc although looks strong but recent scandals in Swiss banking sphere and pressure from US on providing personal data on clients and accounts couldn’t be treated as positive sign. Besides, Switzerland economy stands in stagnation; it has negative interest rates and deflation. Still, it is difficult to say by far –either recent Sterling growth is result of pure internal process, or partially external. If we would suggest negative scenario in EU – it is obviously that the European power center will shift to UK and Sterling will get solid support.
CFTC data shows that open interest that has dropped significantly on Scotland voting – now was restored at almost previous levels. Open interest mostly has grown on short positions. Picture of speculative positions looks obvious – solid increasing of shorts while longs stand anemic. At the same time, if you will take a look at commercial positions (hedgers) you will see interesting detail. While there is no surprise in solid part on commercial longs – they just a mirror of speculative shorts, even by chart shape, we see increasing of commercial shorts, but non-commercial longs (speculative bulls) stand flat or even decrease. It could be a sign that bearish sentiment becomes softer. May be it will not lead to reversal, but retracement is possible. It seems that market is tired a bit from endless drop.
Speculative Longs:
 Hedgers Shorts:

Technicals
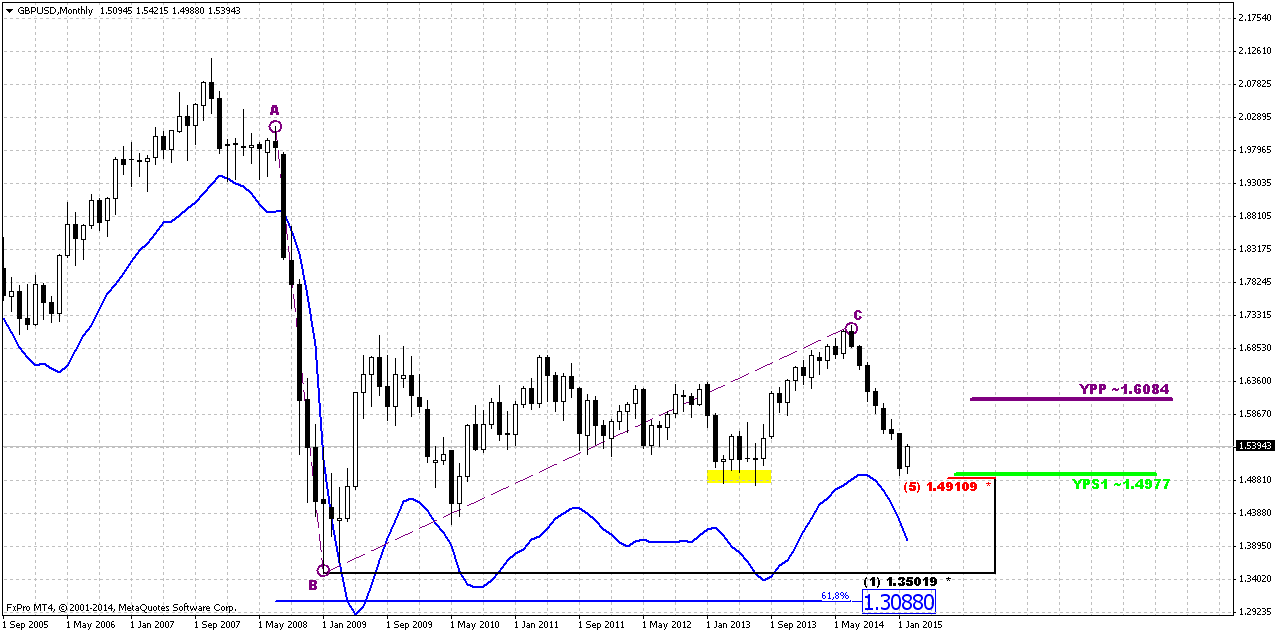
Monthly
Since it is still valid – I would like to keep showing you monthly chart and analysis that we’ve made in December 2013 in our Forex Military School Course, where we were learning Elliot Waves technique.
https://www.forexpeacearmy.com/forex-forum/forex-military-school-complete-forex-education-pro-banker/30110-chapter-16-part-v-trading-elliot-waves-page-7-a.html
Our long term analysis suggests first appearing of new high on 4th wave at ~1.76 level and then starting of last 5th wave down. First condition was accomplished and we’ve got new high, but it was a bit lower – not 1.76 but 1.72. This was and is all time support-resistance area. Now we stand in final part of our journey. According to our 2013 analysis market should reach lows at 1.35 area. Let’s see what additional information we have right now.
Trend is bearish here, but GBP is not at oversold. Right now market has reached strong support area – Yearly Pivot support 1 and 5/8 major monthly Fib level. This is an area where market has stopped last time. Monthly chart give us just single AB-CD pattern with nearest target at 0.618 extension – 1.3088. Still, here we have another one non-Fib orienteer – lower border of current consolidation. If we will treat it as sideways action then lower border will stand ~1.42-1.43 area. But first we need to get over current support level and see what market could give us here. Currently 1.30-1.31 area looks unbelievable, but if we would suggest parity on EUR/USD and starting rate hiking cycle in US – why not? Still, this is very long-term picture and right now we’re mostly interested in reaction of the market on current support level. Our suggestions that we’ve made two weeks ago have been confirmed – and GBP shows upside action in February. Let’s see how long this journey will last…
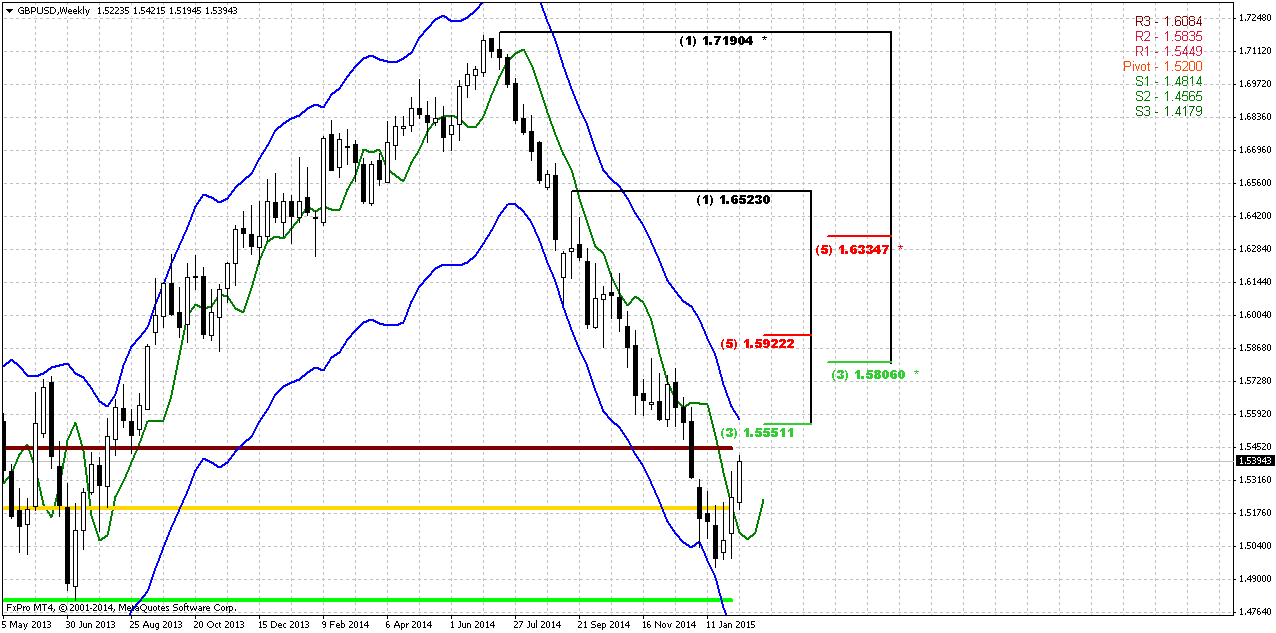
Weekly
On previous research we had on weekly chart two questions – tactical and strategical. Tactically we’ve talked on bullish “Stretch” pattern and its target around 1.5350 area. Thus 250 pips rally was our short-term target. Now we see that GBP has completed this. Tactically we’ve thought about patterns of greater scale and could recent rally become part of such pattern. Particularly speaking we’ve talked about either B&B “Sell” or DRPO “Buy” here. And this is most important question here. Personally guys, I would better make a stake on DRPO by some reasons. First is – we have strong monthly support and CFTC data that increases chances on deeper upward action. But it couldn’t be achieved by B&B. Second is, if you will take a look at technical picture you’ll see that Sterling will not reach 1.58 Fib level within 3 closes above 3x3 DMA just because 1.58 stands too far in overbought area. The only way how we could get B&B “Sell” here is to look not at whole thrust, but at its part from 1.6523 top. In this case B&B is possible, if market will reach 1.5550 resistance on next week. This B&B probably will have nice chances on success, since this is also MPR1 and weekly overbought. So, it seems that this will become our primary pattern on coming week.
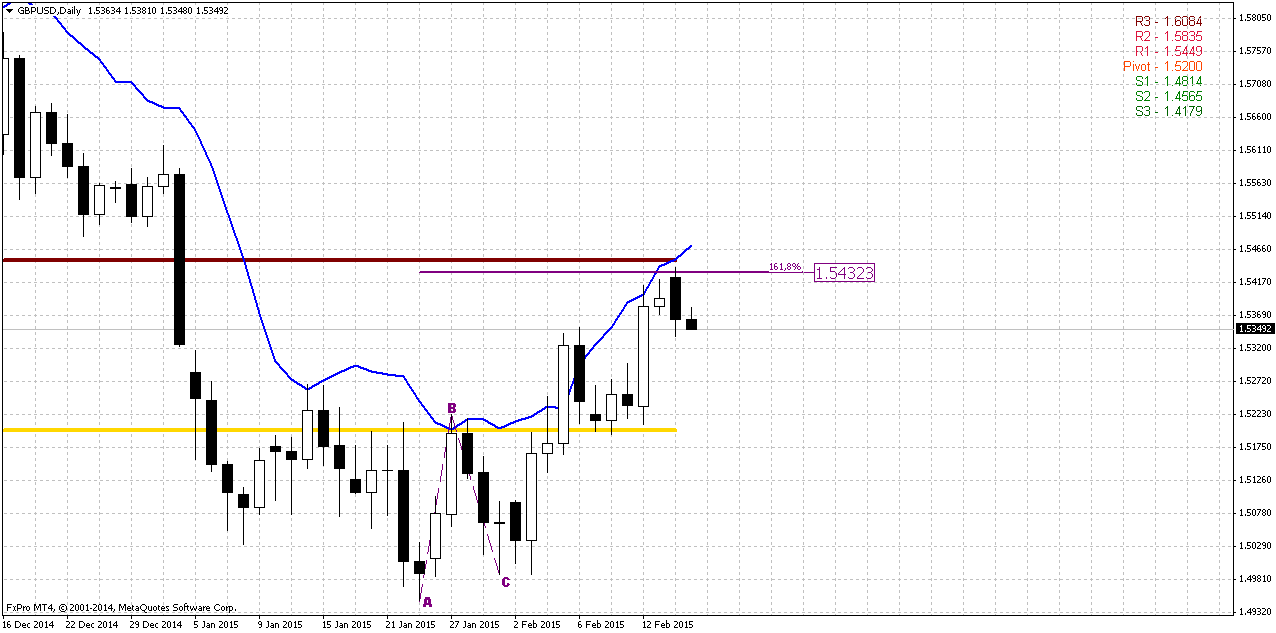
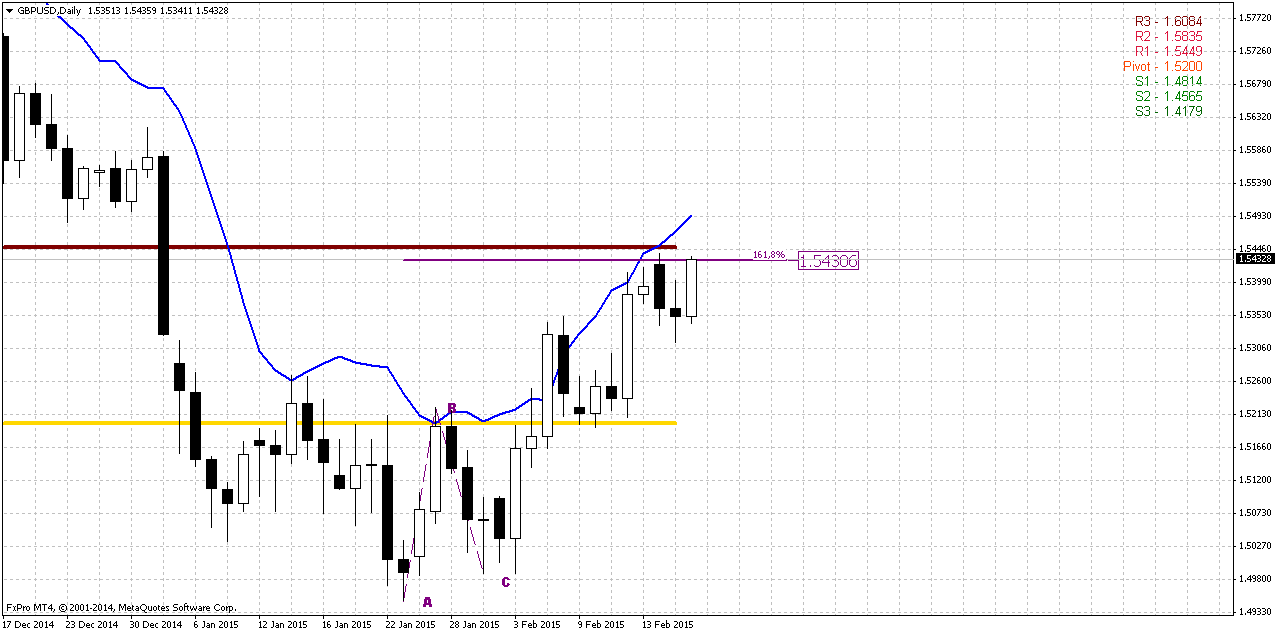
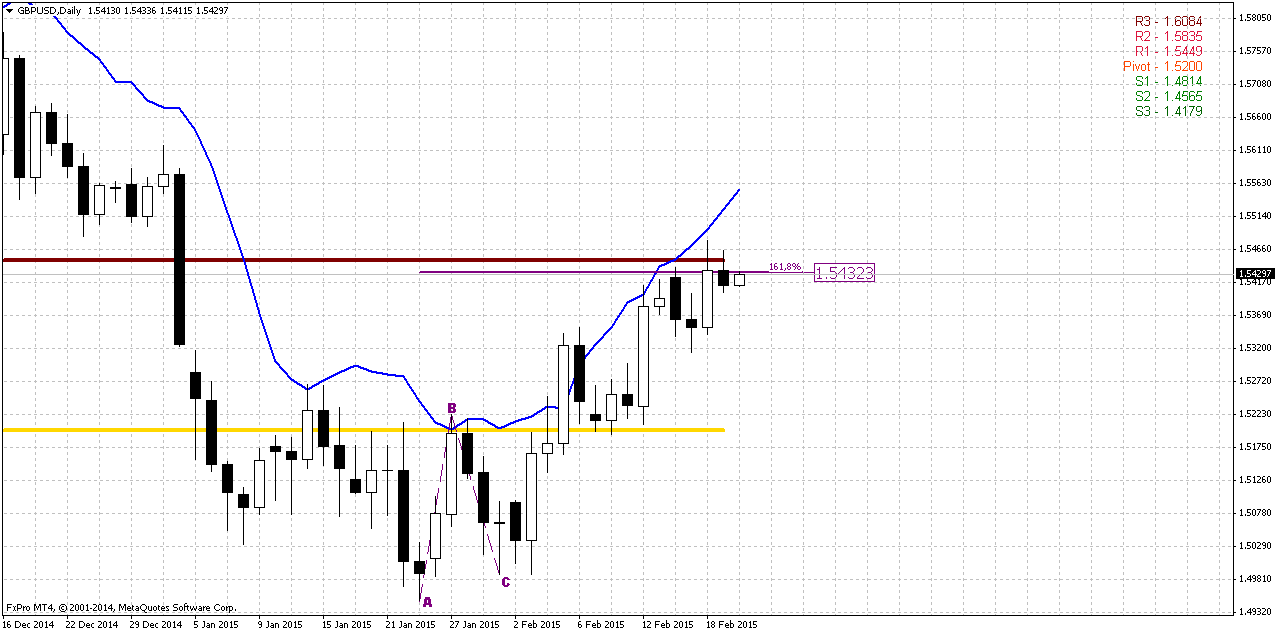
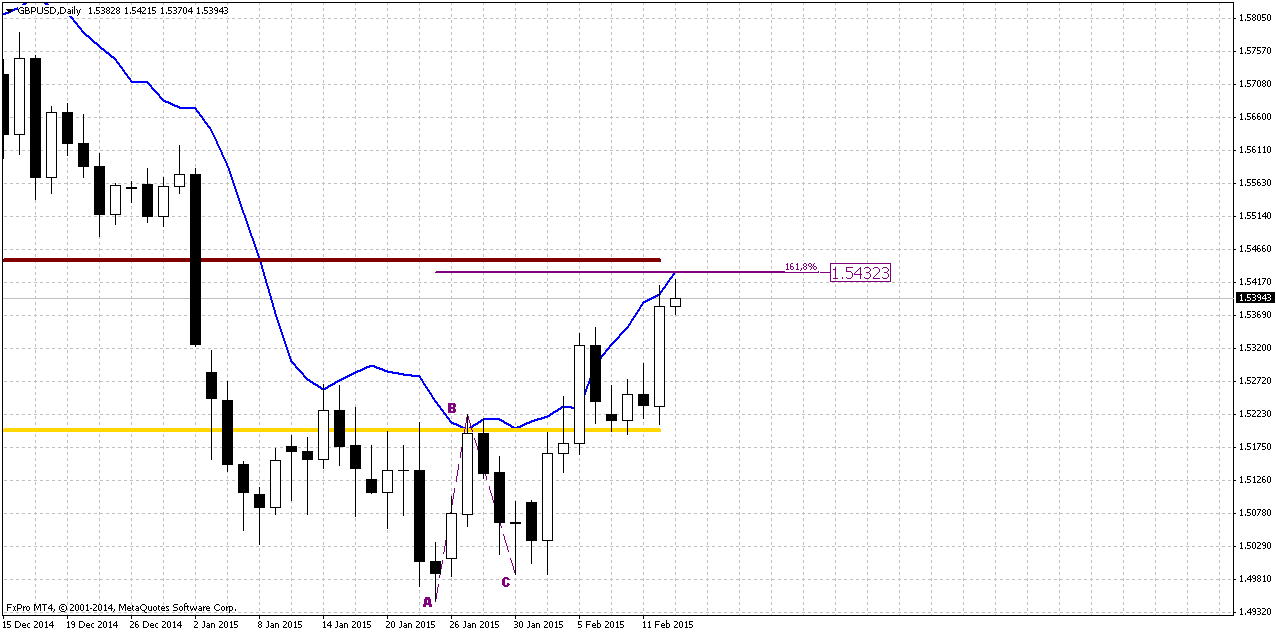
Daily
Daily trend stands bullish. Chart shows that coming resistance also includes 1.618 AB-CD target and daily overbought. In general, in recent 3 weeks market mostly was held by overbought. So, to get confidence with possible B&B “Sell” on weekly chart – it would be perfect if we could get some reversal pattern around 1.5550 area. In this case our puzzle will be completed and we could take short position.
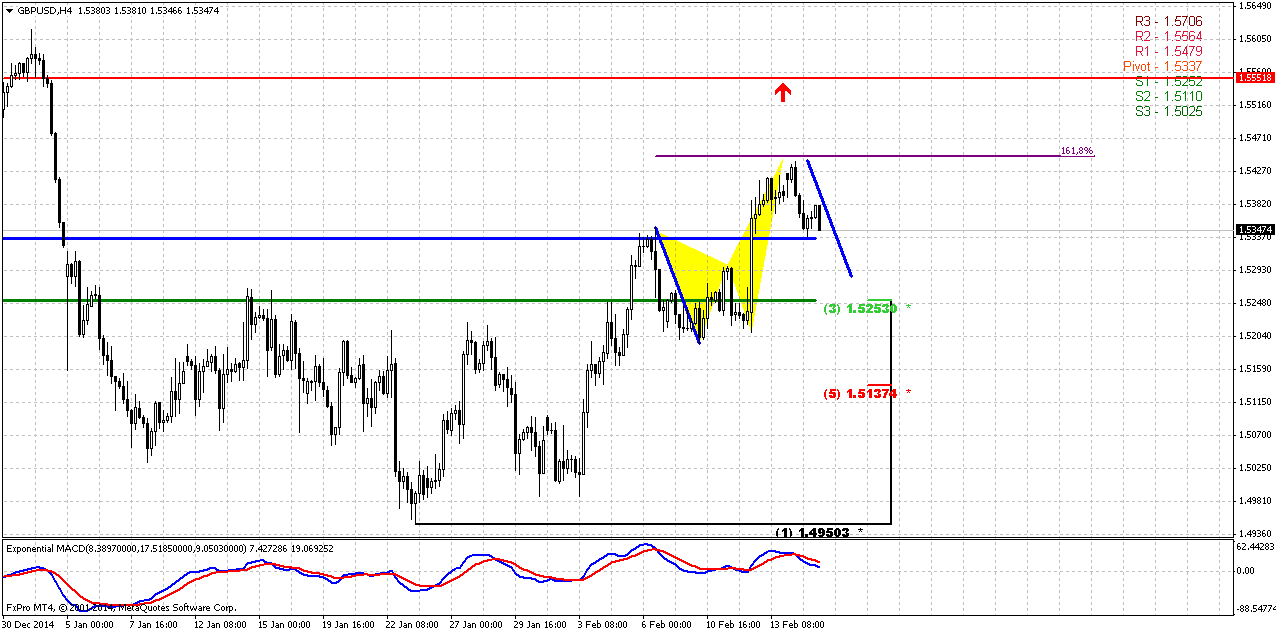
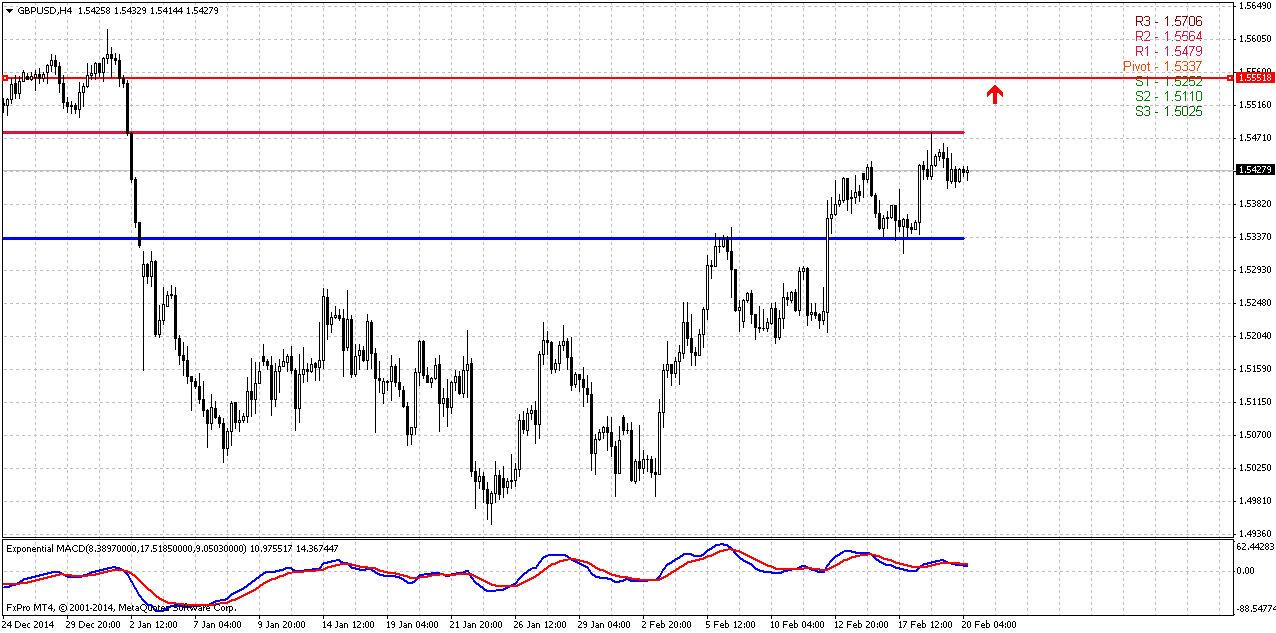
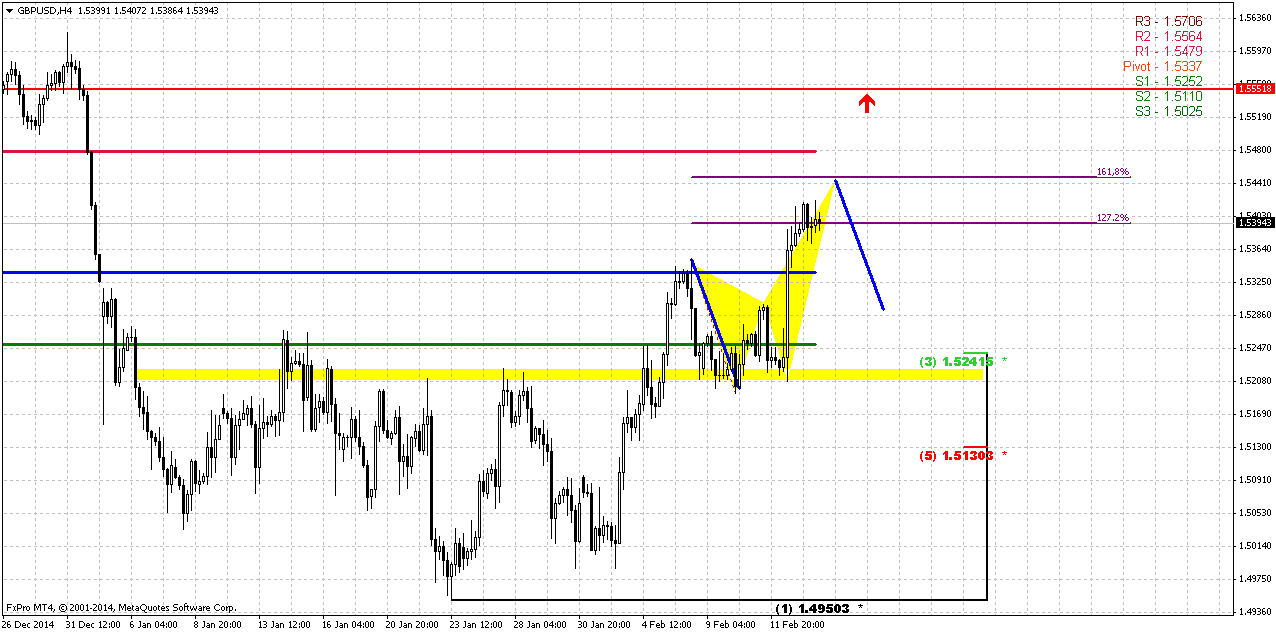
4-Hour
It would be better if we will take a look at 4-hour chart from “what we want to get” point of view. This will make simpler understanding of real action. Our major desire is to see reaching of 1.5550 weekly Fib resistance in a company of some reversal pattern. At the same time we know that 1.5450 is strong resistance by itself. It includes daily overbought AB=CD 1.618 target, butterfly and WPR1. This collection significantly reduces chances on direct rally to 1.5550 and tells that if even market will follow to 1.5550 level – it will do this after retracement.
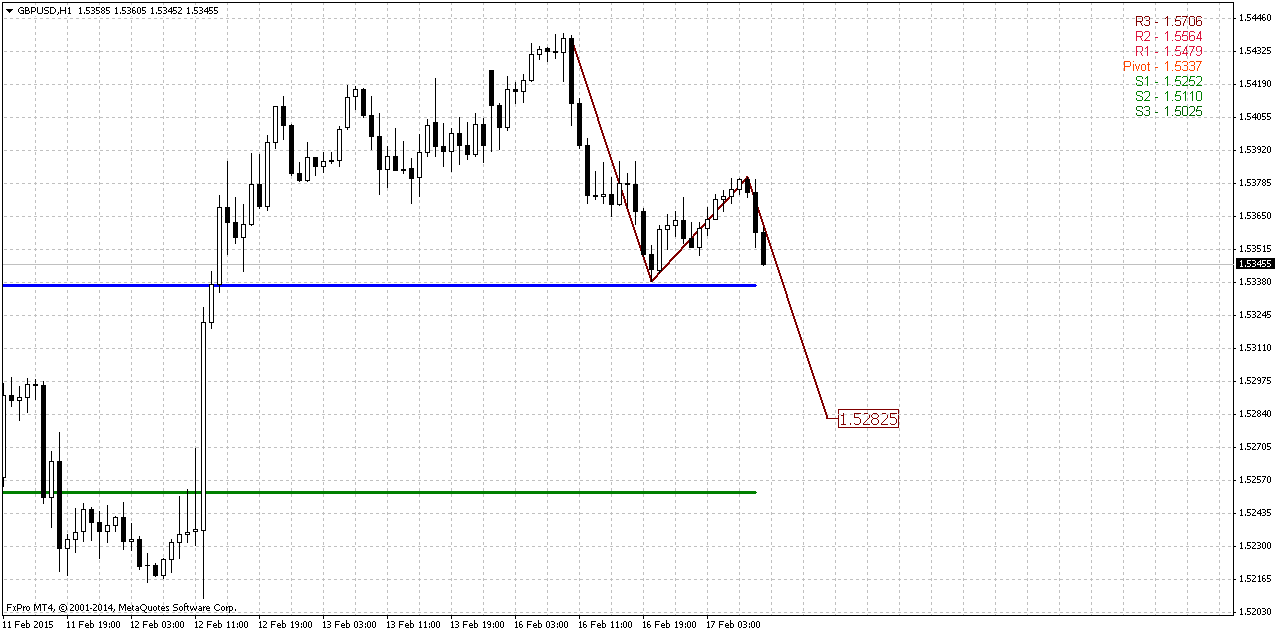
Right now Cable is forming butterfly “sell”. Since price has not reached daily AB-CD target and upside acceleration was solid on Friday – it means that we should get 1.618 butterfly and retracement probably will start from there. As a target of this retracement we could apply harmonic swing of previous one – when market was in similar conditions at overbought. This swing point on 1.5280 area between WPP and WPS1. But what reversal pattern could bring us to 1.5550? Well, they are quite the same - it could be another butterfly, for example, or even H&S, 1.618 3-Drive “Sell”…
Conclusion:
Bears control market right now and in long-term perspective downward action probably will continue if geopolitical force balance in Europe will remain the same. Pound could take the lead on European stage if EU will meet significant problems from Greece, especially in sphere of national and financial independency that could be supported by other countries that also are not satisfied with financial policy in EU, such as Catalonia in Spain. This is major long-term risks that could impact on value of major European currencies.
In short-term perspective existing of solid support on weekly chart, shy deviation in hedgers’ position and patterns on intraday chart tell that upside retracement could continue for awhile. As a result of this retracement – we will watch for possible B&B “Sell” pattern that could start from 1.5550 area.
The technical portion of Sive's analysis owes a great deal to Joe DiNapoli's methods, and uses a number of Joe's proprietary indicators. Please note that Sive's analysis is his own view of the market and is not endorsed by Joe DiNapoli or any related companies.
On Friday the major event was around GDP data in Europe and Michigan sentiment index in US. While sentiment has reduced – other currencies have got some support from temporal dollar weakness.
As our analysis on EUR still holds and next couple of weeks should clarify a lot of different moments, especially concerns around Greece and Ukraine. That’s why today we will prepare update on GBP. Pound has got some support on BoE comments on inflation level. Sterling looks stronger among other European currencies. As EU has fallen in turmoil as internal as external problems and nobody even speaks about rate hiking, franc although looks strong but recent scandals in Swiss banking sphere and pressure from US on providing personal data on clients and accounts couldn’t be treated as positive sign. Besides, Switzerland economy stands in stagnation; it has negative interest rates and deflation. Still, it is difficult to say by far –either recent Sterling growth is result of pure internal process, or partially external. If we would suggest negative scenario in EU – it is obviously that the European power center will shift to UK and Sterling will get solid support.
CFTC data shows that open interest that has dropped significantly on Scotland voting – now was restored at almost previous levels. Open interest mostly has grown on short positions. Picture of speculative positions looks obvious – solid increasing of shorts while longs stand anemic. At the same time, if you will take a look at commercial positions (hedgers) you will see interesting detail. While there is no surprise in solid part on commercial longs – they just a mirror of speculative shorts, even by chart shape, we see increasing of commercial shorts, but non-commercial longs (speculative bulls) stand flat or even decrease. It could be a sign that bearish sentiment becomes softer. May be it will not lead to reversal, but retracement is possible. It seems that market is tired a bit from endless drop.
Speculative Longs:
Technicals
Monthly
Since it is still valid – I would like to keep showing you monthly chart and analysis that we’ve made in December 2013 in our Forex Military School Course, where we were learning Elliot Waves technique.
https://www.forexpeacearmy.com/forex-forum/forex-military-school-complete-forex-education-pro-banker/30110-chapter-16-part-v-trading-elliot-waves-page-7-a.html
Our long term analysis suggests first appearing of new high on 4th wave at ~1.76 level and then starting of last 5th wave down. First condition was accomplished and we’ve got new high, but it was a bit lower – not 1.76 but 1.72. This was and is all time support-resistance area. Now we stand in final part of our journey. According to our 2013 analysis market should reach lows at 1.35 area. Let’s see what additional information we have right now.
Trend is bearish here, but GBP is not at oversold. Right now market has reached strong support area – Yearly Pivot support 1 and 5/8 major monthly Fib level. This is an area where market has stopped last time. Monthly chart give us just single AB-CD pattern with nearest target at 0.618 extension – 1.3088. Still, here we have another one non-Fib orienteer – lower border of current consolidation. If we will treat it as sideways action then lower border will stand ~1.42-1.43 area. But first we need to get over current support level and see what market could give us here. Currently 1.30-1.31 area looks unbelievable, but if we would suggest parity on EUR/USD and starting rate hiking cycle in US – why not? Still, this is very long-term picture and right now we’re mostly interested in reaction of the market on current support level. Our suggestions that we’ve made two weeks ago have been confirmed – and GBP shows upside action in February. Let’s see how long this journey will last…
Weekly
On previous research we had on weekly chart two questions – tactical and strategical. Tactically we’ve talked on bullish “Stretch” pattern and its target around 1.5350 area. Thus 250 pips rally was our short-term target. Now we see that GBP has completed this. Tactically we’ve thought about patterns of greater scale and could recent rally become part of such pattern. Particularly speaking we’ve talked about either B&B “Sell” or DRPO “Buy” here. And this is most important question here. Personally guys, I would better make a stake on DRPO by some reasons. First is – we have strong monthly support and CFTC data that increases chances on deeper upward action. But it couldn’t be achieved by B&B. Second is, if you will take a look at technical picture you’ll see that Sterling will not reach 1.58 Fib level within 3 closes above 3x3 DMA just because 1.58 stands too far in overbought area. The only way how we could get B&B “Sell” here is to look not at whole thrust, but at its part from 1.6523 top. In this case B&B is possible, if market will reach 1.5550 resistance on next week. This B&B probably will have nice chances on success, since this is also MPR1 and weekly overbought. So, it seems that this will become our primary pattern on coming week.
Daily
Daily trend stands bullish. Chart shows that coming resistance also includes 1.618 AB-CD target and daily overbought. In general, in recent 3 weeks market mostly was held by overbought. So, to get confidence with possible B&B “Sell” on weekly chart – it would be perfect if we could get some reversal pattern around 1.5550 area. In this case our puzzle will be completed and we could take short position.
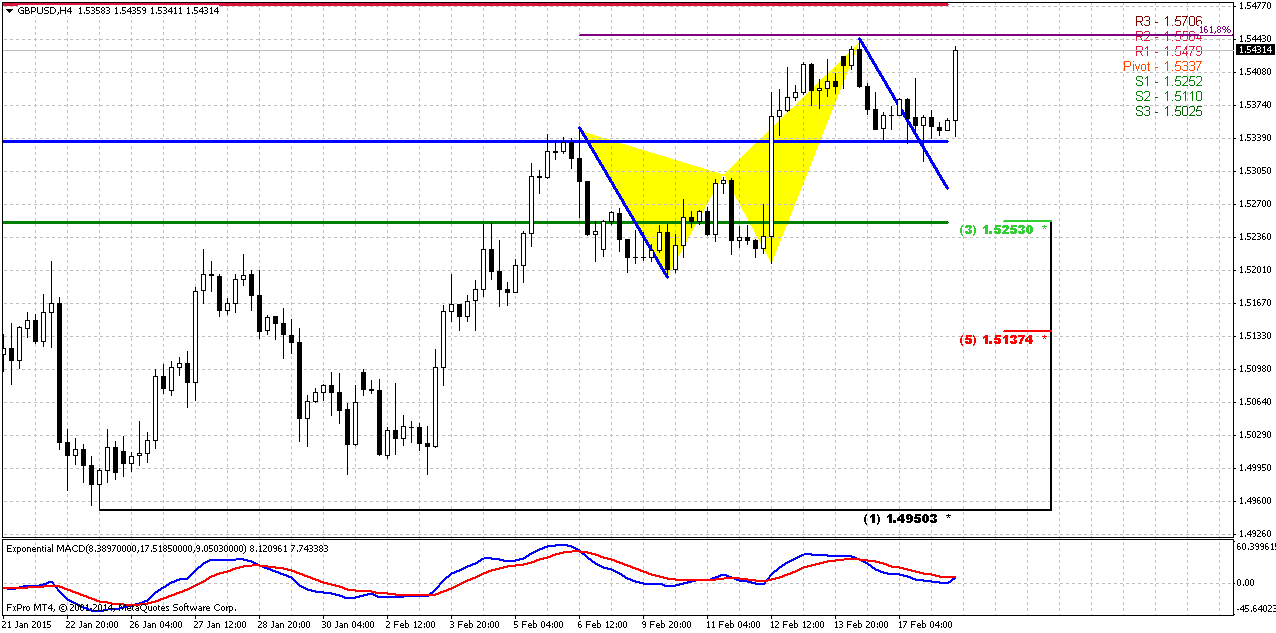
4-Hour
It would be better if we will take a look at 4-hour chart from “what we want to get” point of view. This will make simpler understanding of real action. Our major desire is to see reaching of 1.5550 weekly Fib resistance in a company of some reversal pattern. At the same time we know that 1.5450 is strong resistance by itself. It includes daily overbought AB=CD 1.618 target, butterfly and WPR1. This collection significantly reduces chances on direct rally to 1.5550 and tells that if even market will follow to 1.5550 level – it will do this after retracement.
Right now Cable is forming butterfly “sell”. Since price has not reached daily AB-CD target and upside acceleration was solid on Friday – it means that we should get 1.618 butterfly and retracement probably will start from there. As a target of this retracement we could apply harmonic swing of previous one – when market was in similar conditions at overbought. This swing point on 1.5280 area between WPP and WPS1. But what reversal pattern could bring us to 1.5550? Well, they are quite the same - it could be another butterfly, for example, or even H&S, 1.618 3-Drive “Sell”…
Conclusion:
Bears control market right now and in long-term perspective downward action probably will continue if geopolitical force balance in Europe will remain the same. Pound could take the lead on European stage if EU will meet significant problems from Greece, especially in sphere of national and financial independency that could be supported by other countries that also are not satisfied with financial policy in EU, such as Catalonia in Spain. This is major long-term risks that could impact on value of major European currencies.
In short-term perspective existing of solid support on weekly chart, shy deviation in hedgers’ position and patterns on intraday chart tell that upside retracement could continue for awhile. As a result of this retracement – we will watch for possible B&B “Sell” pattern that could start from 1.5550 area.
The technical portion of Sive's analysis owes a great deal to Joe DiNapoli's methods, and uses a number of Joe's proprietary indicators. Please note that Sive's analysis is his own view of the market and is not endorsed by Joe DiNapoli or any related companies.