Sive Morten
Special Consultant to the FPA
- Messages
- 18,727
Fundamentals
Although today we will talk on Canadian dollar, I would like to share with you interesting article that disclosures all stakes in Greece bet. It shows questions that stand under curtain and behind just Greek debt and creditors.
Paul Craig Roberts Warns Greek Government May Be Assassinated In This Crisis If They Pivot East To Stop World War III | King World News
Reuters reports dollar fell against a basket of currencies on Friday, hurt by softer-than-expected U.S. employment data amid thin volumes with most investors staying on the sidelines before Greece's weekend referendum on bailout conditions.
Volumes eased in the afternoon session in Europe with U.S. markets closed for Independence Day. Caution reigned, with investors trimming positions in riskier assets and currencies before the Greek vote on Sunday on an international bailout deal that could determine whether the country stays in the euro zone.
"With liquidity thin and the Greek referendum coming up, not many would want to take large positions going into the weekend. The U.S. jobs report has taken the wind out of the sails for the dollar for the time being," said Alvin Tan, currency strategist at Societe Generale.
The U.S. payrolls report showed employers hired 223,000 workers last month, fewer than the 230,000 increase forecast in a Reuters poll. The government also downgraded its reading on April and May job growth, while wage growth remained subdued.
Investors had been hoping that solid improvement in the labour market would reinforce expectations that the Federal Reserve will raise interest rates as early as September. Still, the report was not gloomy enough to quash expectations that the Fed would tighten later this year.
All in all, major currencies were hugging familiar ranges, with the euro supported by a poll that showed supporters of Greece's bailout terms taking a wafer-thin lead over the "No" vote backed by the leftist government.
Another poll by the Avgi newspaper, though, showed the 'No' camp were just in front.
"For the euro, a 'Yes' vote could lead to a bounce, but we would still prefer to sell it on rallies," added Societe Generale's Tan.
The International Monetary Fund warned on Thursday that Greece would need an extension of its European Union loans and a potentially large debt writeoff if it cannot implement economic reforms and its growth slows.
Analysts said negotiations after a "Yes" vote are likely to be prickly, and would keep gains in the euro limited.
Meanwhile, the Australian dollar fell to a 6-year low, hurt by disappointing domestic retail sales data and a continued sell-off in the Shanghai stock market. China is Australia's biggest trading partner and the Aussie is used as a proxy.
"We expect the Aussie to trend lower towards $0.72 medium-term," said Jane Foley, senior currency strategist at Rabobank.
Recent CFTC data does not give absolutely clear picture, but positions of bears look preferable. Open interest mostly was dropping on previous month, as well as Long positions, while shorts stand stronger and shows increasing since May. Two weeks ago we could see significant drop as in open interest as in long positions, while shorts again has showed increasing. This action mostly points on better chances of the bears to control market in short-term perspective.
Open Interest:
 Speculative Longs:

Speculative shorts:

Technicals
Monthly
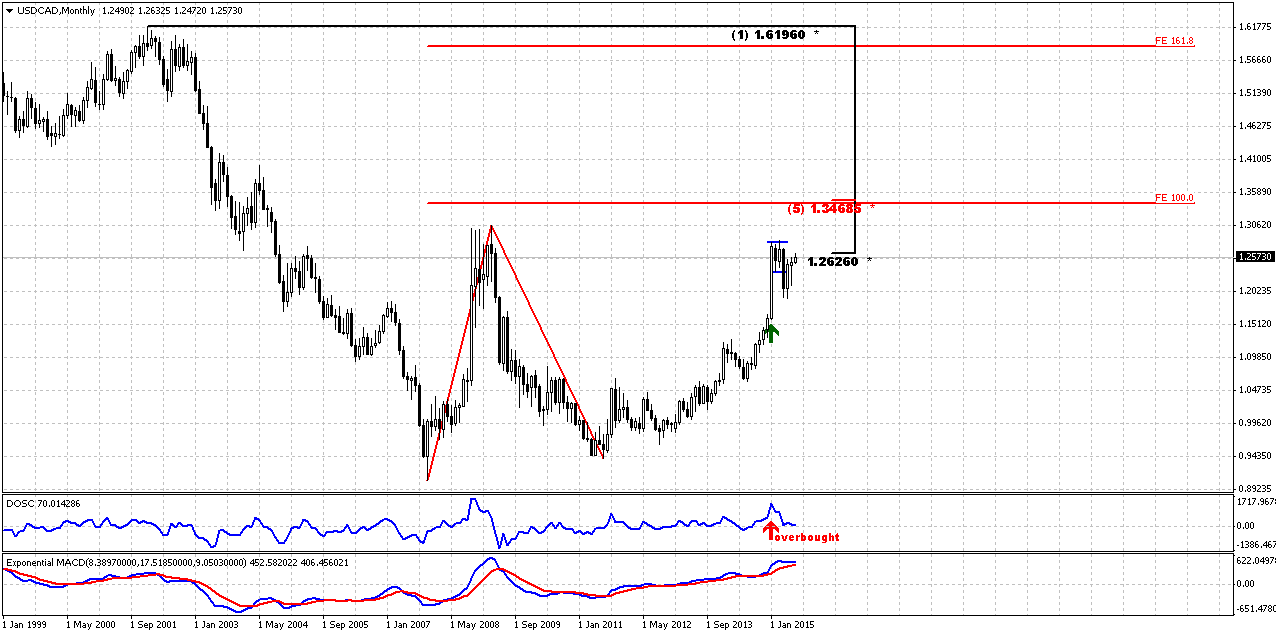
Monthly picture barely has changed since our previous discussion in the beginning of June. Price just has moved slightly higher inside the flag pattern. Monthly analysis mostly still stands the same and points on upward continuation to major target. Recent action just confirms that these thoughts seem correct by far.
Here is again our monthly analysis.
CAD trend is bullish. We do not have any yearly pivots here because CAD has passed through all of them, even YPR2 at 1.23 area. Last time we’ve discussed big AB-CD pattern in progress that already has passed above 0.618 target and has major destination point at 1.3420 that creates Agreement with major Fib resistance. This pattern is still valid and stands as cornerstone of our analysis.
As market right now stands at 50% Fib level and has reached monthly overbought – this creates Stretch pattern and CAD almost whole month stands in tight range. All these moments lead us to conclusion that upward action probably should continue. Here are our arguments:
- Market has not reached major AB=CD target and odds suggest that market never shows reliable bearish reversal until this target will not be hit;
- We see acceleration candle that increase chances on upside continuation. It seems that market has stopped mostly due overbought and Fib resistance;
- Market stands very tight right under resistance and forms the shape of bullish flag.
All these moments point on doubts of possible downward reversal, especially taking into consideration CFTC data.”
Thus, previous analysis has led us to conclusion that market probably will show bounce down to respect resistance and overbought, but this should not be reversal, but retracement that was triggered by perfect weekly DRPO “Sell”. Now this setup has been finished and market has returned back to upside action.
Market is not at overbought any more, but trend is still bullish here. If you will take a look at DOSC indicator you’ll see that it is coiling around zero. It means that Stretch pattern mostly has reached its target and worked out. Market was able to show retracement to the half of thrusting candle and this suggests possible further upside continuation. Besides, price has returned back in flag pattern that could be treated as “bearish trap” setup and also suggests upside breakout of the flag.
So, monthly picture mostly stands in favor of upside continuation in long-term perspective to our major long-term target 1.3470 – Agreement with major Fib resistance level.
Finally, previously we’ve discussed possible deeper downward retracement before market will turn to upside continuation; so, let’s see what has happened and what to expect from CAD now.
Weekly
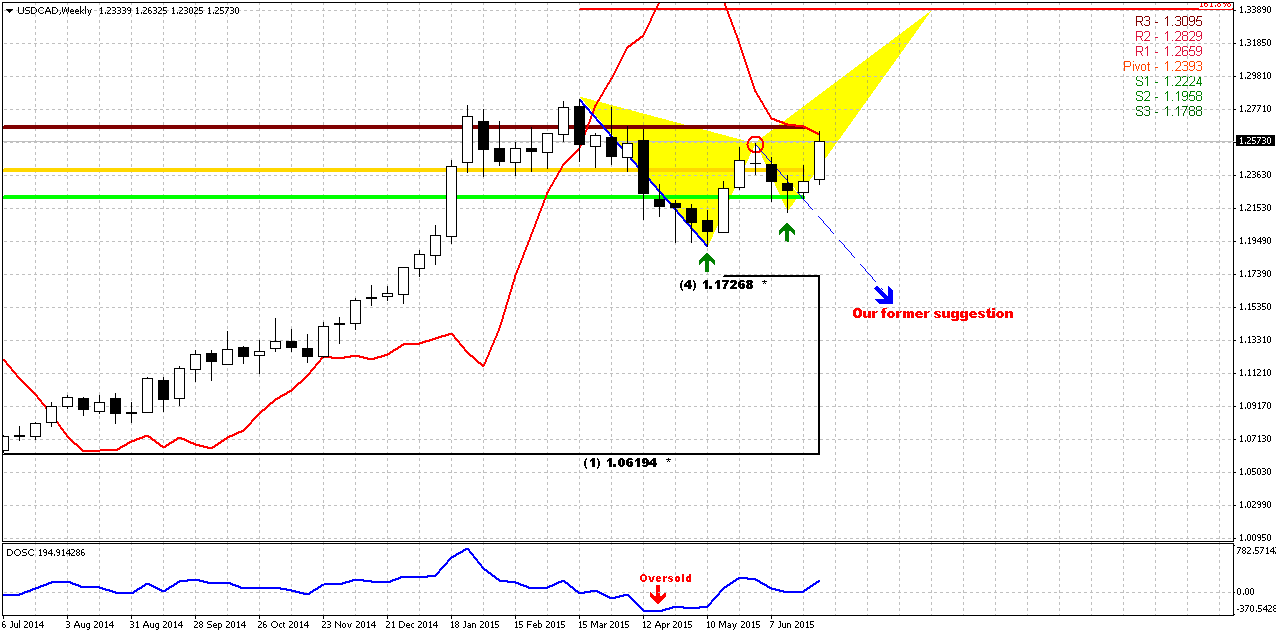
On weekly chart we see very important changes since our last analysis. Last time we were wonder what upside action is. As market has formed perfect DRPO “Sell” – it could be just reaction on oversold and after that market could continue move down and form 2-leg AB-CD retracement. That is what we were talking about above – in monthly chart analysis. From the other side, CAD could continue move up as it is suggested by monthly picture. Now we see that CAD has turned finally to second scenario. In fact downward AB-CD was erased, since last week CAD has exceeded “C” point of this AB-CD pattern. In general picture looks bullish here, price has moved above MPP and almost has reached MPR1. Overall picture has the signs of bullish dynamic pressure, since trend holds bearish but market forms higher lows.
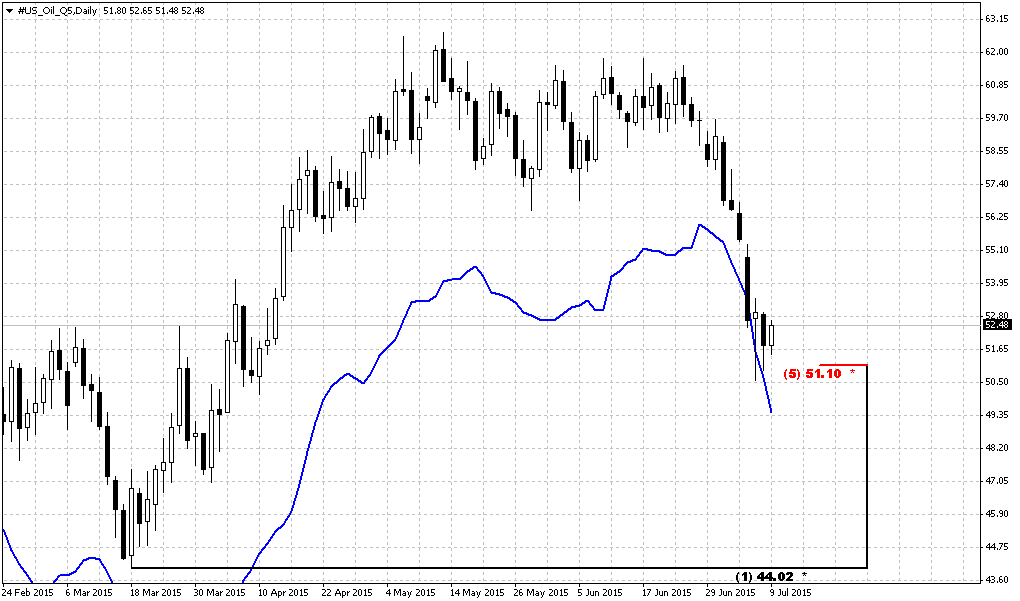
The one negative sign here is bearish stop grabber that has appeared also last week. As market is not at overbought this pattern has fewer chances to succeed. Besides, now there are more factors stands in favor of upside continuation, including oil prices, they have dropped significantly in June – almost for 10%. Now Brent August futures are trading around 55$, while in the beginning of the month they were around 61$.
That’s being said, theoretically market keeps chances on possible bearish reversal, but we think that chances on this scenario are very shy. Also, guys, you could easily recognize butterfly “Sell” pattern here that has target at 1.34 area – almost at the same level as our major monthly one.
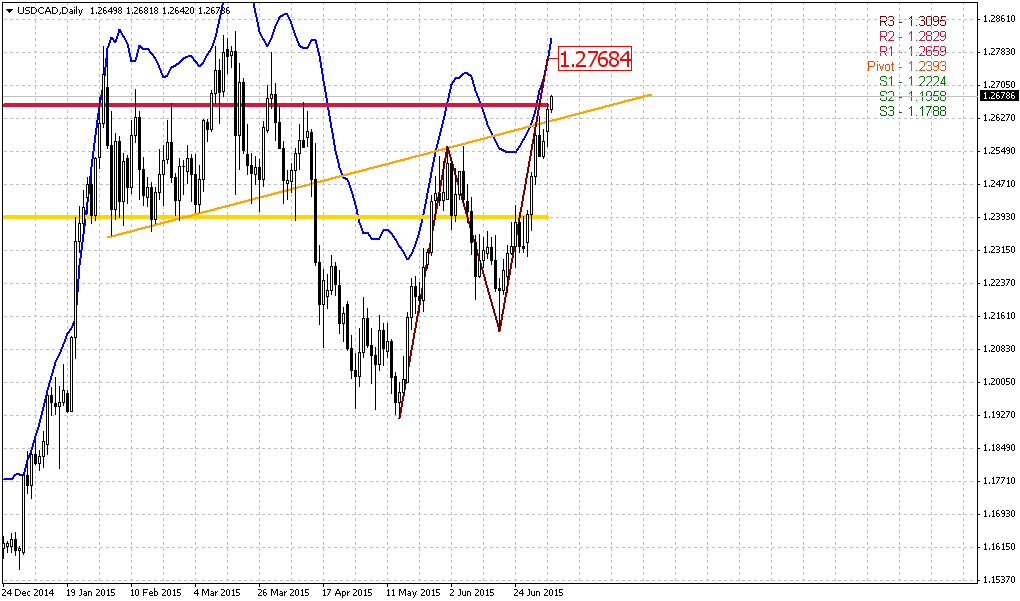
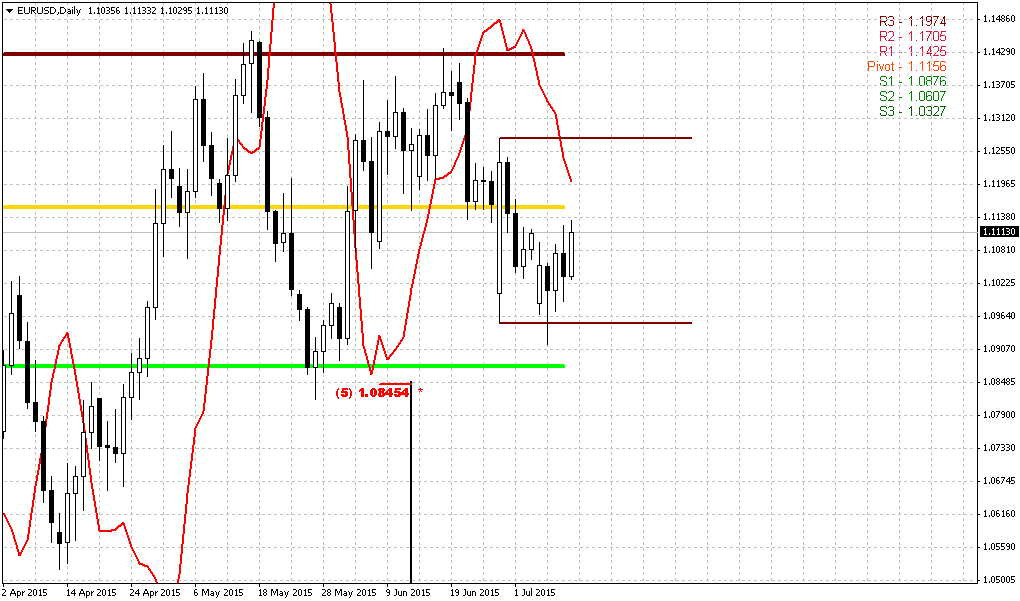
Daily
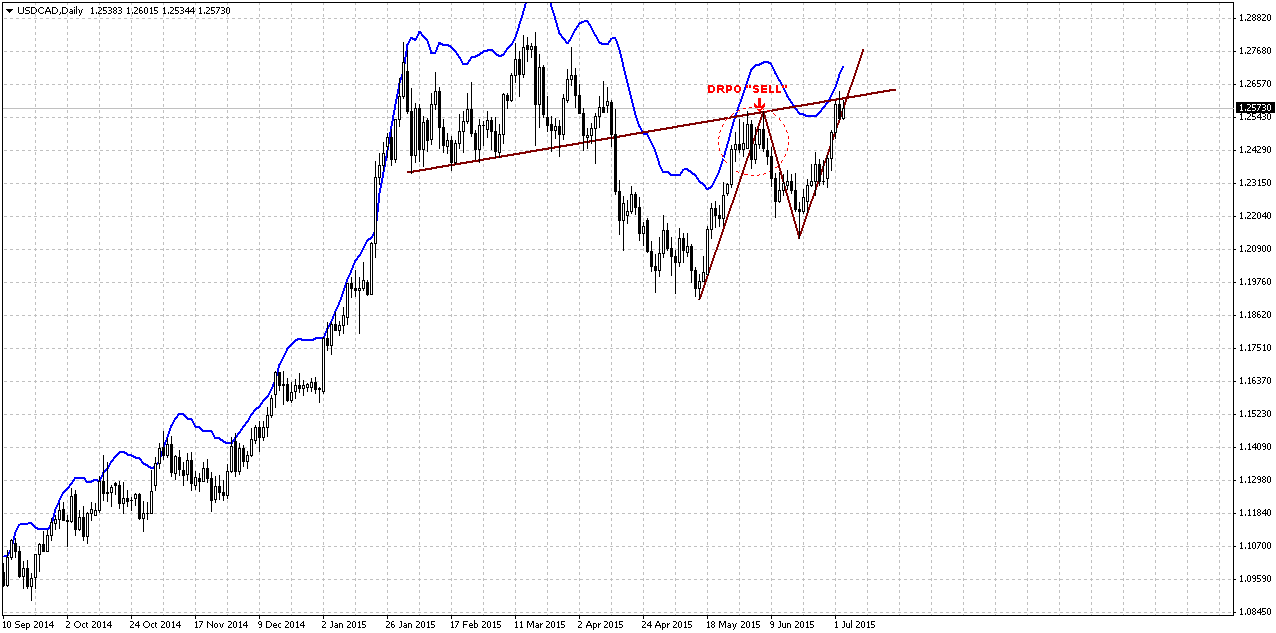
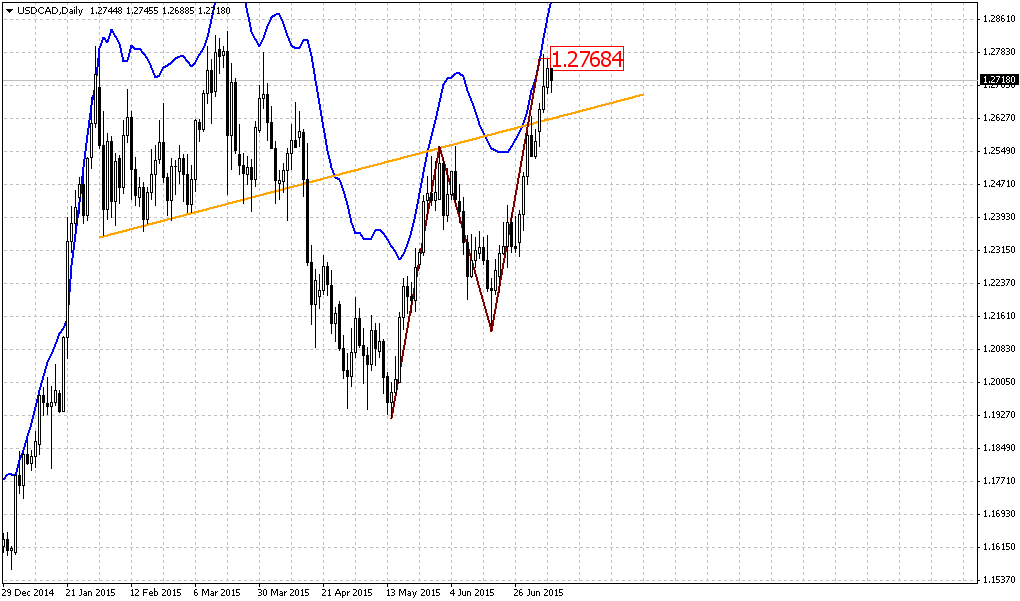
Here again, we need to recall what we’ve discussed last time to better understand what to expect. Trend is bullish daily chart. Previously we’ve found very important tool – trend line that we’ve used for estimating direction. Last analysis was rather successful. We didn’t get completed AB=CD action, but DPRO “Sell” has worked excellent around first touch of this trend line. So, this action clarifies the nature of first downward bounce.
Since upside action from 1.1850 to trend line was reaction on weekly oversold, market should have continued downward action right after oversold condition been corrected, if market really was bearish. But this has not happened. As soon as DRPO “Sell” has been completed, CAD again has turned north and now is testing trend line for second time. Price even has not completed 0.618 AB-CD down on this DRPO Action. This clearly shows that market is not bearish. Now it stands again in similar conditions – overbought at trend line, but now we do not have any DRPO “Sell”. Instead of that we have upside AB=CD pattern and market already has passed its minor 0.618 extension. So, it tells that minor bounce down is possible, but it is definitely should not be too significant.
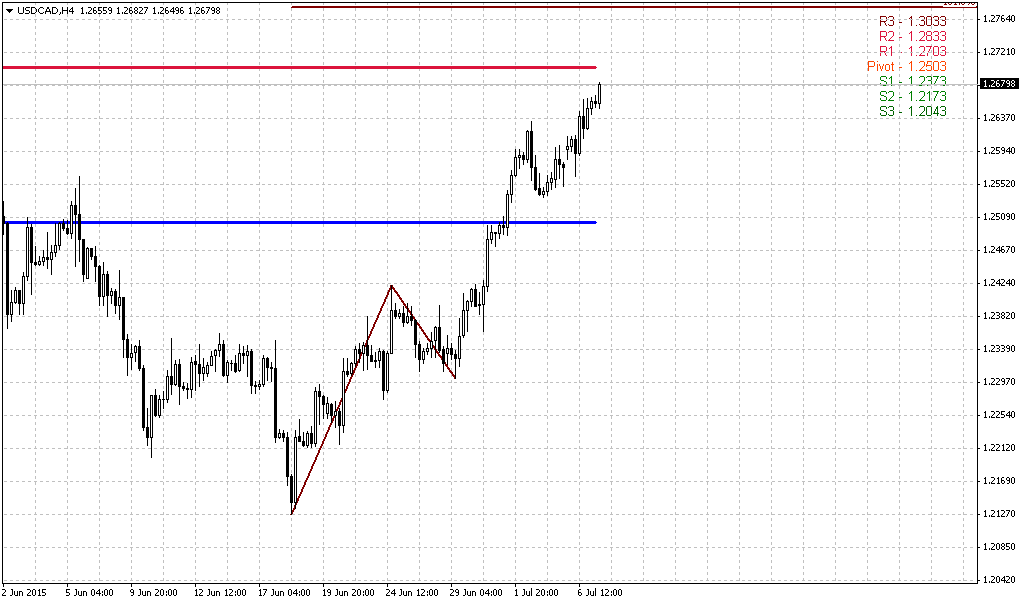
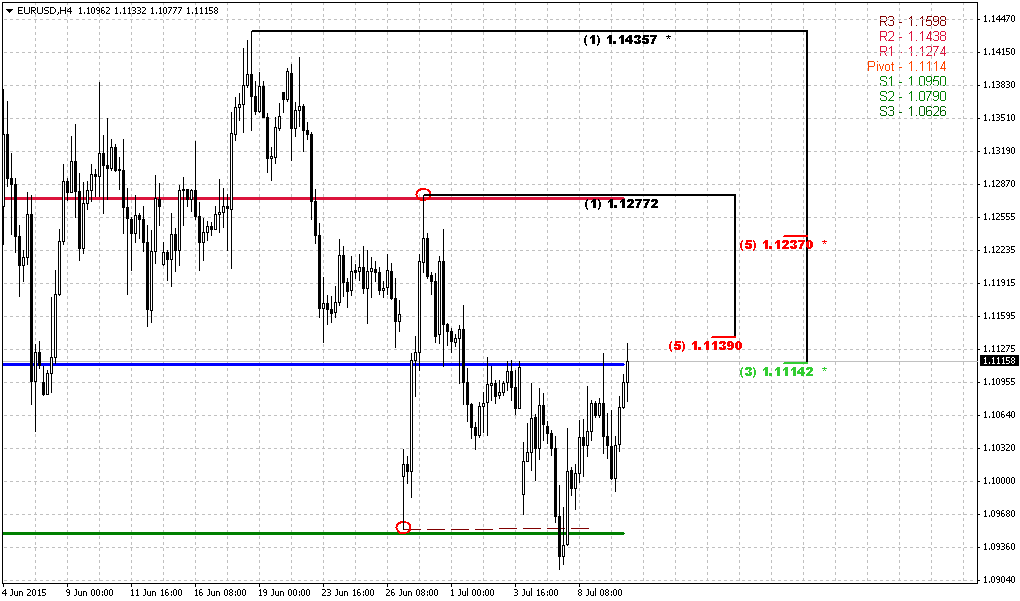
4-Hour
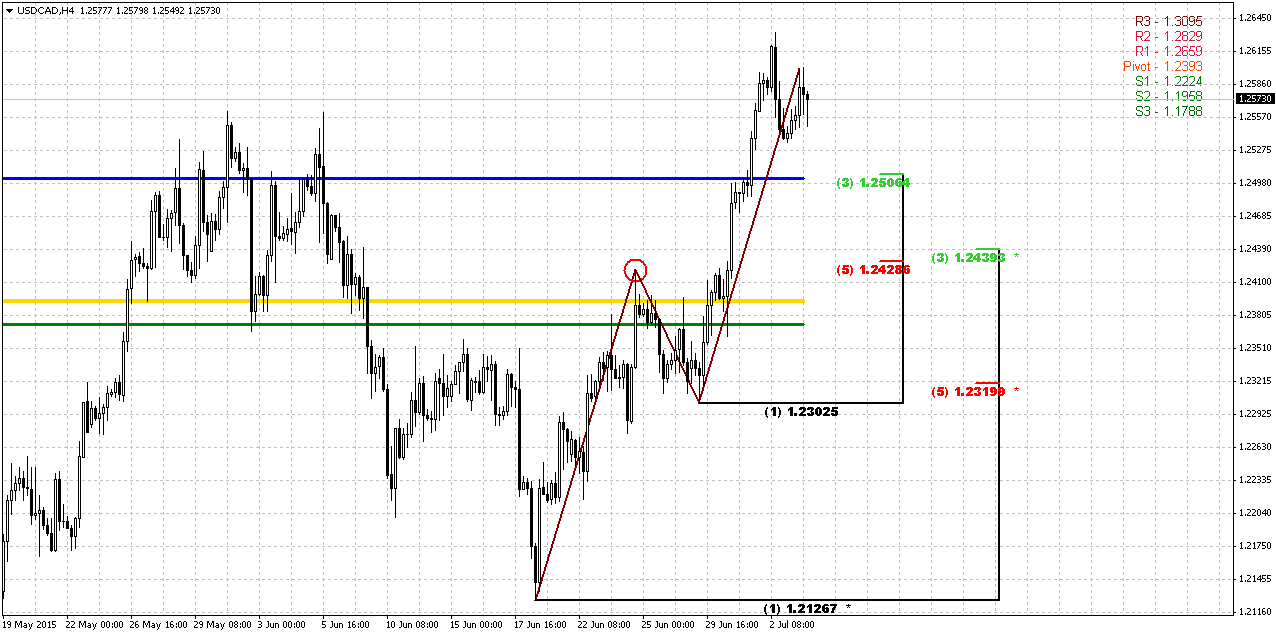
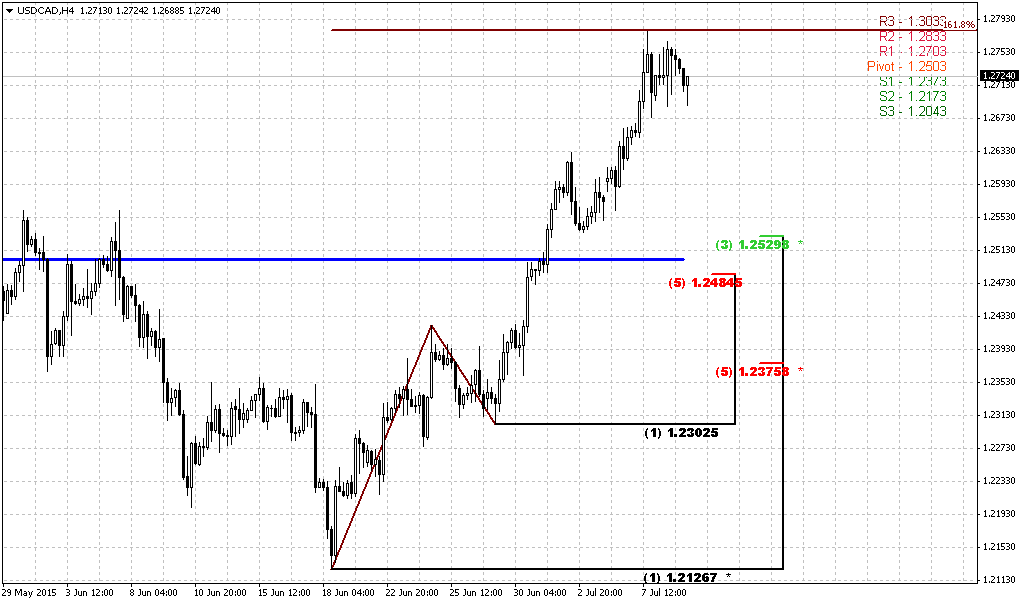
4-hour chart shows also inner AB=CD pattern that has been completed on Friday (right at daily trend line and overbought). May be we will get DRPO “Sell” here, it is possible. Anyway, despite how retracement will start, our major level to watch is 1.24-1.2430. We are not interested much with 1.25 area, although this is Fib level and WPP, mostly because market stands at overbought and this fact suggests deeper retracement. While 1.24 area, in turn, is significant support – MPP, WPS1 and K-support area. There we will be watching for buy opportunities.
Conclusion:
Long term analysis and fundamental background confirms our long-term view on CAD and its long term target around 1.3470 area. CFTC data, Crude oil prices and dollar appreciation now support upside action on USD/CAD currency pair.
In short-term perspective we have to find area where we could take long position. By now we think that 1.24-1.2430 area looks attractive for that purpose.
The technical portion of Sive's analysis owes a great deal to Joe DiNapoli's methods, and uses a number of Joe's proprietary indicators. Please note that Sive's analysis is his own view of the market and is not endorsed by Joe DiNapoli or any related companies.
Although today we will talk on Canadian dollar, I would like to share with you interesting article that disclosures all stakes in Greece bet. It shows questions that stand under curtain and behind just Greek debt and creditors.
Paul Craig Roberts Warns Greek Government May Be Assassinated In This Crisis If They Pivot East To Stop World War III | King World News
Reuters reports dollar fell against a basket of currencies on Friday, hurt by softer-than-expected U.S. employment data amid thin volumes with most investors staying on the sidelines before Greece's weekend referendum on bailout conditions.
Volumes eased in the afternoon session in Europe with U.S. markets closed for Independence Day. Caution reigned, with investors trimming positions in riskier assets and currencies before the Greek vote on Sunday on an international bailout deal that could determine whether the country stays in the euro zone.
"With liquidity thin and the Greek referendum coming up, not many would want to take large positions going into the weekend. The U.S. jobs report has taken the wind out of the sails for the dollar for the time being," said Alvin Tan, currency strategist at Societe Generale.
The U.S. payrolls report showed employers hired 223,000 workers last month, fewer than the 230,000 increase forecast in a Reuters poll. The government also downgraded its reading on April and May job growth, while wage growth remained subdued.
Investors had been hoping that solid improvement in the labour market would reinforce expectations that the Federal Reserve will raise interest rates as early as September. Still, the report was not gloomy enough to quash expectations that the Fed would tighten later this year.
All in all, major currencies were hugging familiar ranges, with the euro supported by a poll that showed supporters of Greece's bailout terms taking a wafer-thin lead over the "No" vote backed by the leftist government.
Another poll by the Avgi newspaper, though, showed the 'No' camp were just in front.
"For the euro, a 'Yes' vote could lead to a bounce, but we would still prefer to sell it on rallies," added Societe Generale's Tan.
The International Monetary Fund warned on Thursday that Greece would need an extension of its European Union loans and a potentially large debt writeoff if it cannot implement economic reforms and its growth slows.
Analysts said negotiations after a "Yes" vote are likely to be prickly, and would keep gains in the euro limited.
Meanwhile, the Australian dollar fell to a 6-year low, hurt by disappointing domestic retail sales data and a continued sell-off in the Shanghai stock market. China is Australia's biggest trading partner and the Aussie is used as a proxy.
"We expect the Aussie to trend lower towards $0.72 medium-term," said Jane Foley, senior currency strategist at Rabobank.
Recent CFTC data does not give absolutely clear picture, but positions of bears look preferable. Open interest mostly was dropping on previous month, as well as Long positions, while shorts stand stronger and shows increasing since May. Two weeks ago we could see significant drop as in open interest as in long positions, while shorts again has showed increasing. This action mostly points on better chances of the bears to control market in short-term perspective.
Open Interest:
Speculative shorts:
Technicals
Monthly
Monthly picture barely has changed since our previous discussion in the beginning of June. Price just has moved slightly higher inside the flag pattern. Monthly analysis mostly still stands the same and points on upward continuation to major target. Recent action just confirms that these thoughts seem correct by far.
Here is again our monthly analysis.
CAD trend is bullish. We do not have any yearly pivots here because CAD has passed through all of them, even YPR2 at 1.23 area. Last time we’ve discussed big AB-CD pattern in progress that already has passed above 0.618 target and has major destination point at 1.3420 that creates Agreement with major Fib resistance. This pattern is still valid and stands as cornerstone of our analysis.
As market right now stands at 50% Fib level and has reached monthly overbought – this creates Stretch pattern and CAD almost whole month stands in tight range. All these moments lead us to conclusion that upward action probably should continue. Here are our arguments:
- Market has not reached major AB=CD target and odds suggest that market never shows reliable bearish reversal until this target will not be hit;
- We see acceleration candle that increase chances on upside continuation. It seems that market has stopped mostly due overbought and Fib resistance;
- Market stands very tight right under resistance and forms the shape of bullish flag.
All these moments point on doubts of possible downward reversal, especially taking into consideration CFTC data.”
Thus, previous analysis has led us to conclusion that market probably will show bounce down to respect resistance and overbought, but this should not be reversal, but retracement that was triggered by perfect weekly DRPO “Sell”. Now this setup has been finished and market has returned back to upside action.
Market is not at overbought any more, but trend is still bullish here. If you will take a look at DOSC indicator you’ll see that it is coiling around zero. It means that Stretch pattern mostly has reached its target and worked out. Market was able to show retracement to the half of thrusting candle and this suggests possible further upside continuation. Besides, price has returned back in flag pattern that could be treated as “bearish trap” setup and also suggests upside breakout of the flag.
So, monthly picture mostly stands in favor of upside continuation in long-term perspective to our major long-term target 1.3470 – Agreement with major Fib resistance level.
Finally, previously we’ve discussed possible deeper downward retracement before market will turn to upside continuation; so, let’s see what has happened and what to expect from CAD now.
Weekly
On weekly chart we see very important changes since our last analysis. Last time we were wonder what upside action is. As market has formed perfect DRPO “Sell” – it could be just reaction on oversold and after that market could continue move down and form 2-leg AB-CD retracement. That is what we were talking about above – in monthly chart analysis. From the other side, CAD could continue move up as it is suggested by monthly picture. Now we see that CAD has turned finally to second scenario. In fact downward AB-CD was erased, since last week CAD has exceeded “C” point of this AB-CD pattern. In general picture looks bullish here, price has moved above MPP and almost has reached MPR1. Overall picture has the signs of bullish dynamic pressure, since trend holds bearish but market forms higher lows.
The one negative sign here is bearish stop grabber that has appeared also last week. As market is not at overbought this pattern has fewer chances to succeed. Besides, now there are more factors stands in favor of upside continuation, including oil prices, they have dropped significantly in June – almost for 10%. Now Brent August futures are trading around 55$, while in the beginning of the month they were around 61$.
That’s being said, theoretically market keeps chances on possible bearish reversal, but we think that chances on this scenario are very shy. Also, guys, you could easily recognize butterfly “Sell” pattern here that has target at 1.34 area – almost at the same level as our major monthly one.
Daily
Here again, we need to recall what we’ve discussed last time to better understand what to expect. Trend is bullish daily chart. Previously we’ve found very important tool – trend line that we’ve used for estimating direction. Last analysis was rather successful. We didn’t get completed AB=CD action, but DPRO “Sell” has worked excellent around first touch of this trend line. So, this action clarifies the nature of first downward bounce.
Since upside action from 1.1850 to trend line was reaction on weekly oversold, market should have continued downward action right after oversold condition been corrected, if market really was bearish. But this has not happened. As soon as DRPO “Sell” has been completed, CAD again has turned north and now is testing trend line for second time. Price even has not completed 0.618 AB-CD down on this DRPO Action. This clearly shows that market is not bearish. Now it stands again in similar conditions – overbought at trend line, but now we do not have any DRPO “Sell”. Instead of that we have upside AB=CD pattern and market already has passed its minor 0.618 extension. So, it tells that minor bounce down is possible, but it is definitely should not be too significant.
4-Hour
4-hour chart shows also inner AB=CD pattern that has been completed on Friday (right at daily trend line and overbought). May be we will get DRPO “Sell” here, it is possible. Anyway, despite how retracement will start, our major level to watch is 1.24-1.2430. We are not interested much with 1.25 area, although this is Fib level and WPP, mostly because market stands at overbought and this fact suggests deeper retracement. While 1.24 area, in turn, is significant support – MPP, WPS1 and K-support area. There we will be watching for buy opportunities.
Conclusion:
Long term analysis and fundamental background confirms our long-term view on CAD and its long term target around 1.3470 area. CFTC data, Crude oil prices and dollar appreciation now support upside action on USD/CAD currency pair.
In short-term perspective we have to find area where we could take long position. By now we think that 1.24-1.2430 area looks attractive for that purpose.
The technical portion of Sive's analysis owes a great deal to Joe DiNapoli's methods, and uses a number of Joe's proprietary indicators. Please note that Sive's analysis is his own view of the market and is not endorsed by Joe DiNapoli or any related companies.
 However, i contacted one of my Film Producer friends as i used to be an Actor here in London. It seems Dr King has been hired to write the script for the follow up movie 'Troy2' featuring Brad Pitt and Eric Bana! The amount he is being paid has not been disclosed as