(thanks lolly

)
brandon, it could be but from what i see on my charts there seems to be too much bullish pressure. on daily, price has stayed above the RSST fib level of 61.8% of the drop from 36xx even though yesterday an attempt was made to breach it short, it didn't succeed and we bounced back up from there. on weekly, same, up pressure still there. also, on weekly key levels start at around 3475 to 353x, which is not that far on a weekly chart from current price of 3350 (3.20 AM GMT 14 JUNE). on weekly a K-area starts right above above 353x and at 3700 we find a COP (61.8%) and weekly RSST1 is at 3687.
so my guess would be that unless some macro shock, we go up at least until 3475.
we could also have a gartley SELL completing at 3435 on daily. honestly, i have no idea. all i know is that the MACD has not turned yet, and the orange/green indicator lines just entered the OB zone on daily. also, price is staying well above the thin yellow line, which unless crossed means that the trend is still underway. the situation is even more striking on my weekly chart. (the other colored fat lines are just your typical SMAs). so unless daily reverts back under 3294 or so, which is the 61.8% retrace i was mentioning above, i would stay with the long trend.
all this being said, when looking at H4 and H1, it does seem like we have reached a top. so in the eventuality we go down once more i'd watch what happens around the 50MA, 100MA and 200MA on H1 and M5 (and the 61.8% on daily i mentioned above--hourly 100MA is getting close to that level as well, so 329x is one key level) and decide whether or not to buy the dip. obviously if SPPT fails at those MA levels, then short
on M5 we completed some weird looking (on my chart) gartley SELL (XOP of AB=CD hit) and drop from there in progress now. watching 3320 as key 61.8% level of AD leg where also 800MA comes. below there, SPPT around 3285/9x which if breached, short. (plus other considerations... sorry no time to go into further detail).
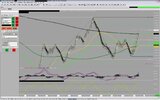
Butterfly "BUY" on 4H? Please let me know if I am incorrect.
View attachment 9716
Best,
Brandon