Sive Morten
Special Consultant to the FPA
- Messages
- 18,673
Monthly
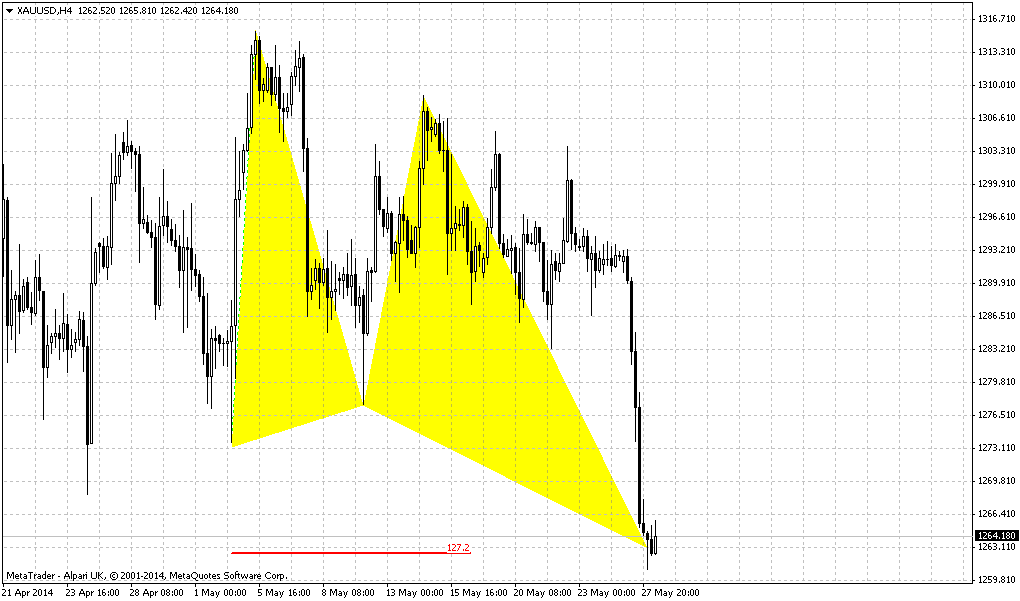
I will not repeat fundamental part here, guys, since I’ve posted it in EUR weekly research. As Gold market has not shown any solid action on previous week, I’ve decided to take a look at GBP.
B]Technical[/B]
As we noted in previous GBP research, on February, we have some intriguing moment – our long term analysis that we’ve made in Forex Military School in 2011. Here is the chart:
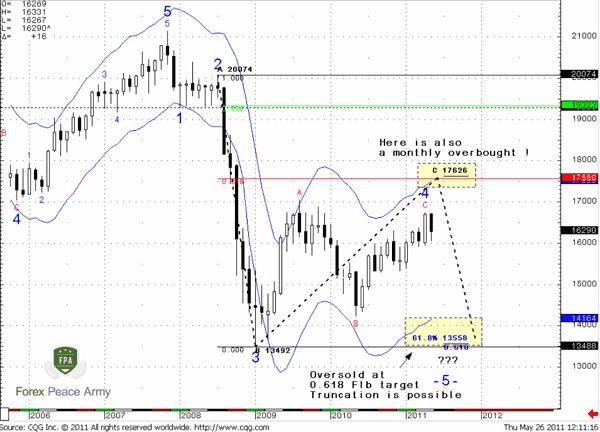
As you can see, we have suggested downward reversal as 5th wave of Elliot waves pattern after upward breakout of initial retracement’s top. Although market has formed more swings on the way to final upward action – this is not very important. The major important thing here is a final move up to final target of retracement before downward reversal. And now we stand precisely at the eve of this action. Better to say that this move already has started, and market shows some progress with upward action since our previous research.
Now let’s shift to modern chart.
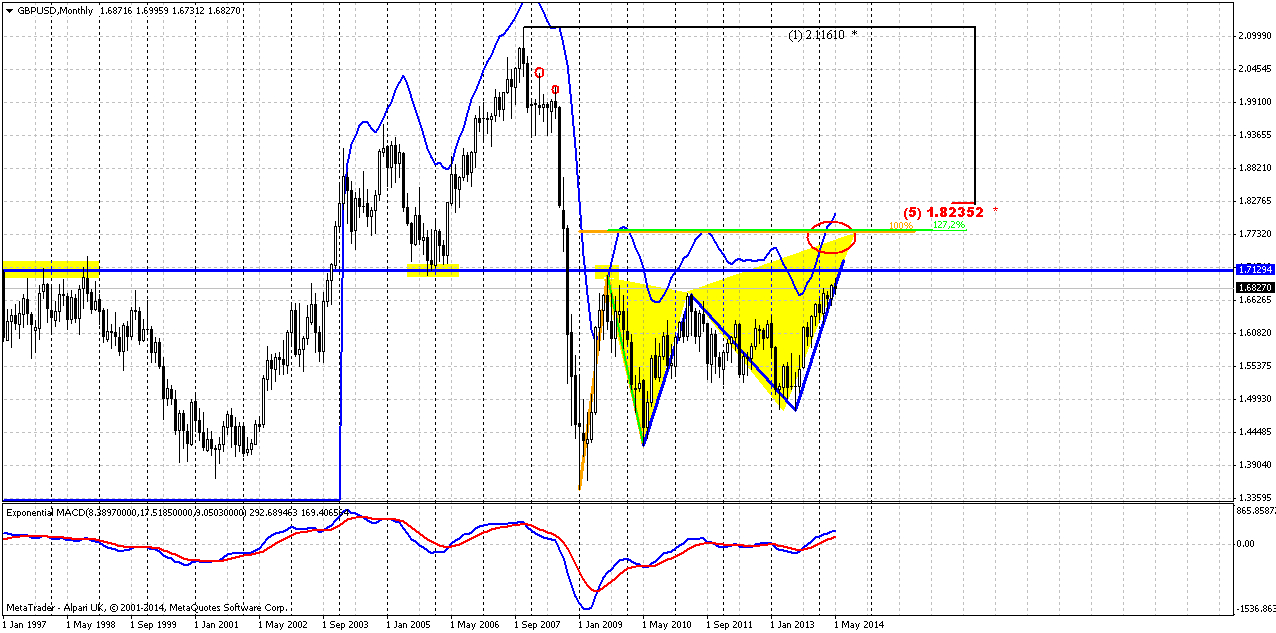
Market has passed through minor AB-CD 0.618 extension. It means that next target is 100% extension. Trend holds bullish here. Right now market is forming different patterns that point on the same level. They are AB-CD that is based on initial ABC swing of this retracement and butterfly “sell” that has 1.27 reversal target in the same area – around 1.77-1.7750. This level also will be monthly overbought and major 5/8 Fib resistance. In fact you can get three different Fib levels that will envelop 1.77 area, if you will draw them from different reaction points – I’ve marked them by red circles. But in general this moment does not change overall picture – area around 1.80 will be rock hard resistance.
Second moment is 1.70-1.71 historical support/resistance line and market has tested it already. It stands accross the chart as demarcation line. So, conclusion here is bullish context with upside potential 1.77-1.80 area. Also, on monthly chart you can easily see how market forms higher lows, while continues struggle with the same resistance around 1.68-1.70. This also points on growing bullish power and increases probability of upward breakout. To better estimate final target and potential downward reversal point we will have to look for lower time frames, patterns that will be formed there.
After market wil hit upward target area we should turn to downward trend, since previous bearish momentum was unstoppable solid and lead to some downward continuation (as final 5th wave down) as it was pictured on 2011 chart.
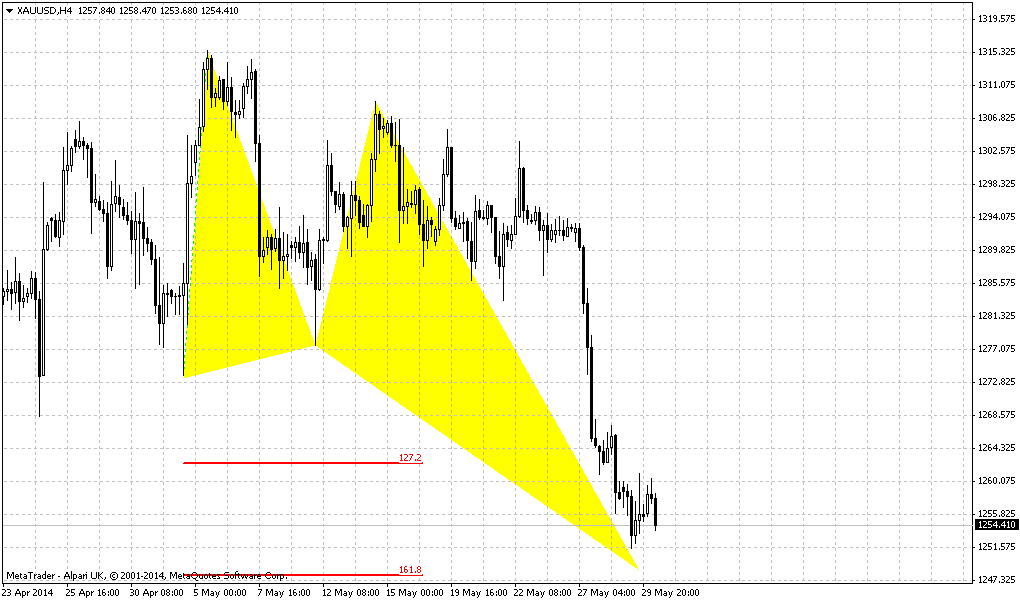
Weekly
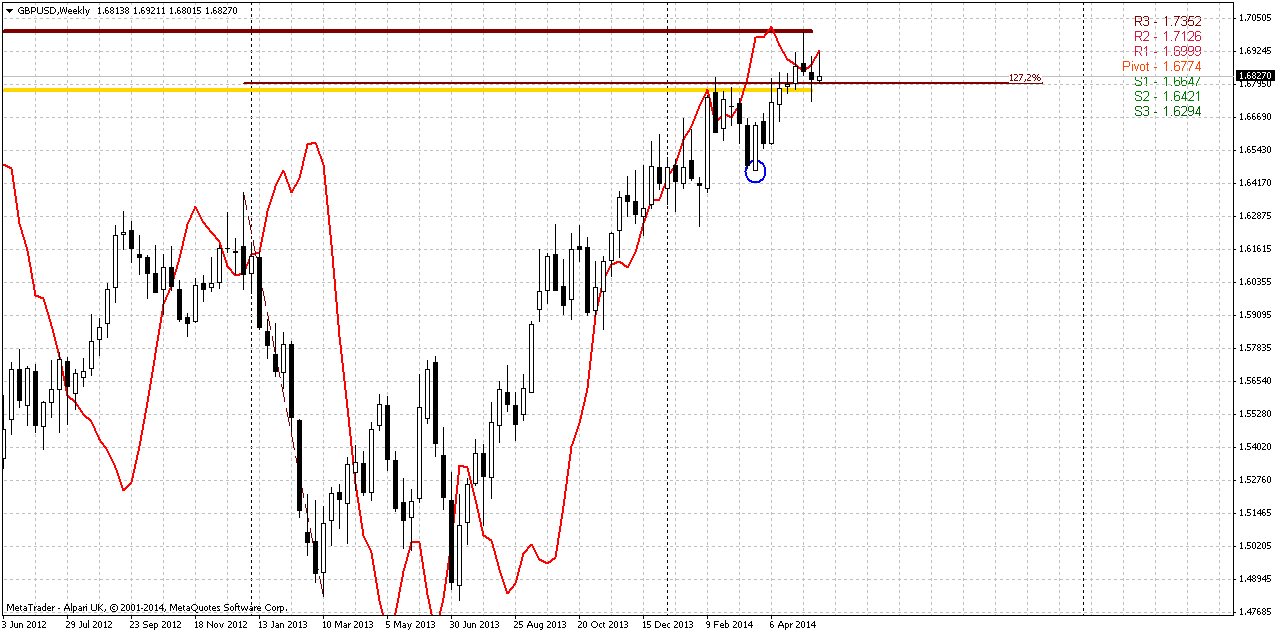
On weekly chart market has not completed any clear pattern. We probably could treat it as butterfly “Sell”, but unfortunately second bottom is 15 pips lower than the bottom of initial swing of possible Butterfly. Anyway we can apply just extension of this swing that creates resistance. Despite that market has not visible targets around 1.69-1.70 – we’ve said on monthly chart that this is strong resistance area and market already feels this. We have divergence, we have multiple bearish stop grabbers that suggest retracement at least to 1.64 area. If you’re bullish and search possibility for long entry – wait at some retracement, or failure of grabbers that were formed recently.
In general, weekly chart shows no breaking of bullish context – price stands above the pivot and has tested MPR1, but hints on possible retracement down on next week due reashing of solid resistance.
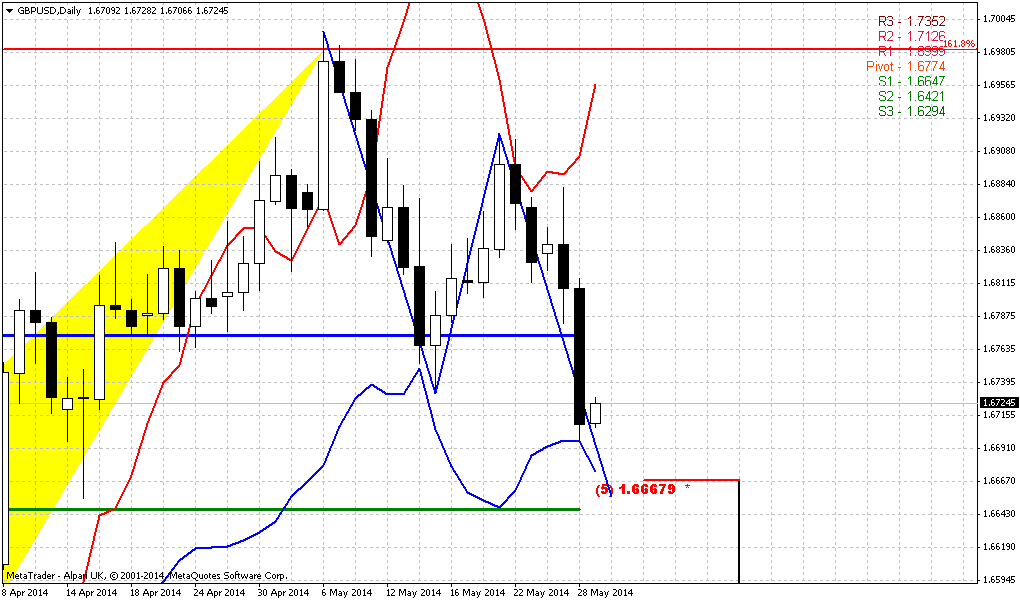
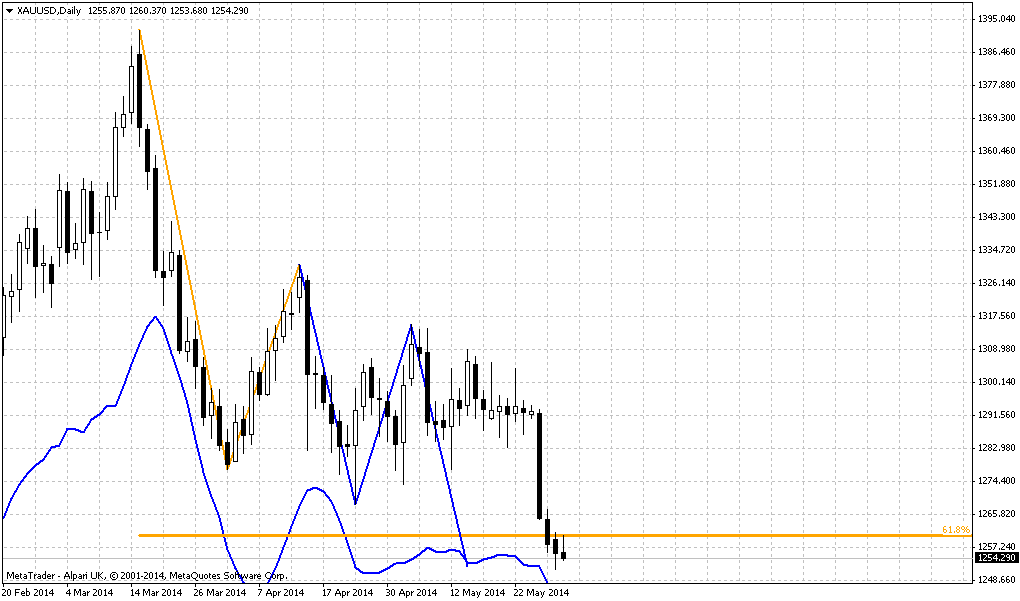
Daily
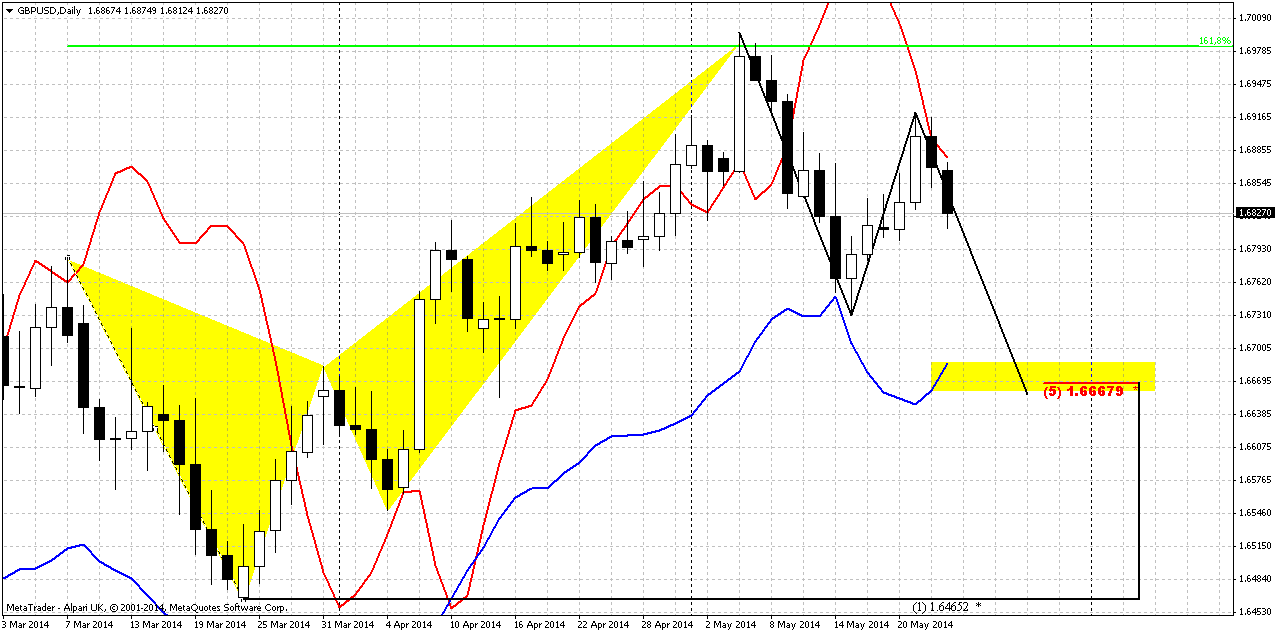
This is most valuable chart for short-term trading. Trend holds bearish. We see the reaction on resistance that is supported by appearing butterfly “sell”. The first stage of downward action will take shape of AB=CD probably. Interestingly that we have here another grabber that suggests taking out of 1.6730 lows and reduce chances on appearing another butterfly “sell”
Our major target here stands at 1.6665 area – Agreement with daily oversold.
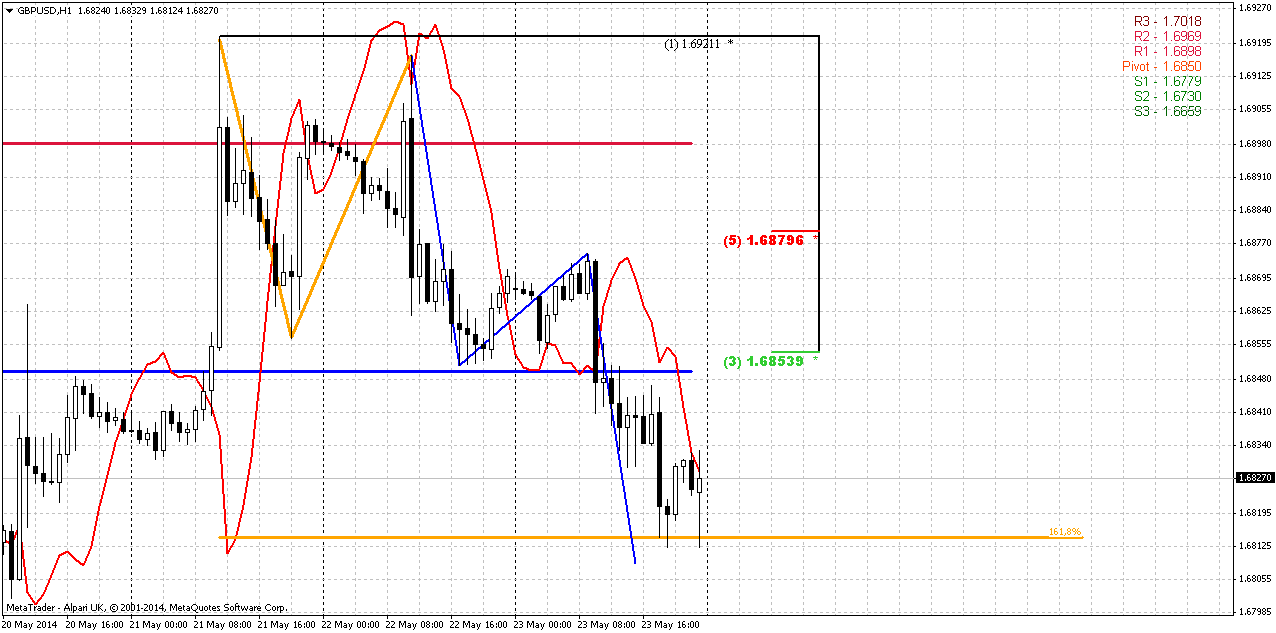
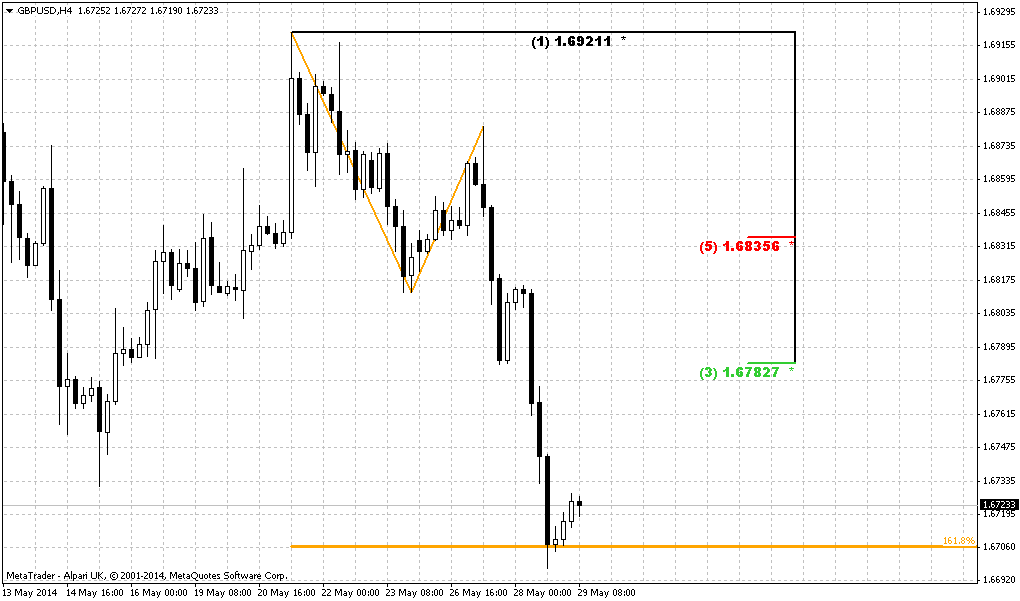
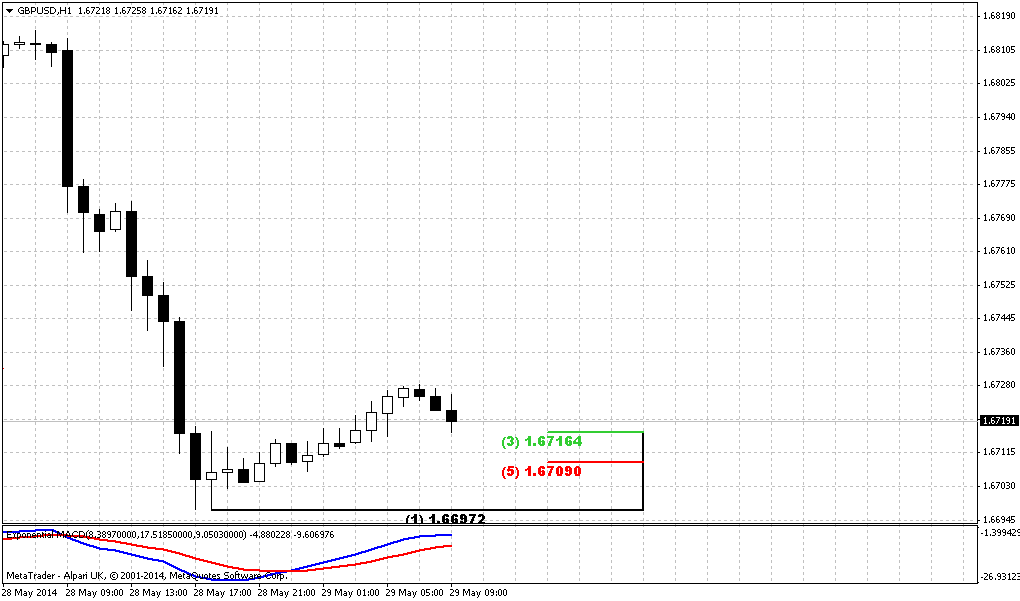
1-hour
Hourly chart shows that we could get excellent chance for short entry in the beginning of the week. As market has hit two different targets – 1.618 of initial AB=CD (orange) and almost has hit AB=CD target (blue) – GBP could turn to minor retracement up. As a target of upward action we probably can use 1.6850 area – Fib level and WPP. Small bearish grabber confirms shy downward action and final reaching of AB=CD target before retracement will start.
Conclusion:
On long-term charts price has started to show signs of upward continuation and it could point us direction for long period and extended targets.
Meantime, as market has hit solid resistance level, some retracement could happen, at least daily chart shows valuable patterns. Thus, our trading plan suggests:
1. Wait a retracement up. First possible area is WPP and Fib level around 1.6850;
2. Try to take short position with target 1.6665.
We will try to make some update within a week if situation will skew from our expectations. Avoid any strong and fast action against you. If this will happen – do not take any position.
The technical portion of Sive's analysis owes a great deal to Joe DiNapoli's methods, and uses a number of Joe's proprietary indicators. Please note that Sive's analysis is his own view of the market and is not endorsed by Joe DiNapoli or any related companies.
I will not repeat fundamental part here, guys, since I’ve posted it in EUR weekly research. As Gold market has not shown any solid action on previous week, I’ve decided to take a look at GBP.
B]Technical[/B]
As we noted in previous GBP research, on February, we have some intriguing moment – our long term analysis that we’ve made in Forex Military School in 2011. Here is the chart:
As you can see, we have suggested downward reversal as 5th wave of Elliot waves pattern after upward breakout of initial retracement’s top. Although market has formed more swings on the way to final upward action – this is not very important. The major important thing here is a final move up to final target of retracement before downward reversal. And now we stand precisely at the eve of this action. Better to say that this move already has started, and market shows some progress with upward action since our previous research.
Now let’s shift to modern chart.
Market has passed through minor AB-CD 0.618 extension. It means that next target is 100% extension. Trend holds bullish here. Right now market is forming different patterns that point on the same level. They are AB-CD that is based on initial ABC swing of this retracement and butterfly “sell” that has 1.27 reversal target in the same area – around 1.77-1.7750. This level also will be monthly overbought and major 5/8 Fib resistance. In fact you can get three different Fib levels that will envelop 1.77 area, if you will draw them from different reaction points – I’ve marked them by red circles. But in general this moment does not change overall picture – area around 1.80 will be rock hard resistance.
Second moment is 1.70-1.71 historical support/resistance line and market has tested it already. It stands accross the chart as demarcation line. So, conclusion here is bullish context with upside potential 1.77-1.80 area. Also, on monthly chart you can easily see how market forms higher lows, while continues struggle with the same resistance around 1.68-1.70. This also points on growing bullish power and increases probability of upward breakout. To better estimate final target and potential downward reversal point we will have to look for lower time frames, patterns that will be formed there.
After market wil hit upward target area we should turn to downward trend, since previous bearish momentum was unstoppable solid and lead to some downward continuation (as final 5th wave down) as it was pictured on 2011 chart.
Weekly
On weekly chart market has not completed any clear pattern. We probably could treat it as butterfly “Sell”, but unfortunately second bottom is 15 pips lower than the bottom of initial swing of possible Butterfly. Anyway we can apply just extension of this swing that creates resistance. Despite that market has not visible targets around 1.69-1.70 – we’ve said on monthly chart that this is strong resistance area and market already feels this. We have divergence, we have multiple bearish stop grabbers that suggest retracement at least to 1.64 area. If you’re bullish and search possibility for long entry – wait at some retracement, or failure of grabbers that were formed recently.
In general, weekly chart shows no breaking of bullish context – price stands above the pivot and has tested MPR1, but hints on possible retracement down on next week due reashing of solid resistance.
Daily
This is most valuable chart for short-term trading. Trend holds bearish. We see the reaction on resistance that is supported by appearing butterfly “sell”. The first stage of downward action will take shape of AB=CD probably. Interestingly that we have here another grabber that suggests taking out of 1.6730 lows and reduce chances on appearing another butterfly “sell”
Our major target here stands at 1.6665 area – Agreement with daily oversold.
1-hour
Hourly chart shows that we could get excellent chance for short entry in the beginning of the week. As market has hit two different targets – 1.618 of initial AB=CD (orange) and almost has hit AB=CD target (blue) – GBP could turn to minor retracement up. As a target of upward action we probably can use 1.6850 area – Fib level and WPP. Small bearish grabber confirms shy downward action and final reaching of AB=CD target before retracement will start.
Conclusion:
On long-term charts price has started to show signs of upward continuation and it could point us direction for long period and extended targets.
Meantime, as market has hit solid resistance level, some retracement could happen, at least daily chart shows valuable patterns. Thus, our trading plan suggests:
1. Wait a retracement up. First possible area is WPP and Fib level around 1.6850;
2. Try to take short position with target 1.6665.
We will try to make some update within a week if situation will skew from our expectations. Avoid any strong and fast action against you. If this will happen – do not take any position.
The technical portion of Sive's analysis owes a great deal to Joe DiNapoli's methods, and uses a number of Joe's proprietary indicators. Please note that Sive's analysis is his own view of the market and is not endorsed by Joe DiNapoli or any related companies.
Last edited:
")