Sive Morten
Special Consultant to the FPA
- Messages
- 18,669
Fundamentals
Last week gold mostly was driven by its own and we've got no serious external driving factors. As we've estimated yesterday, it seems that Fed policy also hardly will make any impact on Gold market until mid June. Banking crisis seems calm down a bit. Although demand for liquidity remains high but it stands stable around $400 Bln, and with the period of 1Q taxt collection under way - here is also should be nothing dangerous from this side by far. But there is one factor that unexpectedly spinning up and getting 2nd breath - debt ceil topic. It seems that nobody intends to close this theatre of absurd and serious talks about technical default become wide and louder. Even more - bond market now starts seriously treat the possible default. And the fact that all around think that this is just a game, named "debt ceil" - political game, economical game etc., with having thought "they anyway will rise it" somewhere deep in the mind, this makes it even more uncertain, and, hence - risky. And as closer we're going to come to the June as nervousness will be higher.
Market overview
Gold reversed course to slip below the key $2,000 level on Monday, pressured by a stronger dollar and higher Treasury yields, while investors looked for cues on whether the market will see a 'one and done' rate hike by the U.S. Federal Reserve in May.
Economic data last week began to fill in the portrait of a U.S. economy that is losing momentum, intensifying bets that the Fed's next increase will be its last. The CME FedWatch tool shows markets are pricing in an 86% chance of a 25-bp hike in May, followed by 2-in-3 chances of a pause in June. The $1,980-$2,000 range is a promising support zone for bullion, said Carlo Alberto De Casa, external analyst at Kinesis Money.
Jewellery and precious metals consumption in China soared 37.4% in March from a year earlier underpinning a 13.6% jump for the quarter and topping the list of items that stoked a surge in first-quarter retail sales, official data showed on Tuesday. China's economy grew at a faster-than-expected pace in the first quarter, with retail sales rising 10.6%, beating forecasts for a 7.4% increase by a large margin.
The interest in precious metals is a worrying indicator that China's efforts to revive its economy via domestic spending, after years of strict COVID curbs, may not be working. Shying from risk, Chinese families are saving more. Households savings grew by 9.9 trillion yuan in the January-March period, after rising a record 17.8 trillion yuan in 2022. In 2021, they grew by 9.9 trillion yuan.
St. Louis Fed President James Bullard said the Fed should continue raising rates as recent data shows inflation remains persistent, while Atlanta Fed President Raphael Bostic said the Fed will likely need to hold steady for an extended period to lower inflation after one more rate hikes.
Weekly U.S. jobless claims edged up last week, suggesting the labor market was gradually slowing, while another set of data showed fewer existing home sales and much lower-than-forecast factory activity in the mid-Atlantic region.
Gold prices fell sharply on Friday and were headed for their worst week in eight as hawkish remarks by U.S. Federal Reserve officials through the week bolstered bets for at least one more interest rate hike and buoyed the dollar. Bullion has shed about 1.2% so far this week, pressured by the dollar's gains overall, which made bullion more expensive for overseas buyers.
Fed officials said on Thursday inflation remains "far above" the central bank's 2% target. Fed Governor Michelle Bowman reiterated that more work needs to be done to tame inflation.
Gold was also pressured by an S&P Global survey that showed U.S. business activity accelerated to an 11-month high in April, which was at odds with growing signs that higher interest rates were cooling demand.
DEBT CEIL ISSUE
So, the American bond market began to seriously lay down the US default - take a look at this chart. Since default now is expected around June, 1-month (i.e. May yield) remains low while 3-month yield rate is almost 1.5% higher:

Historically, the yield of 1-month and 3-month treasures is almost identical however, since April, a massive correlation has begun between them - now the yield on 1-month is 3.97%, and on 3-month - already 5.30% .
The event that lies between the 1- and 3-month treasuries and due to which such a slant occurred is another discussion in the US Congress on increasing the national debt, where the Congress will have to decide whether the States will increase the national debt ceiling or default. The U.S. is expected to hit the ceiling from July to September. Usually this is a regular procedure that causes panic in the media and does not lead to any market consequences - but this time the market estimates the probability of a US default as non-zero.
About 35 percent of experts said they expected the announcement of a US default on treasury obligations. Analysts interviewed more than 2.5 thousand participants of the spring meetings of the International Monetary Fund (IMF) and the World Bank. At the same time, the speakers of these events estimated the probability of default from 10 to 15 percent.
JPMorgan expects the U.S. debt ceiling to become an issue as early as next month with the Wall Street bank ascribing a "non-trivial risk" of a technical default on U.S. Treasuries. In a note published to clients late on Wednesday, JPMorgan said it expected both the debate over the debt ceiling as well as the one on the federal funding bill to run "dangerously close" to their final deadlines. The bank said its U.S. rates strategy team expects the Treasury could run out of available resources by the middle of August.
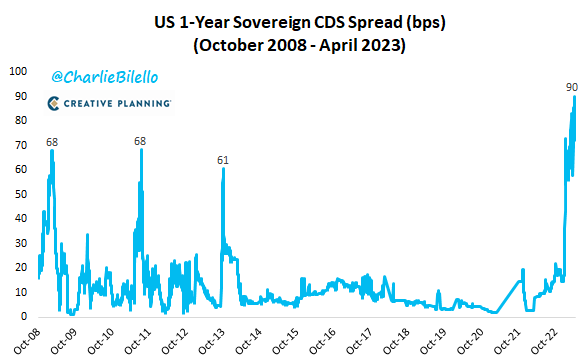
Treasury Secretary Janet Yellen is expected in the next few days to revise the X-date - or the date by which the federal government can no longer meet all its obligations in full and on time absent actions by Congress - which is currently early June. U.S. credit default swaps, market-based gauges of the risk of a default, this month hit their highest level since 2012
The US could hit the debt ceiling deadline in June, sooner than expected amid weak tax collections, Goldman Sachs says as well. While data are very preliminary, "weak" tax collections so far in April point to an increased probability that the debt-limit deadline will be reached in the first half of June, Jan Hatzius, Goldman's chief economist and head of global investment research, said in a note published Tuesday.
There are reasons to believe that this time could play out differently, starting with the chaos in Mr. McCarthy’s caucus — and new warnings that lawmakers might have less time to raise the $31.4 trillion limit than previously thought. The next few weeks will more precisely determine how quickly the government will exhaust its ability to pay bondholders, employees, Social Security recipients and everyone else it sends money to on a regular basis. That’s because data on the government’s tax receipts for the year will come into sharper focus after Tuesday’s deadline for people to file individual income tax returns for 2022.
Republicans are refusing to raise the borrowing cap unless Mr. Biden agrees to reduce government spending and slow the growth of the national debt, a position that risks plunging the United States into recession if the Treasury Department runs out of money to pay all its bills on time. THe major idea of Republicans (and speaker McCarthy) is to raise ceil for $1.5 Trln but to cut 1/3 of government spending. This should give circa 1 year to take a breath.
Don’t panic yet: Experts at the Bipartisan Policy Center, a think tank that also specializes in predicting the X-date, cautioned Tuesday that it’s still too early to make any predictions about the deadline based on the preliminary data pouring in about April tax receipts. The think tank has previously cautioned, however, that Congress could be facing a debt limit crunch in June if tax season is a bust.
Thus, the messing around the ceiling of the national debt and at the same time the default of the US, meanwhile, continues. Speaker of Congress McCarthy presented a plan to raise the US national debt ceiling by $1.5 trillion, which, given the current appetite, will be enough for about a year and a half. Maybe two. This, of course, provided that they do not cut the social network. It turns out that we live with a ceiling for a year and a half, then again we bargain for a new one for half a year? "day-three" mode...
The markets, following Musk, began to get nervous, and then Morgan Stanley loudly announced a credit crisis, and not to say that it was completely out of nowhere.
Morgan Stanley announced that a credit crunch had begun. The yield on 3-month US Treasury bills hit a new post-2007 high of 5.06%. Banks, on the other hand, had the largest contraction in treasury holdings on record.

In general, the farce does not even think of folding. The bad thing here is that "fat" can suddenly squeeze between fingers and drop: either play too much and not agree, or in the heat of political struggle inadvertently collapse the system, which can no longer be rebuilt. The low adequacy of the Western politicum was fully shown by "hellish sanctions".
And, as we've touched already interest rates subject - here is another issue. As Bloomberg reported yesterday, referring to a study by Barclays Plc, only in the first quarter of this year, bonds worth $11.4 billion were downgraded to "junk". This is more than in the whole of 2021 ($9 billion). The process of falling corporate angels began to accelerate against the background of tightening monetary policy. This is not surprising: it is one thing to finance a business for years at a time of near–zero percent, and quite another at 5%.
Companies that have been accustomed for more than a decade to free (if not imposed) money, with such a sharp change in the financial climate, can easily not only lose ratings, but also go bankrupt. Moody's said yesterday that it expects corporate defaults to more than double over the course of the year, to 5.6% from 2.7% now.
Last year, when the Fed embarked on the sharpest rate hike in 40 years, the volume of downgraded securities rose to $20 billion. But in just one quarter of this year, revisions have already been made by almost 60% of this figure. Then things will go even faster: Barclays predicts this year the fall of "angels" in the amount of $ 60 billion to $ 80 billion. This is the maximum since the recession and more than, for example, in 2008. But it is possible that Barclays is too optimistic.
But there is also the impact on the economy not of the Fed itself, but of the banking crisis associated with its efforts. The behavior of credit institutions has changed dramatically – they are reducing lending. According to the Fed, the total volume of loans has decreased by about $95 billion since mid-March. And the tightening of credit conditions leads to an even greater reduction in ratings.
Business financing risks literally collapsing. And the first surveys show that entrepreneurs have already felt climate change for themselves. All this together confidently pushes the economy towards recession, and that, in turn, will lead to a new wave of falling ratings and tightening financial conditions.
Although it might sound a bit cynic, but rate cut to "junk" level due worsen statement leads to cut of banking loan limits for the company. This, in turn could lead to contraction of company business or even bankruptcy. If it will be done with few more or less big companies, then the "fear of recession" will be confirmed and Fed could get the reason for policy change - "tail wagging the dog".
Conclusion:
It seems everything is breaking apart, guys, and even faster than we thought initially. With tremendous speed of US Dollar washing out of international trading and global reserves. In 2022, the USD’s share collapsed sharply to what we calculate to be 47 percent of total global reserves. This 8 percent decline in one year is exceptional, equivalent to 10 times the average annual pace of erosion in the USD’s market share in the prior years.

Currency analyst Stephen John accused the United States of bringing the collapse of the dollar closer by using the global financial system against Russia (and China now). His words are quoted by the Financial Times newspaper. The expert noted that the dollar reduced its position as a reserve currency after Washington decided to demonstrate its power. Its share among the official world currencies has decreased from 73 percent in 2001 to 47 percent in 2023. Jack pointed out that the dollar began to lose its status much faster than previously thought.
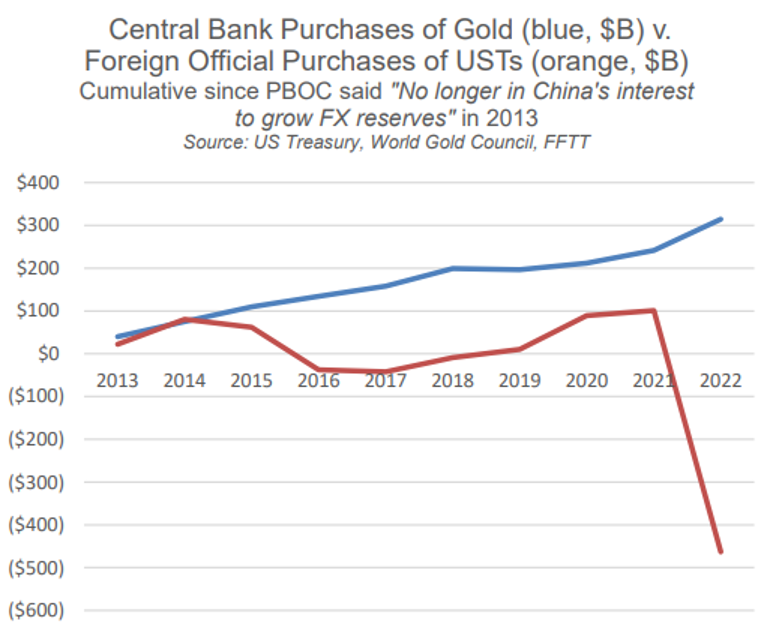
So rverything goes so bad that the US seriously starts thinking to re-wire Russia to SWIFT system. Sanctions pressure and the "withdrawal" of money from Russia have hurt the status of the dollar. More and more countries are no longer considering it as a reliable investment and are switching to settlements in their own currencies, buying gold and abandoning state bonds of the States. Thus, Egypt's investments have halved, Indonesia — by 1.9 times, and Afghanistan — by 3.5. It turned out that no one wants to risk their reserves.
Many countries have regarded the actions of the United States as a way to "legally steal," so Americans want to fix the situation without harming their own reputation. The UN option was chosen. The official representative of the Secretary General of the organization, Stefan Dujarric, said that in order to fulfill the grain deal, negotiations are underway to reconnect Russian banks to the international payment system. He noted that the organization cannot put pressure on the countries that imposed restrictions, but the exclusion of Russian financial institutions greatly complicates the execution of the transaction. Therefore, active negotiations are underway with those responsible for SWIFT...
As Hemingway said, you go bankrupt first Gradually and then Suddenly. For us normal mortals, when ends don’t meet we need to either increase income or reduce expenses. But that is a formula that governments seldom practice and certainly not in the last 50+ years. They only know one solution which is to create more debt in order to solve their debt problem. That obviously sounds absurd but it is the only way a government can buy votes and stay in power.
Again, the consequences at the very end of a credit cycle will clearly be cataclysmic. What will rapidly follow is:
Central Bankers are gold’s best friend. Throughout history they have always destroyed the value of money and thus supportive for gold. And today when the biggest money printing in history is about to start, holding physical gold outside the banking system is a SINE QUA NON (absolutely essential). Please remember to hold it in physical form in a safe jurisdiction and outside a fractured financial system.
I nearest 1-2 months overall background should be positive for the gold. With the all other things remain equal - we have priced-in 25 b.p. Fed rate change expectation and rush around Fed debt ceil that will keep markets nervous and support gold demand. Besides, as harder turmoil is now as more investors will decide to not deal with it in the future. In general, it corresponds to our technical ceil of 2060-2066$ area that we've mentioned before.
We suggest that Gold could turn to deeper retracement, if 14th June Fed meeting will break markets expectations of rate change pause and Fed will raise it again. Which we think is highly likely. But the retracement will not break the major trend and mostly will be emotional, due to sentiment break. As high inflation as liquidity problems remains, and they should not let gold to change the trend now.
Last week gold mostly was driven by its own and we've got no serious external driving factors. As we've estimated yesterday, it seems that Fed policy also hardly will make any impact on Gold market until mid June. Banking crisis seems calm down a bit. Although demand for liquidity remains high but it stands stable around $400 Bln, and with the period of 1Q taxt collection under way - here is also should be nothing dangerous from this side by far. But there is one factor that unexpectedly spinning up and getting 2nd breath - debt ceil topic. It seems that nobody intends to close this theatre of absurd and serious talks about technical default become wide and louder. Even more - bond market now starts seriously treat the possible default. And the fact that all around think that this is just a game, named "debt ceil" - political game, economical game etc., with having thought "they anyway will rise it" somewhere deep in the mind, this makes it even more uncertain, and, hence - risky. And as closer we're going to come to the June as nervousness will be higher.
Market overview
Gold reversed course to slip below the key $2,000 level on Monday, pressured by a stronger dollar and higher Treasury yields, while investors looked for cues on whether the market will see a 'one and done' rate hike by the U.S. Federal Reserve in May.
A stronger U.S. dollar and the rise in bond yields, along with some profit-taking from recent gains, are putting pressure on gold, said Jim Wyckoff, senior analyst at Kitco Metals. But the trend for gold is still up, and "I wouldn't be surprised to see gold hit a new record high in the coming weeks," added Wyckoff.
Economic data last week began to fill in the portrait of a U.S. economy that is losing momentum, intensifying bets that the Fed's next increase will be its last. The CME FedWatch tool shows markets are pricing in an 86% chance of a 25-bp hike in May, followed by 2-in-3 chances of a pause in June. The $1,980-$2,000 range is a promising support zone for bullion, said Carlo Alberto De Casa, external analyst at Kinesis Money.
Jewellery and precious metals consumption in China soared 37.4% in March from a year earlier underpinning a 13.6% jump for the quarter and topping the list of items that stoked a surge in first-quarter retail sales, official data showed on Tuesday. China's economy grew at a faster-than-expected pace in the first quarter, with retail sales rising 10.6%, beating forecasts for a 7.4% increase by a large margin.
The interest in precious metals is a worrying indicator that China's efforts to revive its economy via domestic spending, after years of strict COVID curbs, may not be working. Shying from risk, Chinese families are saving more. Households savings grew by 9.9 trillion yuan in the January-March period, after rising a record 17.8 trillion yuan in 2022. In 2021, they grew by 9.9 trillion yuan.
"Consumer interest in precious metals (comes) as a potential safe haven and inflation hedge, as many consumers do not expect low inflation in China to continue," said Ben Cavender, managing director at China Market Research Group. "Economic fundamentals, risk aversion and the recovery of domestic consumption all drive the investment demand for jewellery and precious metals," said Pang Xichun, research director at Nanjing RiskHunt Investment Management Co.
"What gold traders really care about is how fast do we get the (rate) cuts. The market has already priced for cutting cycle to begin even as early as this summer," said Daniel Ghali, commodity strategist at TD Securities.
St. Louis Fed President James Bullard said the Fed should continue raising rates as recent data shows inflation remains persistent, while Atlanta Fed President Raphael Bostic said the Fed will likely need to hold steady for an extended period to lower inflation after one more rate hikes.
"This week has had some aggressive Fed speak from its speakers and a continuation of that narrative could give the greenback a boost, leaving gold exposed on the downside," DailyFX analyst Warren Venketas wrote in a note.
"Once gold breached that $2,000 mark, there were a lot of stop losses that were triggered," said Phillip Streible, chief market strategist at Blue Line Futures in Chicago. "Anytime you get earnings, you get a lot of people chasing individual stocks and that could also cause them to not invest so much in metal."
Rate-hike expectations for the (Fed's) May meeting have risen, which has pressured gold back below $2,000, at least in the short term, said Standard Chartered analyst Suki Cooper.
Weekly U.S. jobless claims edged up last week, suggesting the labor market was gradually slowing, while another set of data showed fewer existing home sales and much lower-than-forecast factory activity in the mid-Atlantic region.
"We saw a disastrous Philly Fed and jobless claims continuing to head higher, so the economy is weakening, some parts more than others," said Edward Moya, senior market analyst at OANDA. "For gold to make that run back to record highs, you need the June rate hike completely off the table," Moya added.
Gold prices fell sharply on Friday and were headed for their worst week in eight as hawkish remarks by U.S. Federal Reserve officials through the week bolstered bets for at least one more interest rate hike and buoyed the dollar. Bullion has shed about 1.2% so far this week, pressured by the dollar's gains overall, which made bullion more expensive for overseas buyers.
Fed officials said on Thursday inflation remains "far above" the central bank's 2% target. Fed Governor Michelle Bowman reiterated that more work needs to be done to tame inflation.
While a rate hike will initially dull gold's appeal, an eventual pause will send gold to its recent all-time highs, said Bob Haberkorn, senior market strategist at RJO Futures, adding that "the Fed has a breaking point where they can't go anymore on rates without doing significant damage to the economy."
Gold was also pressured by an S&P Global survey that showed U.S. business activity accelerated to an 11-month high in April, which was at odds with growing signs that higher interest rates were cooling demand.
DEBT CEIL ISSUE
So, the American bond market began to seriously lay down the US default - take a look at this chart. Since default now is expected around June, 1-month (i.e. May yield) remains low while 3-month yield rate is almost 1.5% higher:
Historically, the yield of 1-month and 3-month treasures is almost identical however, since April, a massive correlation has begun between them - now the yield on 1-month is 3.97%, and on 3-month - already 5.30% .
The event that lies between the 1- and 3-month treasuries and due to which such a slant occurred is another discussion in the US Congress on increasing the national debt, where the Congress will have to decide whether the States will increase the national debt ceiling or default. The U.S. is expected to hit the ceiling from July to September. Usually this is a regular procedure that causes panic in the media and does not lead to any market consequences - but this time the market estimates the probability of a US default as non-zero.
About 35 percent of experts said they expected the announcement of a US default on treasury obligations. Analysts interviewed more than 2.5 thousand participants of the spring meetings of the International Monetary Fund (IMF) and the World Bank. At the same time, the speakers of these events estimated the probability of default from 10 to 15 percent.
JPMorgan expects the U.S. debt ceiling to become an issue as early as next month with the Wall Street bank ascribing a "non-trivial risk" of a technical default on U.S. Treasuries. In a note published to clients late on Wednesday, JPMorgan said it expected both the debate over the debt ceiling as well as the one on the federal funding bill to run "dangerously close" to their final deadlines. The bank said its U.S. rates strategy team expects the Treasury could run out of available resources by the middle of August.
"Signs of stress typically start in the T-bill market 2-3 months before the X-date given money market funds (MMF), which are large holders of T-bills, will begin to more actively advertise that they don't hold any bills that mature over those dates," JPMorgan said.
Treasury Secretary Janet Yellen is expected in the next few days to revise the X-date - or the date by which the federal government can no longer meet all its obligations in full and on time absent actions by Congress - which is currently early June. U.S. credit default swaps, market-based gauges of the risk of a default, this month hit their highest level since 2012
The US could hit the debt ceiling deadline in June, sooner than expected amid weak tax collections, Goldman Sachs says as well. While data are very preliminary, "weak" tax collections so far in April point to an increased probability that the debt-limit deadline will be reached in the first half of June, Jan Hatzius, Goldman's chief economist and head of global investment research, said in a note published Tuesday.
There are reasons to believe that this time could play out differently, starting with the chaos in Mr. McCarthy’s caucus — and new warnings that lawmakers might have less time to raise the $31.4 trillion limit than previously thought. The next few weeks will more precisely determine how quickly the government will exhaust its ability to pay bondholders, employees, Social Security recipients and everyone else it sends money to on a regular basis. That’s because data on the government’s tax receipts for the year will come into sharper focus after Tuesday’s deadline for people to file individual income tax returns for 2022.
Republicans are refusing to raise the borrowing cap unless Mr. Biden agrees to reduce government spending and slow the growth of the national debt, a position that risks plunging the United States into recession if the Treasury Department runs out of money to pay all its bills on time. THe major idea of Republicans (and speaker McCarthy) is to raise ceil for $1.5 Trln but to cut 1/3 of government spending. This should give circa 1 year to take a breath.
Don’t panic yet: Experts at the Bipartisan Policy Center, a think tank that also specializes in predicting the X-date, cautioned Tuesday that it’s still too early to make any predictions about the deadline based on the preliminary data pouring in about April tax receipts. The think tank has previously cautioned, however, that Congress could be facing a debt limit crunch in June if tax season is a bust.
Thus, the messing around the ceiling of the national debt and at the same time the default of the US, meanwhile, continues. Speaker of Congress McCarthy presented a plan to raise the US national debt ceiling by $1.5 trillion, which, given the current appetite, will be enough for about a year and a half. Maybe two. This, of course, provided that they do not cut the social network. It turns out that we live with a ceiling for a year and a half, then again we bargain for a new one for half a year? "day-three" mode...
The markets, following Musk, began to get nervous, and then Morgan Stanley loudly announced a credit crisis, and not to say that it was completely out of nowhere.
Morgan Stanley announced that a credit crunch had begun. The yield on 3-month US Treasury bills hit a new post-2007 high of 5.06%. Banks, on the other hand, had the largest contraction in treasury holdings on record.
In general, the farce does not even think of folding. The bad thing here is that "fat" can suddenly squeeze between fingers and drop: either play too much and not agree, or in the heat of political struggle inadvertently collapse the system, which can no longer be rebuilt. The low adequacy of the Western politicum was fully shown by "hellish sanctions".
And, as we've touched already interest rates subject - here is another issue. As Bloomberg reported yesterday, referring to a study by Barclays Plc, only in the first quarter of this year, bonds worth $11.4 billion were downgraded to "junk". This is more than in the whole of 2021 ($9 billion). The process of falling corporate angels began to accelerate against the background of tightening monetary policy. This is not surprising: it is one thing to finance a business for years at a time of near–zero percent, and quite another at 5%.
Companies that have been accustomed for more than a decade to free (if not imposed) money, with such a sharp change in the financial climate, can easily not only lose ratings, but also go bankrupt. Moody's said yesterday that it expects corporate defaults to more than double over the course of the year, to 5.6% from 2.7% now.
Last year, when the Fed embarked on the sharpest rate hike in 40 years, the volume of downgraded securities rose to $20 billion. But in just one quarter of this year, revisions have already been made by almost 60% of this figure. Then things will go even faster: Barclays predicts this year the fall of "angels" in the amount of $ 60 billion to $ 80 billion. This is the maximum since the recession and more than, for example, in 2008. But it is possible that Barclays is too optimistic.
But there is also the impact on the economy not of the Fed itself, but of the banking crisis associated with its efforts. The behavior of credit institutions has changed dramatically – they are reducing lending. According to the Fed, the total volume of loans has decreased by about $95 billion since mid-March. And the tightening of credit conditions leads to an even greater reduction in ratings.
Business financing risks literally collapsing. And the first surveys show that entrepreneurs have already felt climate change for themselves. All this together confidently pushes the economy towards recession, and that, in turn, will lead to a new wave of falling ratings and tightening financial conditions.
Although it might sound a bit cynic, but rate cut to "junk" level due worsen statement leads to cut of banking loan limits for the company. This, in turn could lead to contraction of company business or even bankruptcy. If it will be done with few more or less big companies, then the "fear of recession" will be confirmed and Fed could get the reason for policy change - "tail wagging the dog".
Conclusion:
It seems everything is breaking apart, guys, and even faster than we thought initially. With tremendous speed of US Dollar washing out of international trading and global reserves. In 2022, the USD’s share collapsed sharply to what we calculate to be 47 percent of total global reserves. This 8 percent decline in one year is exceptional, equivalent to 10 times the average annual pace of erosion in the USD’s market share in the prior years.
Currency analyst Stephen John accused the United States of bringing the collapse of the dollar closer by using the global financial system against Russia (and China now). His words are quoted by the Financial Times newspaper. The expert noted that the dollar reduced its position as a reserve currency after Washington decided to demonstrate its power. Its share among the official world currencies has decreased from 73 percent in 2001 to 47 percent in 2023. Jack pointed out that the dollar began to lose its status much faster than previously thought.
So rverything goes so bad that the US seriously starts thinking to re-wire Russia to SWIFT system. Sanctions pressure and the "withdrawal" of money from Russia have hurt the status of the dollar. More and more countries are no longer considering it as a reliable investment and are switching to settlements in their own currencies, buying gold and abandoning state bonds of the States. Thus, Egypt's investments have halved, Indonesia — by 1.9 times, and Afghanistan — by 3.5. It turned out that no one wants to risk their reserves.
Many countries have regarded the actions of the United States as a way to "legally steal," so Americans want to fix the situation without harming their own reputation. The UN option was chosen. The official representative of the Secretary General of the organization, Stefan Dujarric, said that in order to fulfill the grain deal, negotiations are underway to reconnect Russian banks to the international payment system. He noted that the organization cannot put pressure on the countries that imposed restrictions, but the exclusion of Russian financial institutions greatly complicates the execution of the transaction. Therefore, active negotiations are underway with those responsible for SWIFT...
As Hemingway said, you go bankrupt first Gradually and then Suddenly. For us normal mortals, when ends don’t meet we need to either increase income or reduce expenses. But that is a formula that governments seldom practice and certainly not in the last 50+ years. They only know one solution which is to create more debt in order to solve their debt problem. That obviously sounds absurd but it is the only way a government can buy votes and stay in power.
Again, the consequences at the very end of a credit cycle will clearly be cataclysmic. What will rapidly follow is:
- CURRENCY DEBASEMENT LEADING TO COLLAPSE
- HIGH INFLATION LEADING TO HYPERINFLATION
- FOOD AND ENERGY SHORTAGES
- DEBT DEFAULTS LEADING TO DEBT COLLAPSE
- IMPLOSION OF BUBBLE ASSETS (stocks, bonds, property) in real terms – Gold
- FAILURE OF FINANCIAL SYSTEM
- POLITICAL & SOCIAL TURMOIL – CIVIL UNREST
- GEOPOLITICAL PROBLEMS
- THE FALL OF THE WEST AND RISE OF THE EAST AND SOUTH
Central Bankers are gold’s best friend. Throughout history they have always destroyed the value of money and thus supportive for gold. And today when the biggest money printing in history is about to start, holding physical gold outside the banking system is a SINE QUA NON (absolutely essential). Please remember to hold it in physical form in a safe jurisdiction and outside a fractured financial system.
I nearest 1-2 months overall background should be positive for the gold. With the all other things remain equal - we have priced-in 25 b.p. Fed rate change expectation and rush around Fed debt ceil that will keep markets nervous and support gold demand. Besides, as harder turmoil is now as more investors will decide to not deal with it in the future. In general, it corresponds to our technical ceil of 2060-2066$ area that we've mentioned before.
We suggest that Gold could turn to deeper retracement, if 14th June Fed meeting will break markets expectations of rate change pause and Fed will raise it again. Which we think is highly likely. But the retracement will not break the major trend and mostly will be emotional, due to sentiment break. As high inflation as liquidity problems remains, and they should not let gold to change the trend now.