Sive Morten
Special Consultant to the FPA
- Messages
- 18,673
Fundamentals
Weekly Gold Tading Report prepared by Sive Morten exclusively for ForexPeaceArmy.com
Reuters reports Gold prices firmed on Friday, rebounding from a 3-1/2-month low as the dollar softened, while investors remained cautious ahead of Greece's referendum on an international bailout deal.
Liquidity was thinner, with U.S. markets closed for the Independence Day public holiday.
Spot gold was up 0.2 percent at $1,167.73 an ounce by 1823 GMT. It had dropped to $1,156.85 - its lowest since mid-March - ahead of Thursday's U.S. non-farm payrolls data but pared losses as the dollar fell against a basket of currencies after the data showed jobs growth was weaker than expected last month.
"Judging from how gold fell ahead of yesterday's U.S. data, the bias in the gold market is clearly to the bearish side," Julius Baer analyst Carsten Menke said.
Before the data there had been strong expectations that the Fed would raise rates for the first time in nearly a decade in September, given recent strong numbers on consumer spending and housing.
Gold has been under pressure this year from uncertainty over the timing of any rate increase, which could boost the dollar further and dent demand for non-interest-paying bullion.
The metal was still heading for a 0.5 percent fall on the week, adding to the previous week's 2 percent loss, mostly as a result of gains in the dollar against the euro as the Greek debt crisis unfolded.
Uncertainty around Greece has failed so far to trigger strong retail demand for gold, often perceived as a safe-haven asset.
"It's not only about the outcome of the referendum, but also about the reaction of the European Central Bank, which could cut the credit levels of its funding to Greece," Commerzbank analyst Carsten Fritsch said. "That could trigger some buying on gold."
The Greek government has called the referendum on Sunday after five months of acrimonious talks with its creditors broke down without an aid-for-reforms deal.
Recent CFTC data shows increase in open interest and contraction of net long position. Speculative short positions were increasing during whole June, while long positions mostly stand flat and even have decreased recently. Here we will not gamble on any relation to Greek question, and what conclusions could we make here on probable referendum result. Actually we’re mostly interesting in gold market per se. And CFTC data supports further decreasing on gold market.
SPDR fund mostly reports on stagnation of its storages. Two weeks ago they have dropped to 702 tonnes, and then have increased to 709. But this is still less that it was in the beginning of the month around 715 tonnes.
That’s being said sentiment data mostly supports further downward action on gold market.
Here is detailed breakdown of speculative positions:
Open interest:
 Shorts:
 Longs:
 Technicals
Monthly
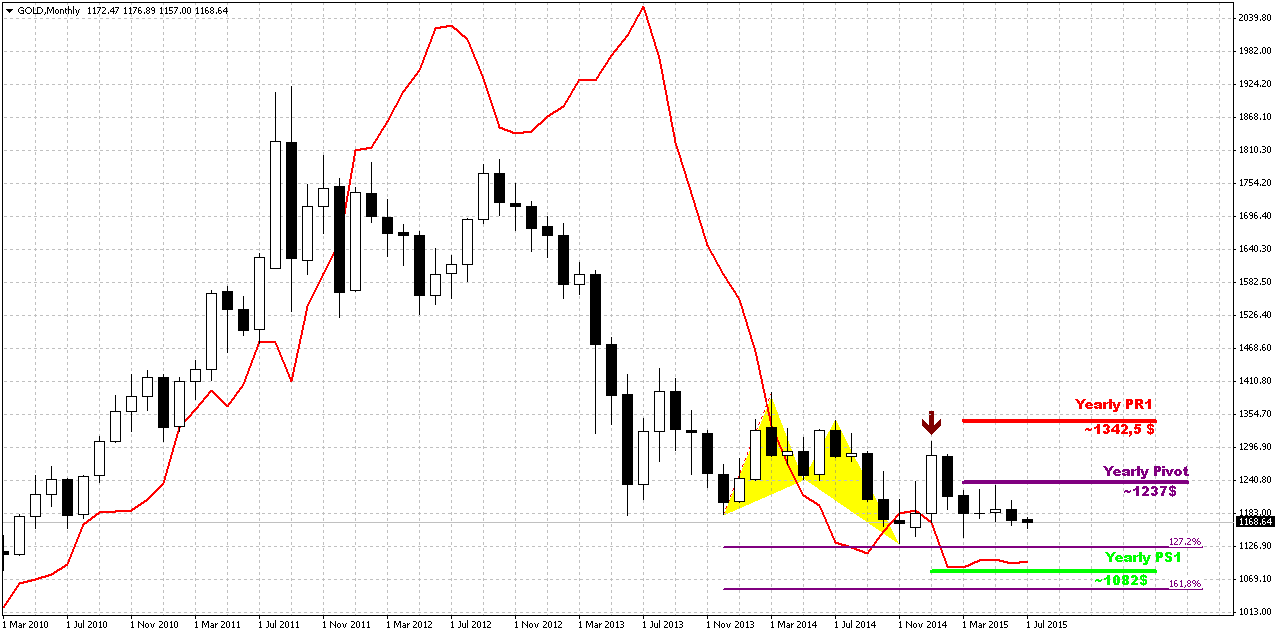
Last week shows no impact on monthly chart. Gold stands rather flat on monthly chart within 4 months in a row. Currently bearish dynamic pressure becomes very clear on this chart. It seems that gold just waits for some push. It means that as bearish dynamic pressure as VOB pattern are still valid.
On long-term horizon we still have last big pattern in progress that is Volatility breakout (VOB). It suggests at least 0.618 AB-CD down. And this target is 1050$. At the same time we need 1130 breakout to start clearly speak on 1050 target.
But what action market should show to break huge bearish patterns on monthly? Dynamic pressure is a tendency of lower highs within bullish trend. Hence, to break it, market should show higher high. I’ve marked it with arrow. It means that market should take out 1308 top to break this pattern and make investors doubt on bearish perspectives of gold market in long term. That’s why action that we have on daily and intraday charts right now is not an action of monthly one yet. Early bell of changing situation could be moving above YPP.
Overall picture still remains mostly bearish. In the beginning of the year market showed solid upside action. Gold was able to exceed yearly pivot, passed half way to Yearly Pivot resistance 1 but right now has reversed down and closed below YPP. From technical point of view this is bearish sign. This could be very significant moment and next logical destination will be yearly pivot support 1 around 1083$.
Fundamentally, gold mostly is hostage of dollar value and US economical data (mostly inflation) in nearest perspective. Approximately the same was announced by Fed in forecast on inflation and had become a reason of dovish approach to rate hiking. Another concern right now is too strong dollar that becomes a problem per se for economy growth and kills inflation. Prices are fallen so no needs to hike rates. The same information comes from President’s administration – it seems that Obama’s cabinet unsatisfied with too strong dollar and IMF was asking Fed to postpone rate hike on next year. We do not know whether these moments were become a reason of dovish tone in Fed comments or not, but result is the same. Fed has announced some worrying on employment and inflation and said that they need to get more strength in this data…
If we will take into consideration geopolitical situation and risks that have appeared recently, it could happen that situation will change, especially if situation in Ukraine will escalate and peaceful regulation will fail. Day by day we see worrying geopolitical news – Macedonia, Yemen, and Syria are to name some. Unfortunately the geopolicy is sphere where we can’t do much.
That’s being said, as gold has passed through 1200 and until it stands below 1308 top, our long-term next destination point is previous lows at 1130, but if gold will return to 1130 for second time – this is temporal destination and we should prepare for further downward action.
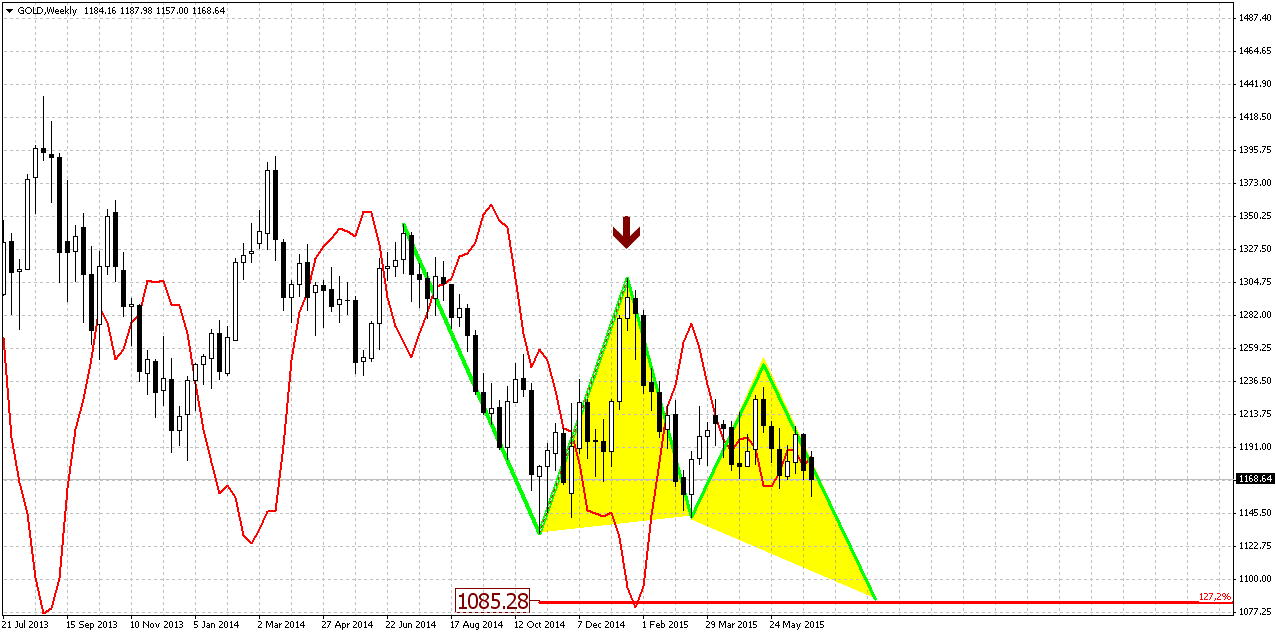
Weekly
On previous week trend has turned bearish again. Sometimes I call this kind of action as “2-day stop grabber”. This is not invention of DiNapoli, but I saw many times when market shifts trend and on next candle return it back – it very often works as grabber. This is easily could be explained – if you will increase time frame for 2 times you’ll get the grabber there. Anyway, here we could get something of that sort. Besides, take a look at action April. Trend mostly holds bullish, but price action is not, gold can’t start upside action. This could be the sign of market’s weakness.
Last week we also have got pure bearish grabber, and it looks as it should to. This is new pattern that points on downward continuation.
Our major pattern here is still big butterfly. Speaking on targets, we have three different patterns that point on the same level. They are butterfly “buy”, AB=CD and the part of this AB-CD that takes “222” Sell shape.
Thus, all these patterns point at the same destination around 1080$. This level is special, because it coincides with YPS1.
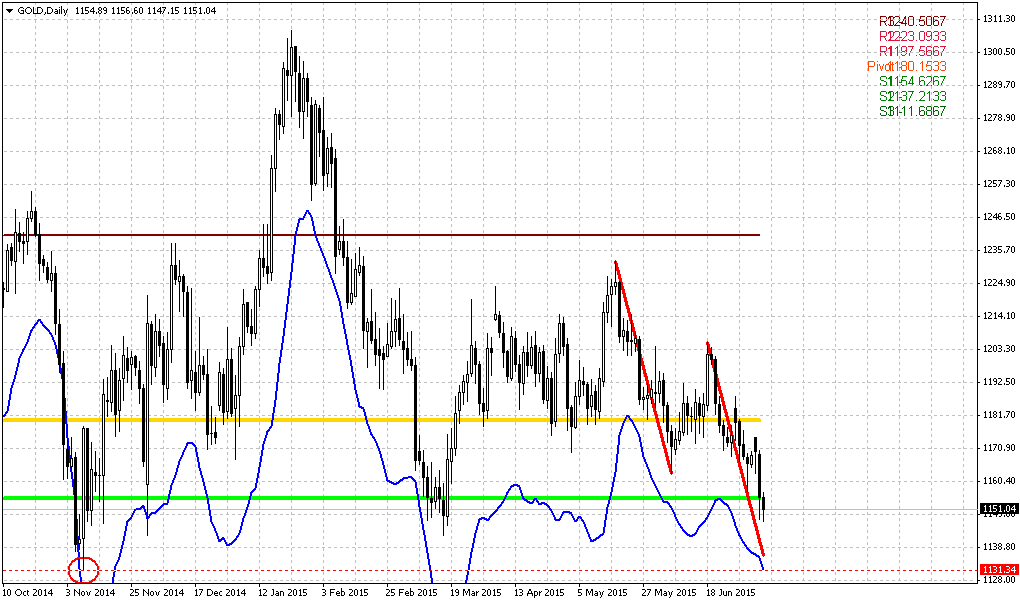
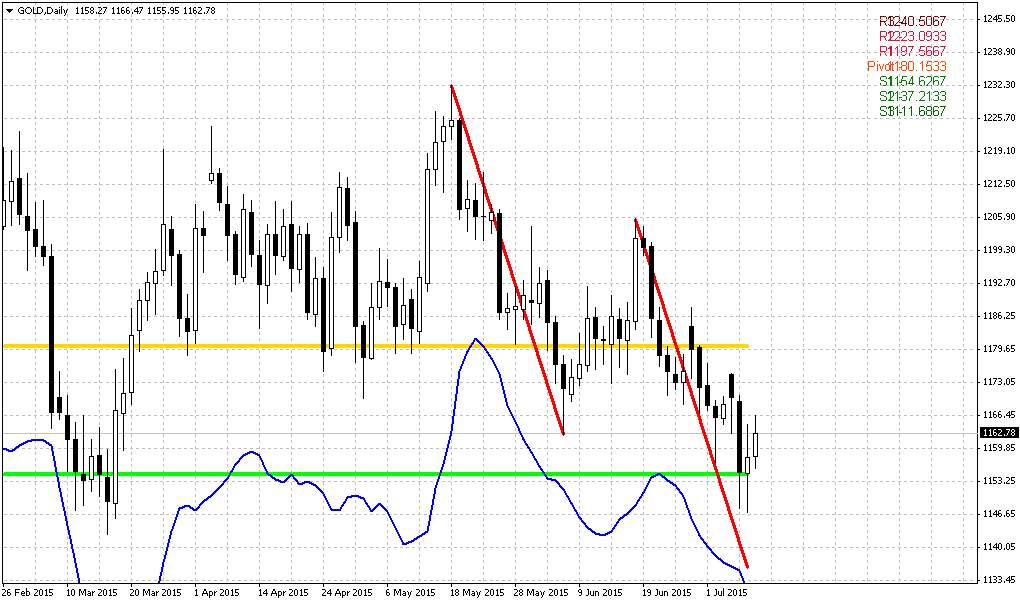
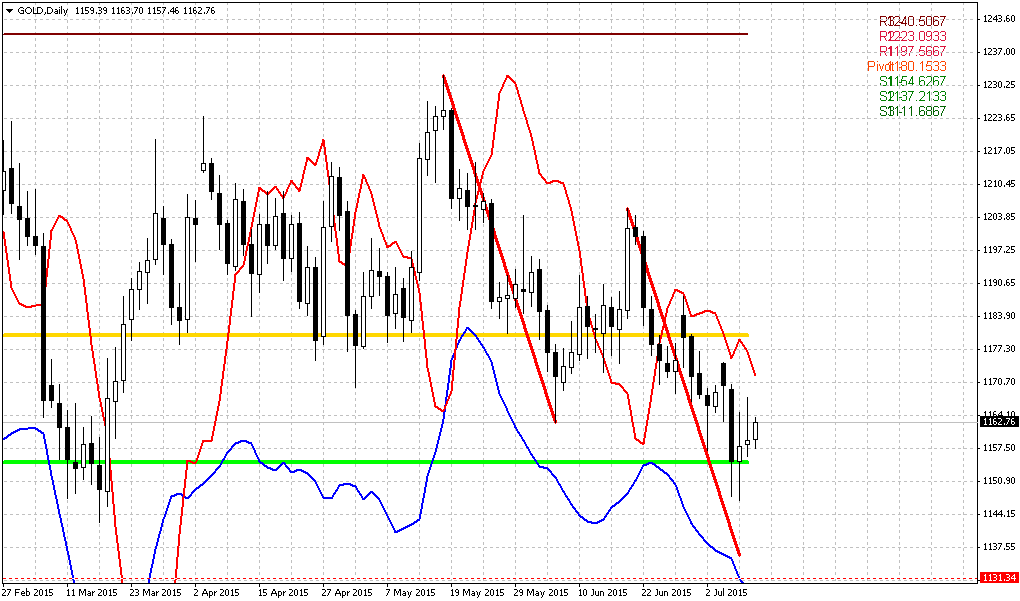
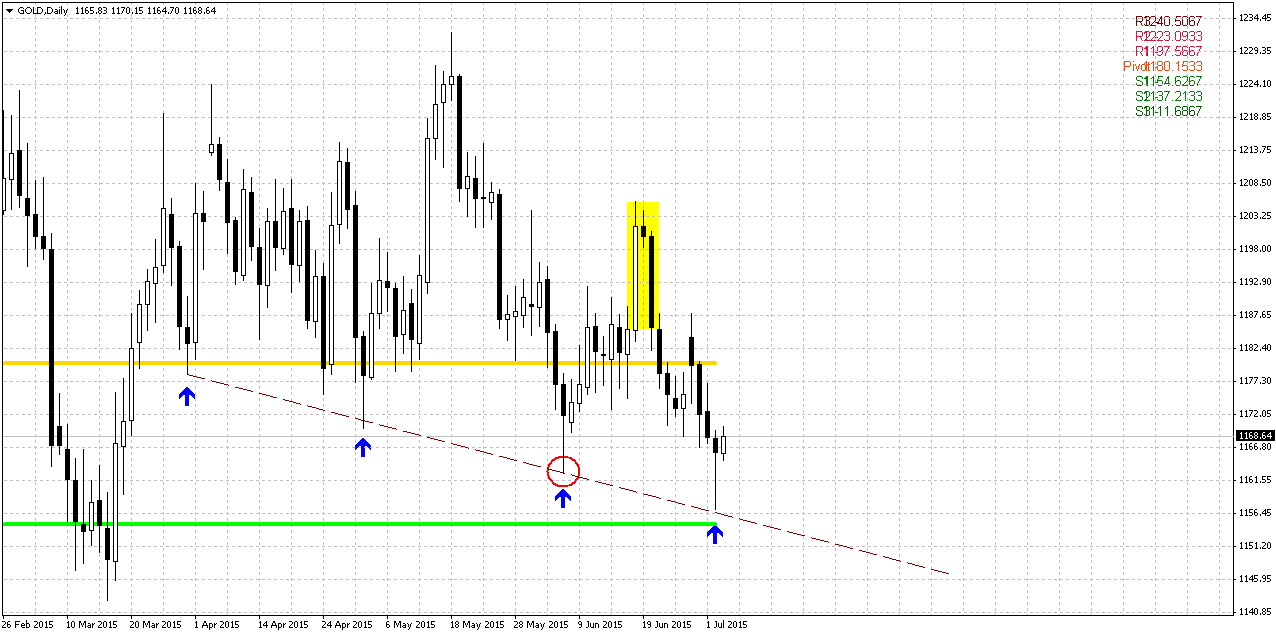
Daily
Trend is bearish here. Daily picture barely has changed and we have said everything on Friday. Market has hit our short-term target around 1160. This level also coincides with MPS1 and support line. We assume that gold market should continue move down and consequently reach chain of short term targets till 1130. Meantime, we do not know how Greek referendum results will impact the market. Technically, some upside bounce should happen in the beginning of next week as respect of current support area and we should use it for short entry. But be careful to any drastical event – if gold will show upside explosive action and break our key resistances then do not be short. Our analysis here stands for current situation and if it will not change drastically on next week.
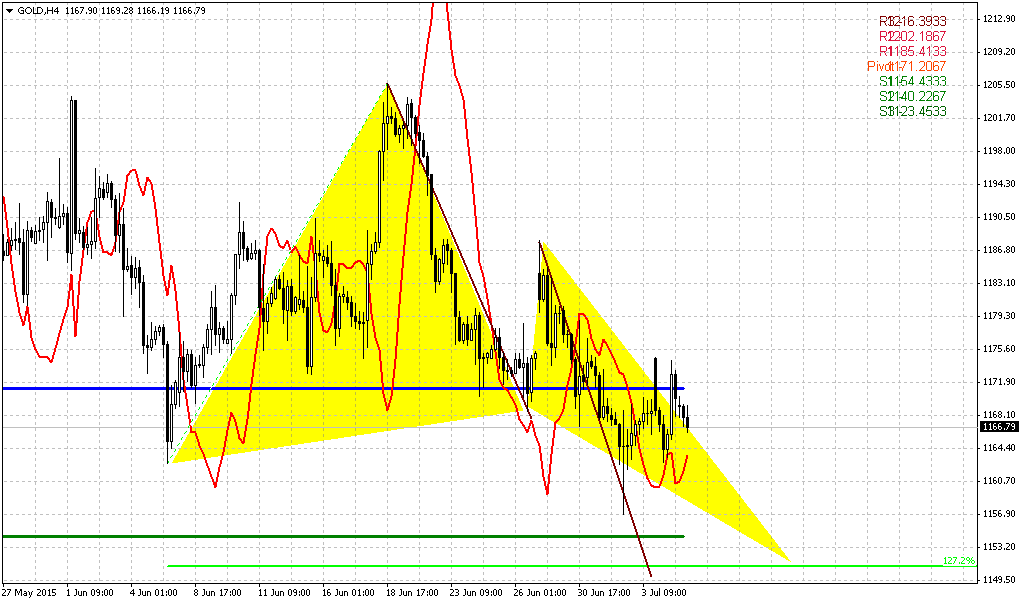
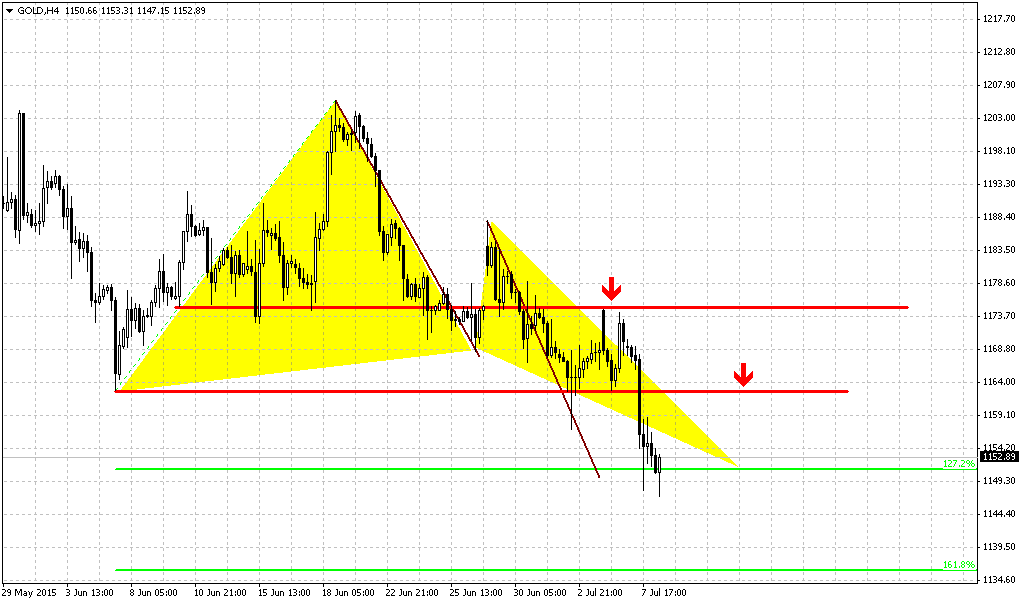
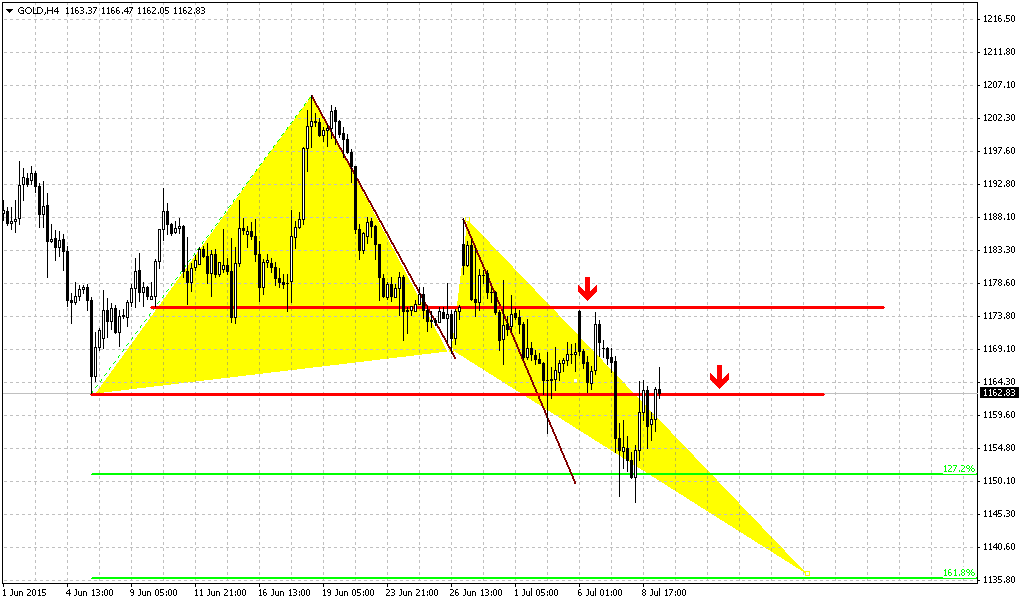
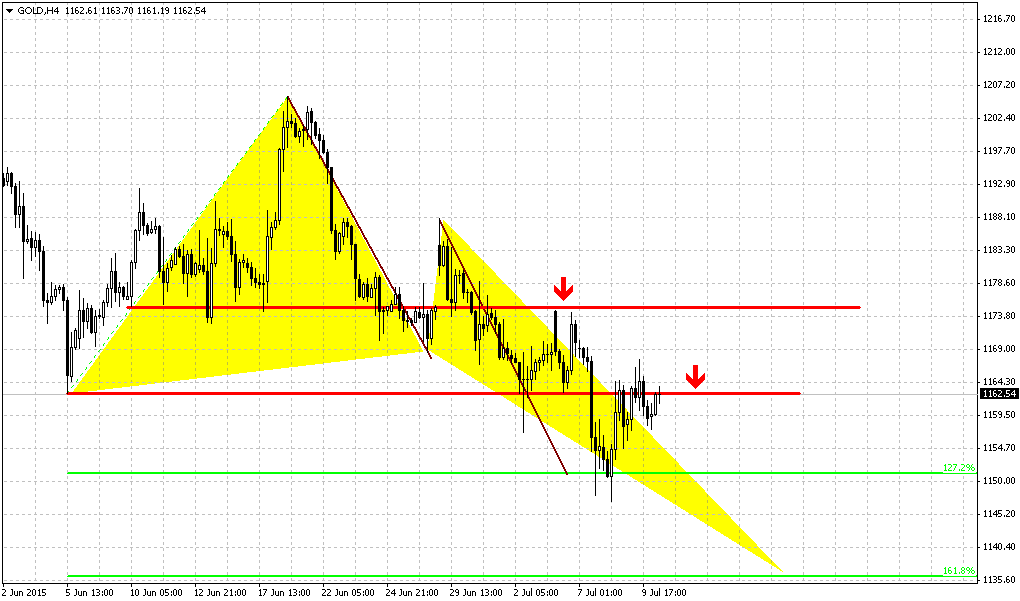
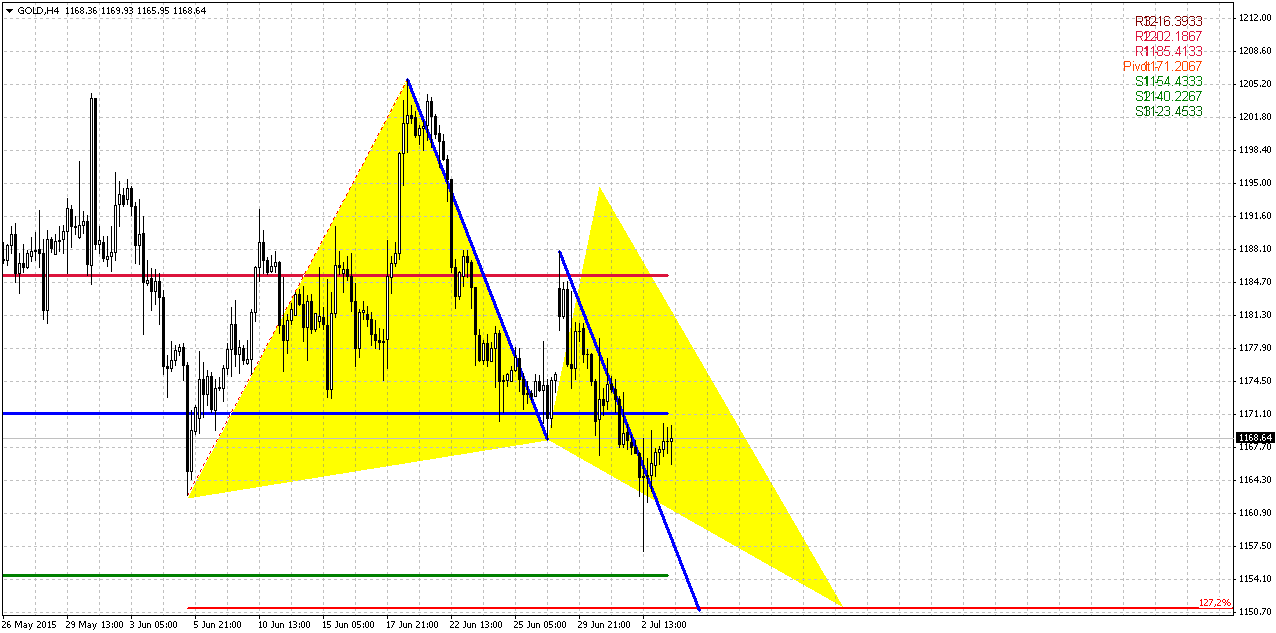
4-hour
As you can see, our suggestion on butterfly “Buy” pattern here has appeared to be correct. This pattern, as well as inner AB-CD suggests moving to next short-term target – 1150.
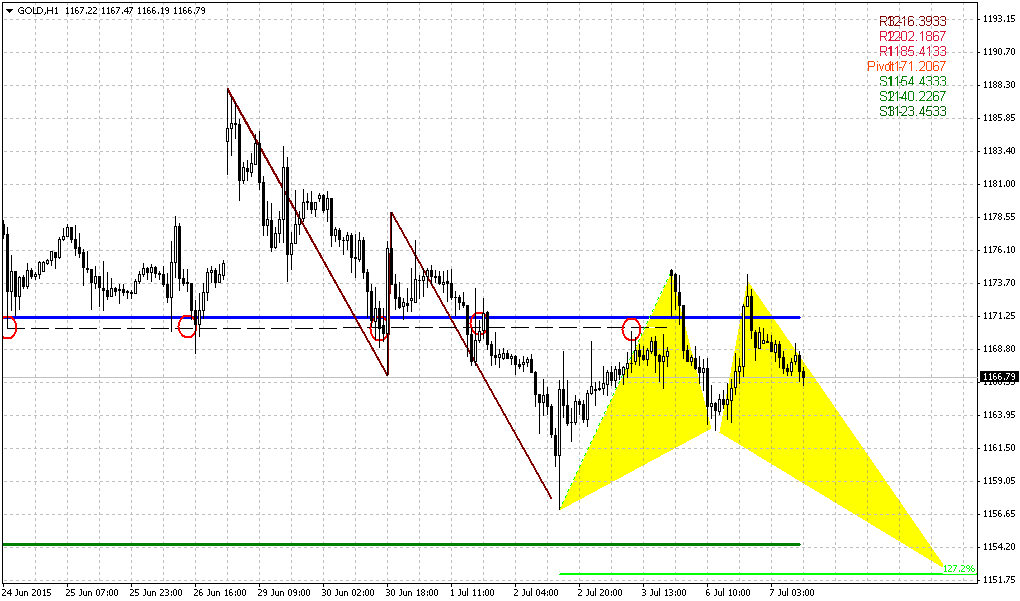
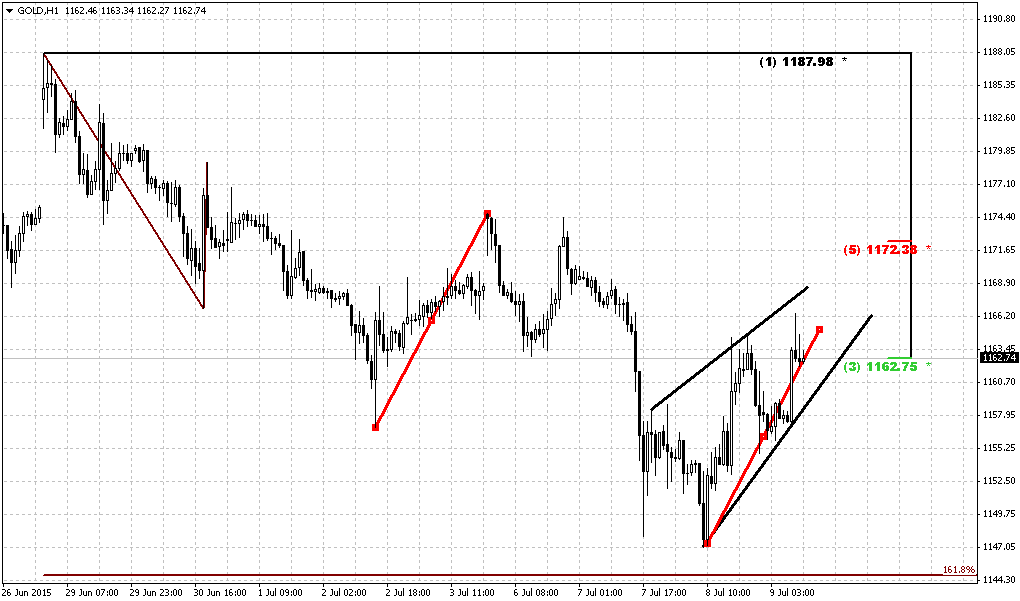
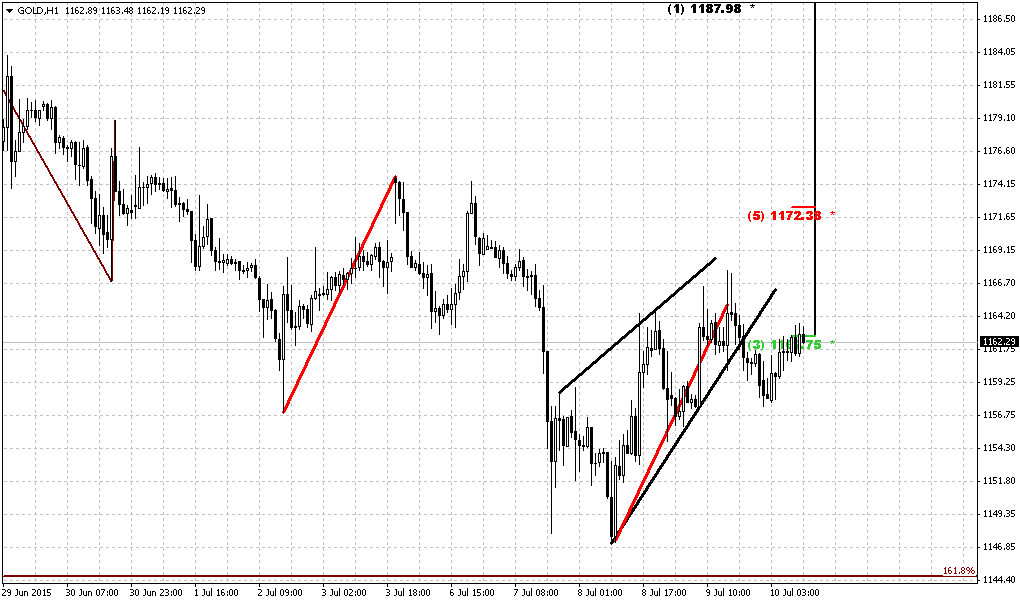
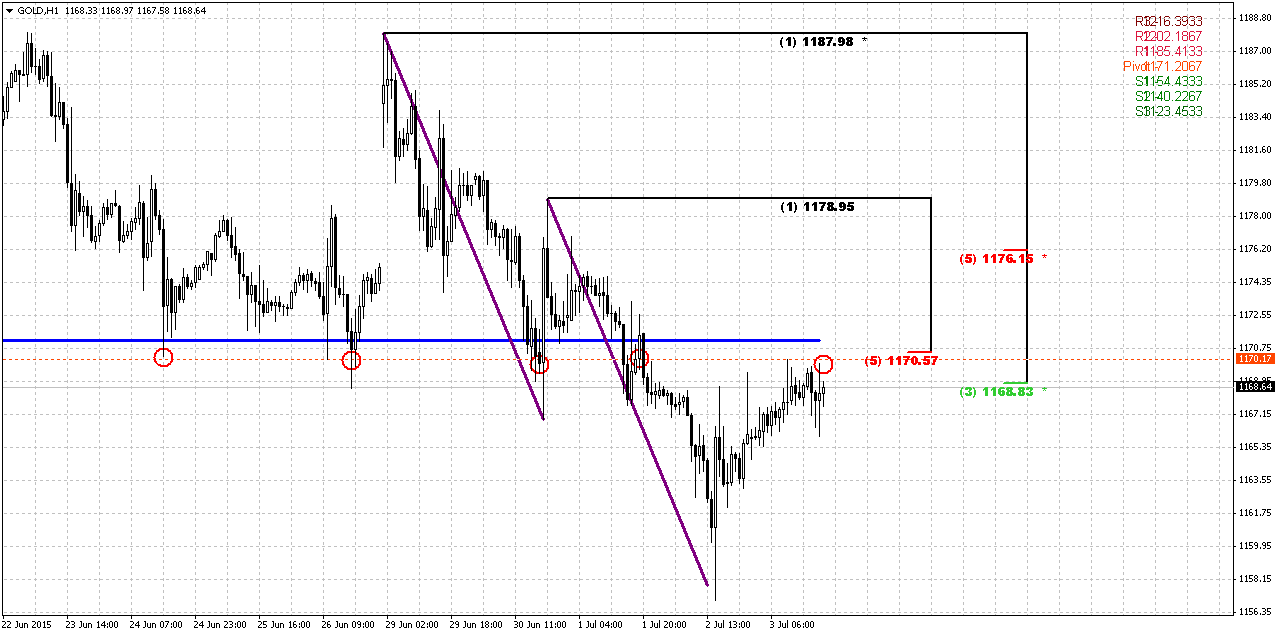
1-hour
Hourly chart shows that market has reached our level where we’ve thought to take short position. Upside action was triggered due not just respect to solid support area but also due completion of AB-CD pattern. Theoretically AB-CD let’s market to show even major 5/8 retracement before further downward continuation, but here we have strong resistance area – natural support/resistance zone, WPP and K-resistance. If gold is really bearish price should not pass through this level. Besides, if market will break this strong area, what chances that single Fib level will hold it?
Still, we should act here as usual and should be ready that we might be wrong. After taking short position, wait for downward action. If even this will be just short-term respect of resistance and not real downward continuation – this will be enough for us and will let us to move stop to breakeven point. That’s why we always use strong areas when take any position.
Conclusion:
Long-term picture remains bearish and major patterns stand mostly intact. Our long-term target still stands at 1050-1080 area. We do not exclude scenario with possible upside action if Greece default will happen on Monday but we think that hardly this event drastically will change the tendency. Other words speaking, we accept idea of possible upside action, may be it even could be significant, but this action hardly will break long-term bearish trend and sentiment. Reaction on Greece default could be strong, but probably it will not be long-term. Greece problem was discussing for a long period already and negative result probably partially was priced in already.
On short-term charts if nothing drastical will happen, we expect re-establishing of downward action from current levels. Any explosive upside action at Monday’s open will tell us to avoid bearish position.
The technical portion of Sive's analysis owes a great deal to Joe DiNapoli's methods, and uses a number of Joe's proprietary indicators. Please note that Sive's analysis is his own view of the market and is not endorsed by Joe DiNapoli or any related companies.
Weekly Gold Tading Report prepared by Sive Morten exclusively for ForexPeaceArmy.com
Reuters reports Gold prices firmed on Friday, rebounding from a 3-1/2-month low as the dollar softened, while investors remained cautious ahead of Greece's referendum on an international bailout deal.
Liquidity was thinner, with U.S. markets closed for the Independence Day public holiday.
Spot gold was up 0.2 percent at $1,167.73 an ounce by 1823 GMT. It had dropped to $1,156.85 - its lowest since mid-March - ahead of Thursday's U.S. non-farm payrolls data but pared losses as the dollar fell against a basket of currencies after the data showed jobs growth was weaker than expected last month.
"Judging from how gold fell ahead of yesterday's U.S. data, the bias in the gold market is clearly to the bearish side," Julius Baer analyst Carsten Menke said.
Before the data there had been strong expectations that the Fed would raise rates for the first time in nearly a decade in September, given recent strong numbers on consumer spending and housing.
Gold has been under pressure this year from uncertainty over the timing of any rate increase, which could boost the dollar further and dent demand for non-interest-paying bullion.
The metal was still heading for a 0.5 percent fall on the week, adding to the previous week's 2 percent loss, mostly as a result of gains in the dollar against the euro as the Greek debt crisis unfolded.
Uncertainty around Greece has failed so far to trigger strong retail demand for gold, often perceived as a safe-haven asset.
"It's not only about the outcome of the referendum, but also about the reaction of the European Central Bank, which could cut the credit levels of its funding to Greece," Commerzbank analyst Carsten Fritsch said. "That could trigger some buying on gold."
The Greek government has called the referendum on Sunday after five months of acrimonious talks with its creditors broke down without an aid-for-reforms deal.
Recent CFTC data shows increase in open interest and contraction of net long position. Speculative short positions were increasing during whole June, while long positions mostly stand flat and even have decreased recently. Here we will not gamble on any relation to Greek question, and what conclusions could we make here on probable referendum result. Actually we’re mostly interesting in gold market per se. And CFTC data supports further decreasing on gold market.
SPDR fund mostly reports on stagnation of its storages. Two weeks ago they have dropped to 702 tonnes, and then have increased to 709. But this is still less that it was in the beginning of the month around 715 tonnes.
That’s being said sentiment data mostly supports further downward action on gold market.
Here is detailed breakdown of speculative positions:
Open interest:
Monthly
Last week shows no impact on monthly chart. Gold stands rather flat on monthly chart within 4 months in a row. Currently bearish dynamic pressure becomes very clear on this chart. It seems that gold just waits for some push. It means that as bearish dynamic pressure as VOB pattern are still valid.
On long-term horizon we still have last big pattern in progress that is Volatility breakout (VOB). It suggests at least 0.618 AB-CD down. And this target is 1050$. At the same time we need 1130 breakout to start clearly speak on 1050 target.
But what action market should show to break huge bearish patterns on monthly? Dynamic pressure is a tendency of lower highs within bullish trend. Hence, to break it, market should show higher high. I’ve marked it with arrow. It means that market should take out 1308 top to break this pattern and make investors doubt on bearish perspectives of gold market in long term. That’s why action that we have on daily and intraday charts right now is not an action of monthly one yet. Early bell of changing situation could be moving above YPP.
Overall picture still remains mostly bearish. In the beginning of the year market showed solid upside action. Gold was able to exceed yearly pivot, passed half way to Yearly Pivot resistance 1 but right now has reversed down and closed below YPP. From technical point of view this is bearish sign. This could be very significant moment and next logical destination will be yearly pivot support 1 around 1083$.
Fundamentally, gold mostly is hostage of dollar value and US economical data (mostly inflation) in nearest perspective. Approximately the same was announced by Fed in forecast on inflation and had become a reason of dovish approach to rate hiking. Another concern right now is too strong dollar that becomes a problem per se for economy growth and kills inflation. Prices are fallen so no needs to hike rates. The same information comes from President’s administration – it seems that Obama’s cabinet unsatisfied with too strong dollar and IMF was asking Fed to postpone rate hike on next year. We do not know whether these moments were become a reason of dovish tone in Fed comments or not, but result is the same. Fed has announced some worrying on employment and inflation and said that they need to get more strength in this data…
If we will take into consideration geopolitical situation and risks that have appeared recently, it could happen that situation will change, especially if situation in Ukraine will escalate and peaceful regulation will fail. Day by day we see worrying geopolitical news – Macedonia, Yemen, and Syria are to name some. Unfortunately the geopolicy is sphere where we can’t do much.
That’s being said, as gold has passed through 1200 and until it stands below 1308 top, our long-term next destination point is previous lows at 1130, but if gold will return to 1130 for second time – this is temporal destination and we should prepare for further downward action.
Weekly
On previous week trend has turned bearish again. Sometimes I call this kind of action as “2-day stop grabber”. This is not invention of DiNapoli, but I saw many times when market shifts trend and on next candle return it back – it very often works as grabber. This is easily could be explained – if you will increase time frame for 2 times you’ll get the grabber there. Anyway, here we could get something of that sort. Besides, take a look at action April. Trend mostly holds bullish, but price action is not, gold can’t start upside action. This could be the sign of market’s weakness.
Last week we also have got pure bearish grabber, and it looks as it should to. This is new pattern that points on downward continuation.
Our major pattern here is still big butterfly. Speaking on targets, we have three different patterns that point on the same level. They are butterfly “buy”, AB=CD and the part of this AB-CD that takes “222” Sell shape.
Thus, all these patterns point at the same destination around 1080$. This level is special, because it coincides with YPS1.
Daily
Trend is bearish here. Daily picture barely has changed and we have said everything on Friday. Market has hit our short-term target around 1160. This level also coincides with MPS1 and support line. We assume that gold market should continue move down and consequently reach chain of short term targets till 1130. Meantime, we do not know how Greek referendum results will impact the market. Technically, some upside bounce should happen in the beginning of next week as respect of current support area and we should use it for short entry. But be careful to any drastical event – if gold will show upside explosive action and break our key resistances then do not be short. Our analysis here stands for current situation and if it will not change drastically on next week.
4-hour
As you can see, our suggestion on butterfly “Buy” pattern here has appeared to be correct. This pattern, as well as inner AB-CD suggests moving to next short-term target – 1150.
1-hour
Hourly chart shows that market has reached our level where we’ve thought to take short position. Upside action was triggered due not just respect to solid support area but also due completion of AB-CD pattern. Theoretically AB-CD let’s market to show even major 5/8 retracement before further downward continuation, but here we have strong resistance area – natural support/resistance zone, WPP and K-resistance. If gold is really bearish price should not pass through this level. Besides, if market will break this strong area, what chances that single Fib level will hold it?
Still, we should act here as usual and should be ready that we might be wrong. After taking short position, wait for downward action. If even this will be just short-term respect of resistance and not real downward continuation – this will be enough for us and will let us to move stop to breakeven point. That’s why we always use strong areas when take any position.
Conclusion:
Long-term picture remains bearish and major patterns stand mostly intact. Our long-term target still stands at 1050-1080 area. We do not exclude scenario with possible upside action if Greece default will happen on Monday but we think that hardly this event drastically will change the tendency. Other words speaking, we accept idea of possible upside action, may be it even could be significant, but this action hardly will break long-term bearish trend and sentiment. Reaction on Greece default could be strong, but probably it will not be long-term. Greece problem was discussing for a long period already and negative result probably partially was priced in already.
On short-term charts if nothing drastical will happen, we expect re-establishing of downward action from current levels. Any explosive upside action at Monday’s open will tell us to avoid bearish position.
The technical portion of Sive's analysis owes a great deal to Joe DiNapoli's methods, and uses a number of Joe's proprietary indicators. Please note that Sive's analysis is his own view of the market and is not endorsed by Joe DiNapoli or any related companies.