Sive Morten
Special Consultant to the FPA
- Messages
- 18,673
Fundamentals
As Reuters reports, Gold fell almost 1 percent to a near four-month low on Friday, extending its losing streak a fourth consecutive day, weighed down by book squaring ahead of month end and selling by commodity funds. For the week, gold lost about 3.5 percent for its worst decline since late November 2013. Heavy technical selling throughout the week sent bullion prices below $1,250 for the first time since Feb. 4. "It's the end-of-the-month position clearing," said COMEX gold options floor trader Jonathan Jossen. Some hedge funds are forced to sell commodities to raise cash to pay for losses in their bearish bets against the rallying U.S. government bond prices, Jossen added.
Analysts noted a breakdown of gold's usual inverse correlation with U.S. bond yields. Yields on 10-year U.S. Treasuries fell sharply this week to hit their lowest in 11 months. The yellow metal largely ignored a U.S. government report which showed falling U.S. consumer spending for the first time in a year in April after two months of solid gains, as analysts said the decline is likely temporary given a strengthening jobs market. Among other precious metals, silver was down 1.3 percent to $18.72 an ounce, while platinum fell 0.5 percent to $1,446 an ounce, and palladium was up 0.3 percent to $833.25.
Monthly
May right at the end has shown it’s power by solid plunge down. It could mean that bearish grabber that was formed 2 months earlier is taking it’s power. Also we’ve discussed possible bearish dynamic pressure here and now it looks as clear as never before. At the same time our reversal level here becomes farer and farer. Even if price will reach 1350 area – it will not change big picture. Situation could change only if market will move above 1400 area.
Grabber pattern and pressure is so important right now, because they provide direction for long-time perspective.
At the same time grabber has appeared right at Yearly Pivot Point – this is not best combination for bulls and could indicate reaction of the gold on Yearly pivot. Otherwords it could be a confirmation of bearish sentiment for the whole year. Grabber potentially strong pattern that could lead price back at least to 1180 lows again.
That’s being said recent action indicates that bears’ power is growing and may be market finally has turned to more active behavior. Besides, if we even will get any deeper retracement up - hardly it will change long-term picture. Currently, there are 3 major driving factors on gold - some unexpected geopolitical tensions, inflation and seasonal trend, i.e. spot demand. None of them show significant appreciation. Hence, it is very difficult to take bet on upward reversal on gold market by far. Even more, US fundamental data and seasonal trend now makes pressure impact on gold.
Weekly
Weekly chart is major one for gold right now. Mostly because it shows intermediate targets. Nearest target stands at 1236 area – just 10$ lower than the current market. This level probably will become the major one on coming week. But taking farer look – market could form AB=CD down to 1140$ area, because monthly grabber suggests taking out of previous lows and next nearest target below it is precisely AB=CD objective point.
And finally, guys, here could be even butterfly Buy pattern. I do not have it on this chart, but you, probably will be able to draw it by yourself. It has even lower target – 1110$. At the same time guys, this area around 1000-1100$ will become an area of big demand. This is the breakeven cost of gold mining. Price will not be able to hold below this level for long period, otherwise it will be just unprofitable to mine gold… I dare to suggest that market could reach it at the end of the summer, when seasonal trend shifts bullish.
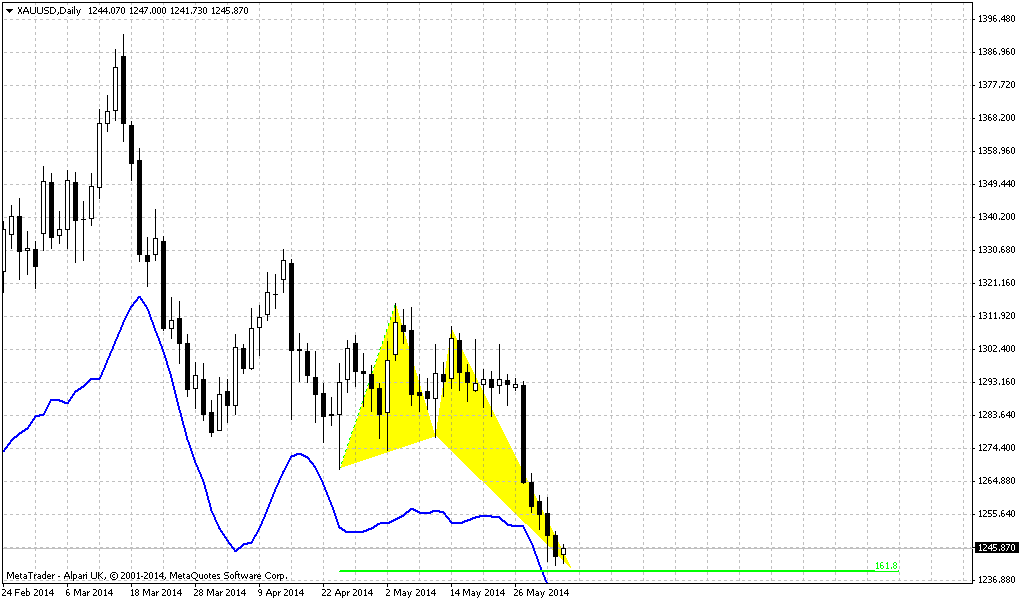
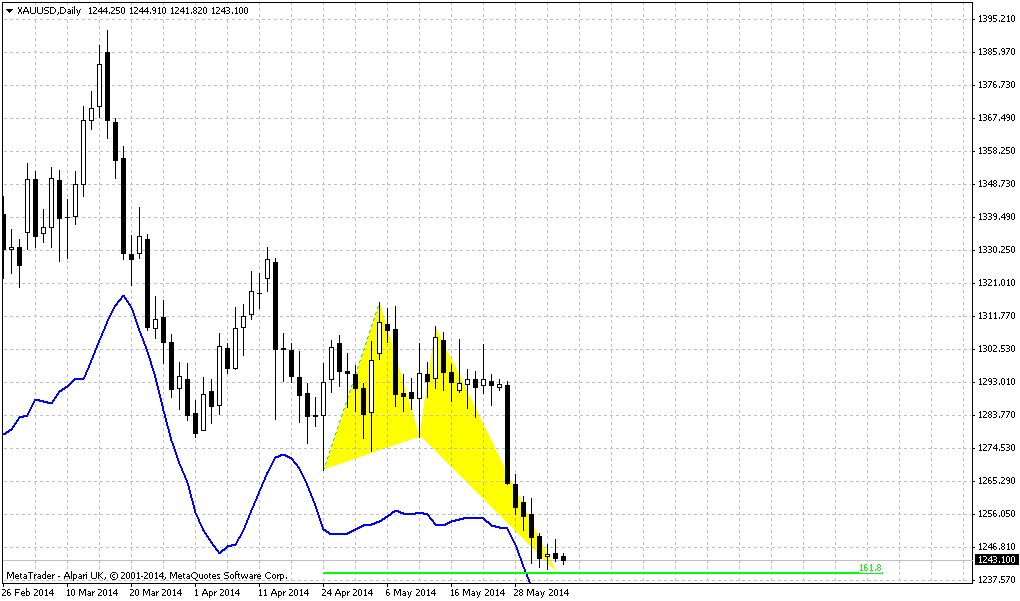
Daily
Daily trend is bearish as well. As we’ve estimated that weekly target stands at 1236$ - market is forming butterfly buy pattern with 1.618 target precisely at the same area. This level will close to daily oversold as well. This combination could trigger some upward bounce on next week.
Large AB=CD downward pattern shows that bears are really strong right now. Although market has reached 0.618 target – no reaction has followed. Gold just has passed through it as it is no exist. And that has happened also around major 5/8 Fib support level. Next target of this AB=CD stands at 1215, but first we will be focused on weekly 0.618 extension as we’ve just said.
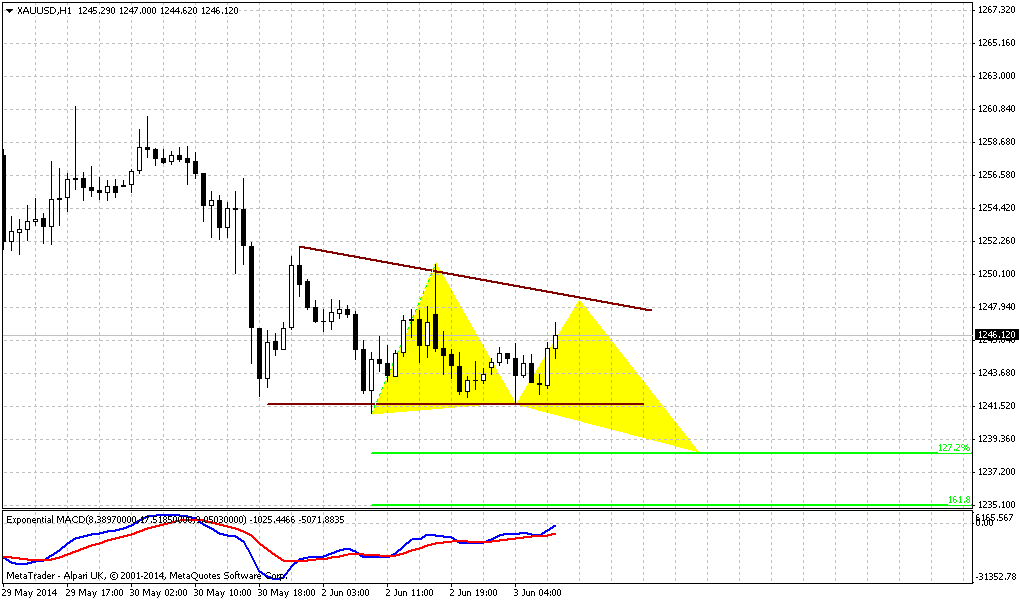
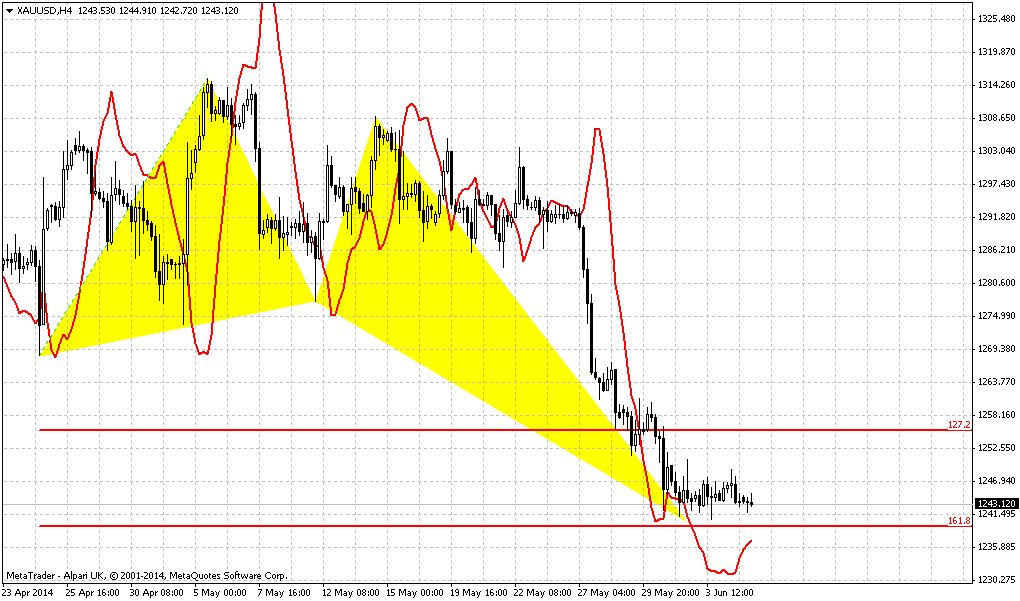
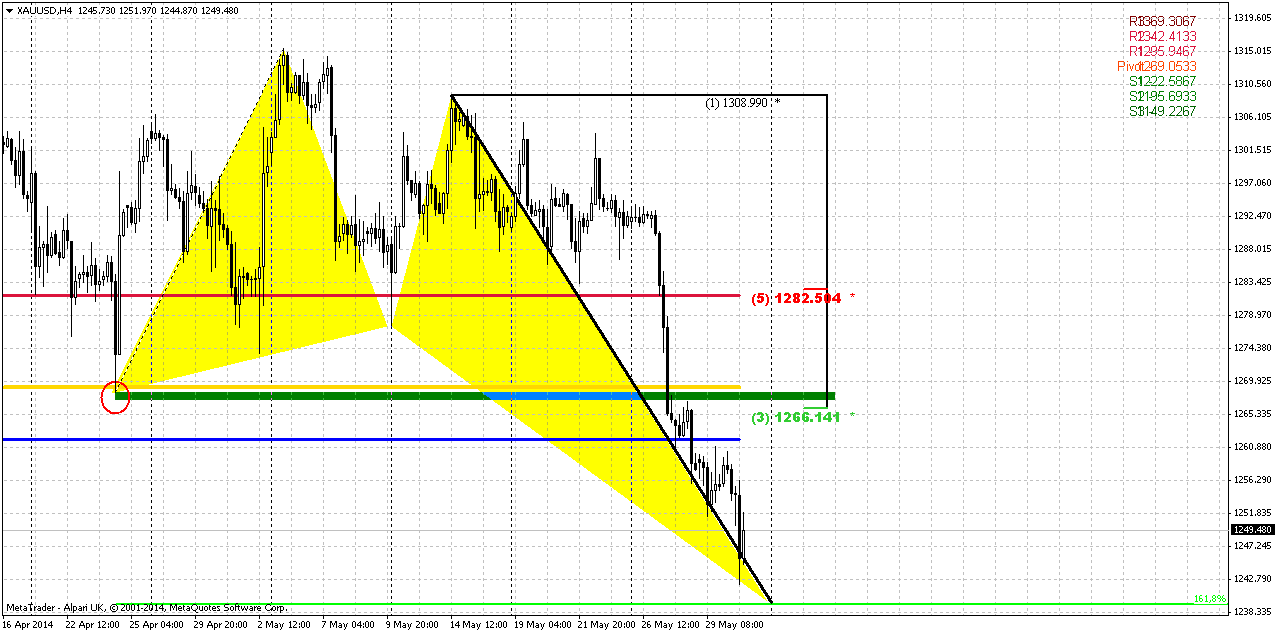
4-hour
This chart gives us hint on possible target of retracement, if it will happen at all, of cause. Unfortunately we can’t discuss some particular reversal patterns here, since market has not done yet with downard action and has not reached 1236 area. But, we see that 1266-1270 is strong resistance cluster that includes: WPP, Fib level, MPP and previous lows resistance. Besides, this is minimum retracement that could treated as butterfly target.
Conclusion:
Market has to breakout either 1400 to change long-term situation significantly. On previous week market has turned to fast action and has done as much as we have expected form it during much longer time. Thus, we’ve got as bearish grabber as dynamic pressure that point on reaching at least of recent lows around 1180s. But potentially, gold could reach deeper levels.
In short-term perspective, nearest support stand around 1236. Market is approaching to it by butterfly pattern. We will be watching this pattern by two reasons. First is because it could give necessary bounce for daily traders to take short position. Second – scalpers could try to ride north, since retracement should be not small - around 30$ per contract.
The technical portion of Sive's analysis owes a great deal to Joe DiNapoli's methods, and uses a number of Joe's proprietary indicators. Please note that Sive's analysis is his own view of the market and is not endorsed by Joe DiNapoli or any related companies.
As Reuters reports, Gold fell almost 1 percent to a near four-month low on Friday, extending its losing streak a fourth consecutive day, weighed down by book squaring ahead of month end and selling by commodity funds. For the week, gold lost about 3.5 percent for its worst decline since late November 2013. Heavy technical selling throughout the week sent bullion prices below $1,250 for the first time since Feb. 4. "It's the end-of-the-month position clearing," said COMEX gold options floor trader Jonathan Jossen. Some hedge funds are forced to sell commodities to raise cash to pay for losses in their bearish bets against the rallying U.S. government bond prices, Jossen added.
Analysts noted a breakdown of gold's usual inverse correlation with U.S. bond yields. Yields on 10-year U.S. Treasuries fell sharply this week to hit their lowest in 11 months. The yellow metal largely ignored a U.S. government report which showed falling U.S. consumer spending for the first time in a year in April after two months of solid gains, as analysts said the decline is likely temporary given a strengthening jobs market. Among other precious metals, silver was down 1.3 percent to $18.72 an ounce, while platinum fell 0.5 percent to $1,446 an ounce, and palladium was up 0.3 percent to $833.25.
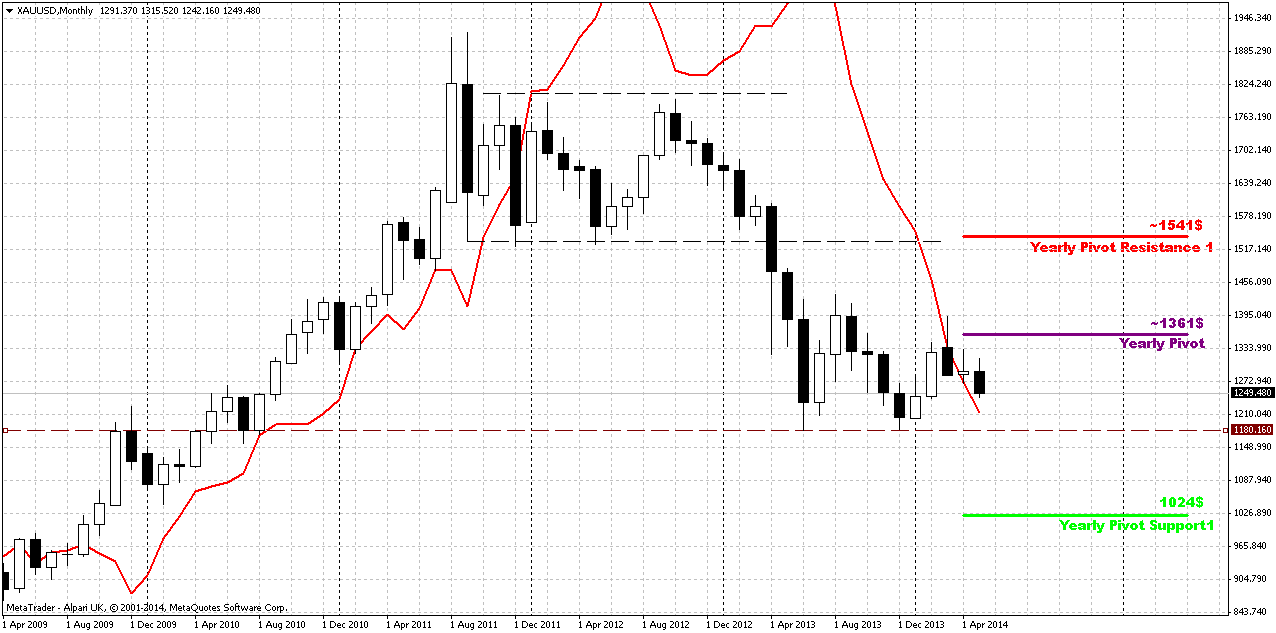
Monthly
May right at the end has shown it’s power by solid plunge down. It could mean that bearish grabber that was formed 2 months earlier is taking it’s power. Also we’ve discussed possible bearish dynamic pressure here and now it looks as clear as never before. At the same time our reversal level here becomes farer and farer. Even if price will reach 1350 area – it will not change big picture. Situation could change only if market will move above 1400 area.
Grabber pattern and pressure is so important right now, because they provide direction for long-time perspective.
At the same time grabber has appeared right at Yearly Pivot Point – this is not best combination for bulls and could indicate reaction of the gold on Yearly pivot. Otherwords it could be a confirmation of bearish sentiment for the whole year. Grabber potentially strong pattern that could lead price back at least to 1180 lows again.
That’s being said recent action indicates that bears’ power is growing and may be market finally has turned to more active behavior. Besides, if we even will get any deeper retracement up - hardly it will change long-term picture. Currently, there are 3 major driving factors on gold - some unexpected geopolitical tensions, inflation and seasonal trend, i.e. spot demand. None of them show significant appreciation. Hence, it is very difficult to take bet on upward reversal on gold market by far. Even more, US fundamental data and seasonal trend now makes pressure impact on gold.
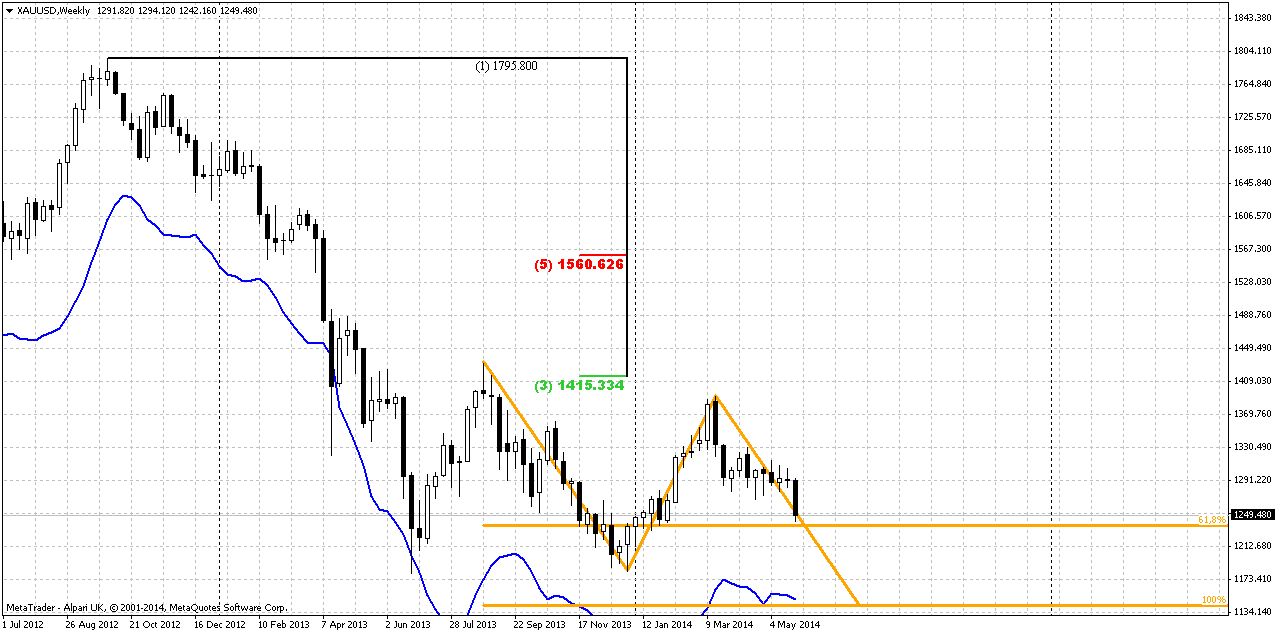
Weekly
Weekly chart is major one for gold right now. Mostly because it shows intermediate targets. Nearest target stands at 1236 area – just 10$ lower than the current market. This level probably will become the major one on coming week. But taking farer look – market could form AB=CD down to 1140$ area, because monthly grabber suggests taking out of previous lows and next nearest target below it is precisely AB=CD objective point.
And finally, guys, here could be even butterfly Buy pattern. I do not have it on this chart, but you, probably will be able to draw it by yourself. It has even lower target – 1110$. At the same time guys, this area around 1000-1100$ will become an area of big demand. This is the breakeven cost of gold mining. Price will not be able to hold below this level for long period, otherwise it will be just unprofitable to mine gold… I dare to suggest that market could reach it at the end of the summer, when seasonal trend shifts bullish.
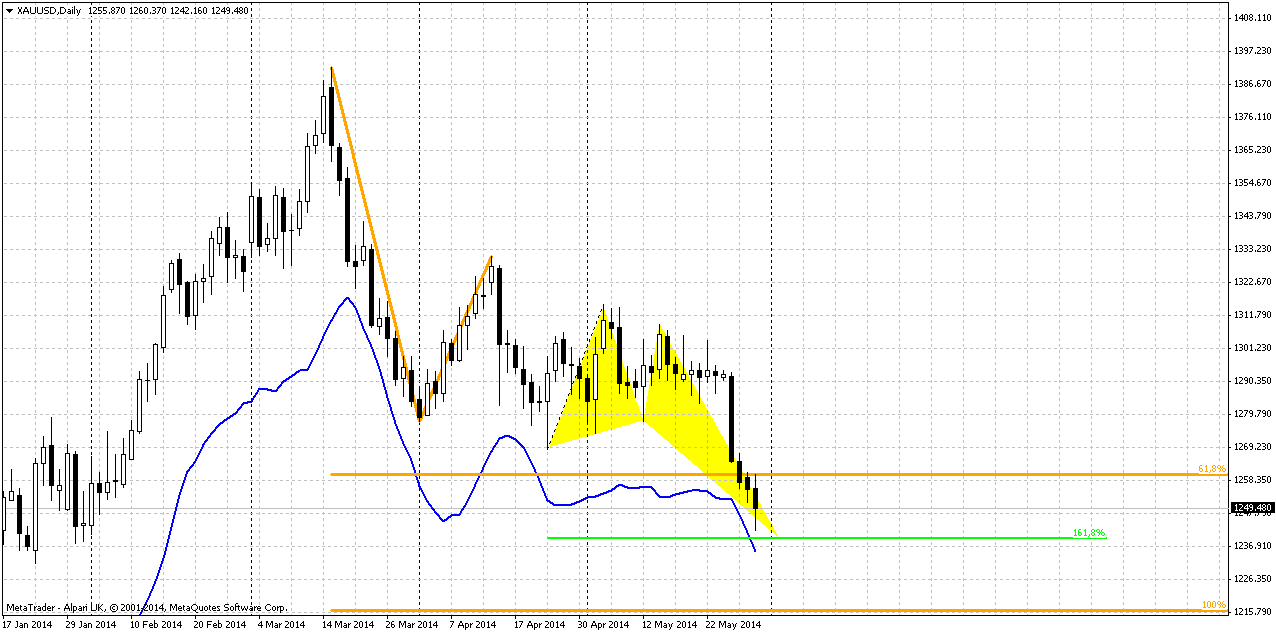
Daily
Daily trend is bearish as well. As we’ve estimated that weekly target stands at 1236$ - market is forming butterfly buy pattern with 1.618 target precisely at the same area. This level will close to daily oversold as well. This combination could trigger some upward bounce on next week.
Large AB=CD downward pattern shows that bears are really strong right now. Although market has reached 0.618 target – no reaction has followed. Gold just has passed through it as it is no exist. And that has happened also around major 5/8 Fib support level. Next target of this AB=CD stands at 1215, but first we will be focused on weekly 0.618 extension as we’ve just said.
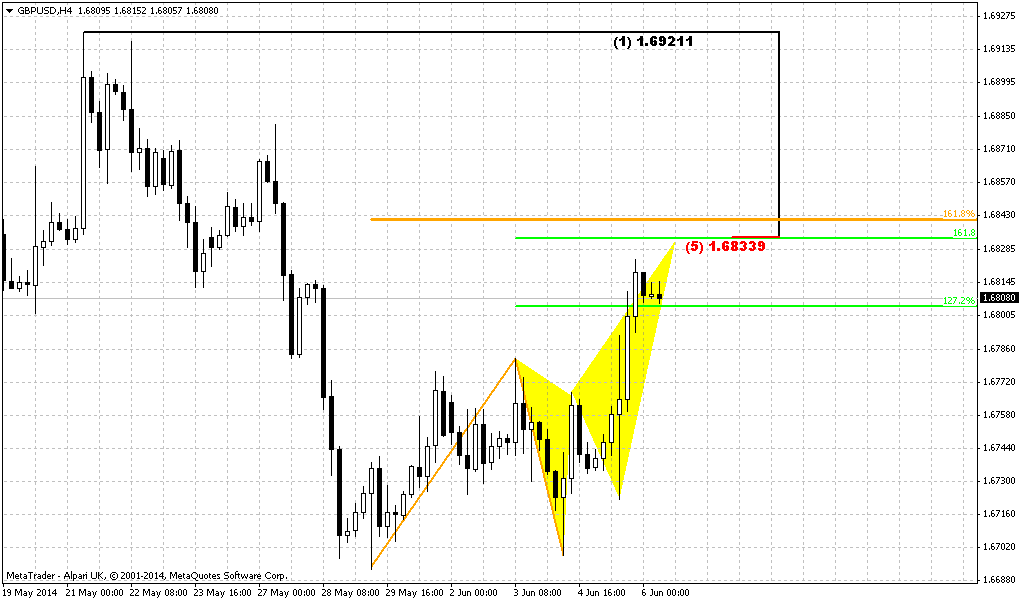
4-hour
This chart gives us hint on possible target of retracement, if it will happen at all, of cause. Unfortunately we can’t discuss some particular reversal patterns here, since market has not done yet with downard action and has not reached 1236 area. But, we see that 1266-1270 is strong resistance cluster that includes: WPP, Fib level, MPP and previous lows resistance. Besides, this is minimum retracement that could treated as butterfly target.
Conclusion:
Market has to breakout either 1400 to change long-term situation significantly. On previous week market has turned to fast action and has done as much as we have expected form it during much longer time. Thus, we’ve got as bearish grabber as dynamic pressure that point on reaching at least of recent lows around 1180s. But potentially, gold could reach deeper levels.
In short-term perspective, nearest support stand around 1236. Market is approaching to it by butterfly pattern. We will be watching this pattern by two reasons. First is because it could give necessary bounce for daily traders to take short position. Second – scalpers could try to ride north, since retracement should be not small - around 30$ per contract.
The technical portion of Sive's analysis owes a great deal to Joe DiNapoli's methods, and uses a number of Joe's proprietary indicators. Please note that Sive's analysis is his own view of the market and is not endorsed by Joe DiNapoli or any related companies.