Sive Morten
Special Consultant to the FPA
- Messages
- 18,695
Fundamentals
Weekly Gold Tading Report prepared by Sive Morten exclusively for ForexPeaceArmy.com
Reuters reports euro declined against other major currencies on Friday, weighed down by anxieties Greece may soon default on debts that also drove safe-haven buying of the dollar.
Greece is days away from potentially missing debt repayments of 1.6 billion euros to the International Monetary Fund, and investors are looking to an emergency meeting next week where euro zone leaders will try to find a way to unlock aid for Athens.
Germany, the biggest European contributor to bailout programs that have kept Greece afloat for five years, insisted it still was not too late for Athens to come to terms with its creditors at the EU and IMF.
The European Central Bank on Friday raised the ceiling on emergency liquidity that Greek banks can draw from the country's central bank for the second time this week, a banking source told Reuters.
Bankers told Reuters that about 4.2 billion euros had flooded out of Greek bank accounts this week despite central bank efforts to restore calm.
"Greece remains highly combustible, and that's a recipe for dollar strength and risk aversion," said Richard Franulovich, senior currency strategist at Westpac in New York.
The dollar has been rallying for nearly a year but this week was on track for a third consecutive week of losses. Some analysts still see the dollar climbing.
"When we get to where we can see the white of the eyes of the Fed rate hike, we will have a second wave of the dollar rally," said Greg Anderson, global head of FX strategy at BMO Capital Markets in New York.
Recent CFTC data shows increase in open interest again mostly due increasing of speculative short positions. Although longs also has increased, short positions has increased on greater value. The same has happened with hedgers’ position. Longs has increased greater than shorts and this data mostly supports existing bear trend on the market, despite most recent upside action.
SPDR fund has lost another 3 tonnes on storages last week. Now they stand around 702 tonnes. This progress stands in the same stream as CFTC numbers. Although the pace of decreasing has slowed a bit, but still fund is losing value even on upside gold action that we’ve seen last week.
Here is detailed breakdown of speculative positions:
Open interest:
 Shorts:
 Longs:
 Technicals
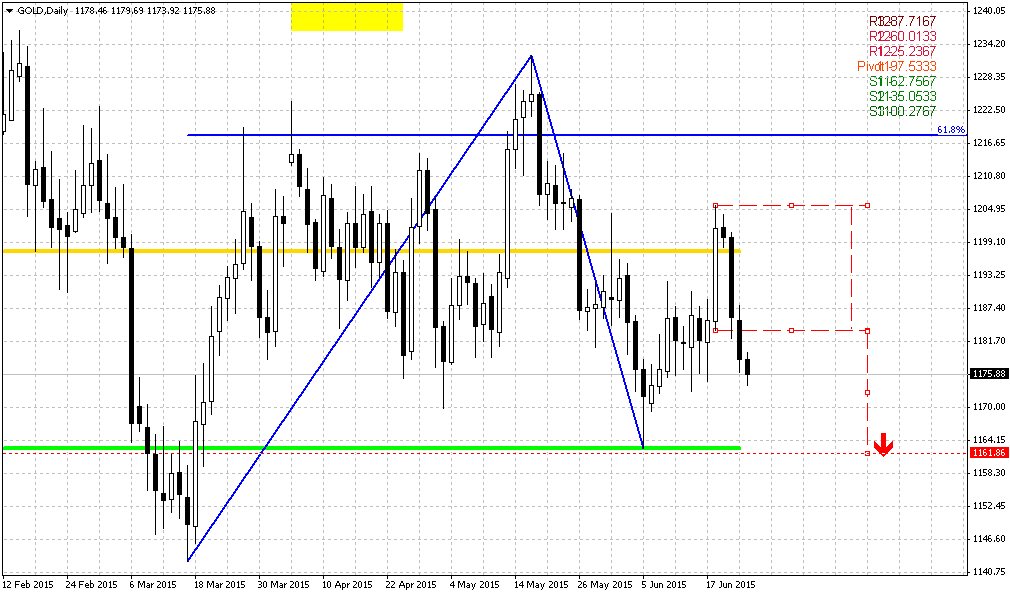
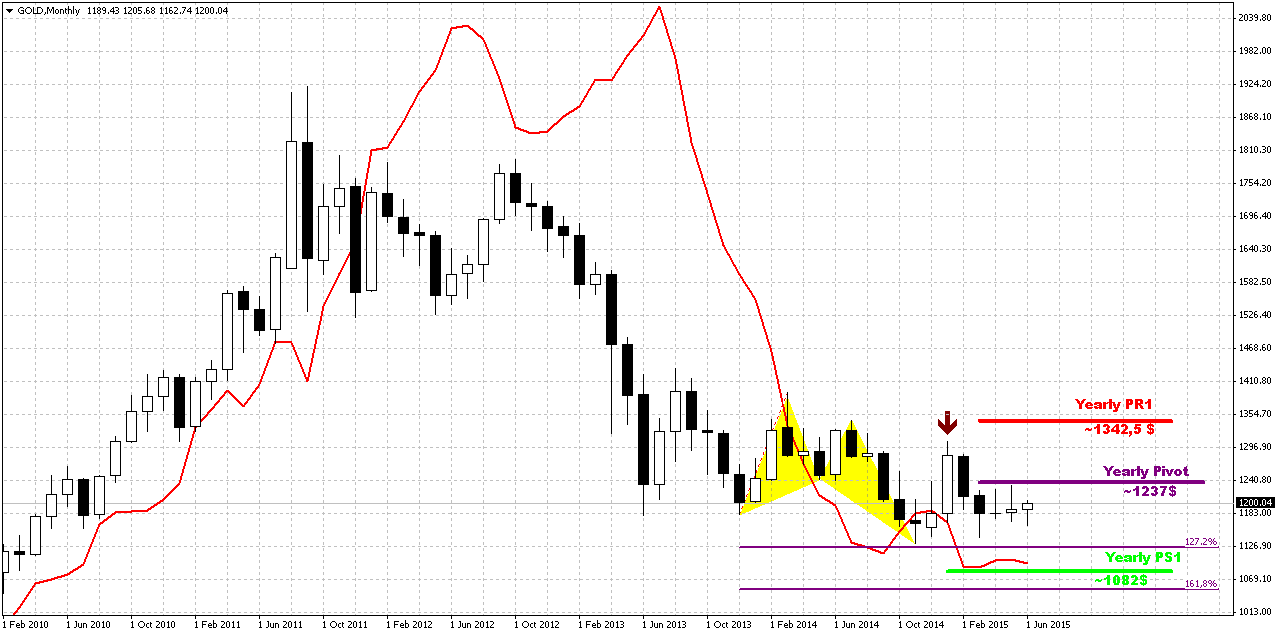
Monthly
Last week shows no impact on monthly chart despite solid upside action on daily time frame. Gold stands rather flat on monthly chart within 4 months in a row. Currently bearish dynamic pressure becomes very clear on this chart. It seems that gold just waits for some push. It means that as bearish dynamic pressure as VOB pattern are still valid.
On long-term horizon we still have last big pattern in progress that is Volatility breakout (VOB). It suggests at least 0.618 AB-CD down. And this target is 1050$. At the same time we need 1130 breakout to start clearly speak on 1050 target.
But what action market should show to break huge bearish patterns on monthly? Dynamic pressure is a tendency of lower highs within bullish trend. Hence, to break it, market should show higher high. I’ve marked it with arrow. It means that market should take out 1308 top to break this pattern and make investors doubt on bearish perspectives of gold market in long term. That’s why action that we have on daily and intraday charts right now is not an action of monthly one yet. Early bell of changing situation could be moving above YPP.
Overall picture still remains mostly bearish. In the beginning of the year market showed solid upside action. Gold was able to exceed yearly pivot, passed half way to Yearly Pivot resistance 1 but right now has reversed down and closed below YPP. From technical point of view this is bearish sign. This could be very significant moment and next logical destination will be yearly pivot support 1 around 1083$.
Currently, despite rare upside splashes in CFTC data, we couldn’t say yet that situation has changed drastically. We need to get few weeks of net long position increasing, to get positive dynamic on SPDR storages to get confidence with upside action. Other words, we need to get some proves that recent changes is not occasion. But right now we do not see any. Even more we see opposite signs.
Still right now gold mostly is hostage of dollar value and US economical data (mostly inflation) in nearest perspective. Approximately the same was announced by Fed in forecast on inflation and had become a reason of dovish approach to rate hiking. Another concern right now is too strong dollar that becomes a problem per se for economy growth and kills inflation. Prices are fallen so no needs to hike rates. Last week was a rumor about the same problem – it seems that Obama administration unsatisfied with too strong dollar and IMF was asking Fed to postpone rate hike on next year. We do not know whether these moments were become a reason of dovish tone in Fed comments or not, but result is the same. Fed has announced some worrying on employment and inflation and said that they need to get more strength in this data…
If we will take into consideration geopolitical situation and risks that have appeared recently, it could happen that situation will change, especially if situation in Ukraine will escalate and peaceful regulation will fail. Day by day we see worrying geopolitical news – Macedonia, Yemen, and Syria are to name some. Unfortunately the geopolicy is sphere where we can’t do much.
That’s being said, as gold has passed through 1200 and until it stands below 1308 top, our long-term next destination point is previous lows at 1130, but if gold will return to 1130 for second time – this is temporal destination and we should prepare for further downward action. Current upside action we should treat as retracement, although it could be really significant on lower time frames.
Weekly
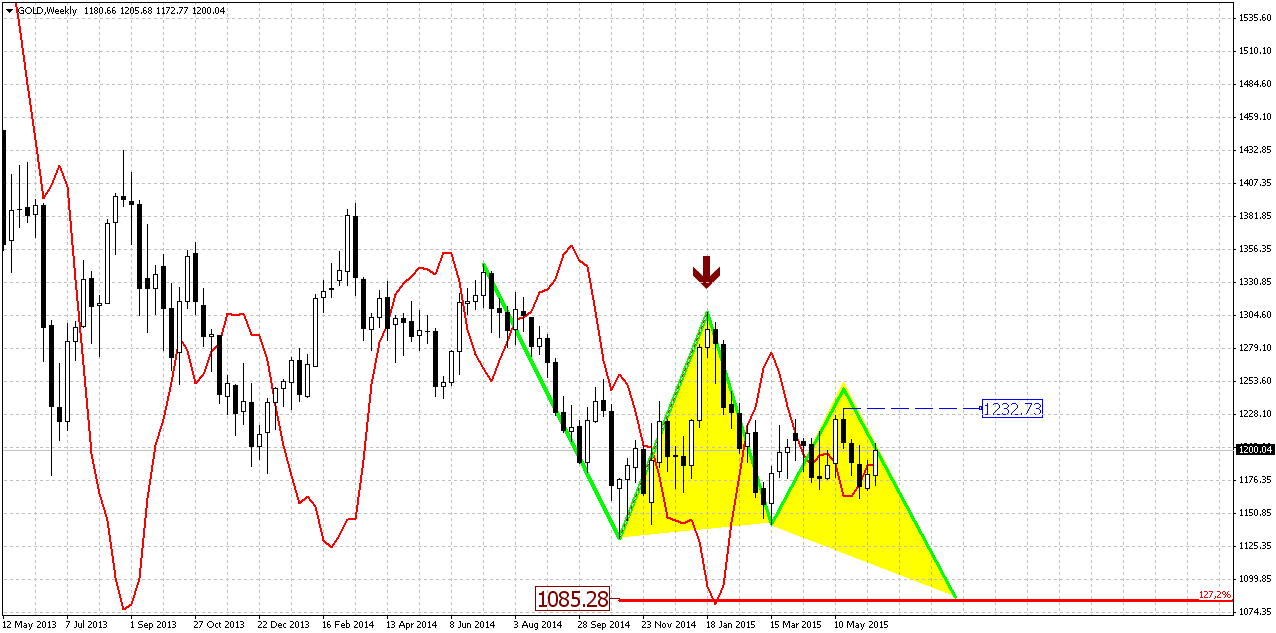
Weekly chart is not very important for us. Yes, trend has turned bullish here, but small white candle is too small event and it can’t make any valuable impact on overall picture. It gives no new patterns or signals. Mostly because market stands below 1232 level. If gold somehow will exceed it – then picture here also could change, while right now our analysis mostly stands the same.
Our major pattern here is still big butterfly. Speaking on targets, we have three different patterns that point on the same level. They are butterfly “buy”, AB=CD and the part of this AB-CD that takes “222” Sell shape.
Thus, all these patterns point at the same destination around 1080$. This level is special, because it coincides with YPS1.
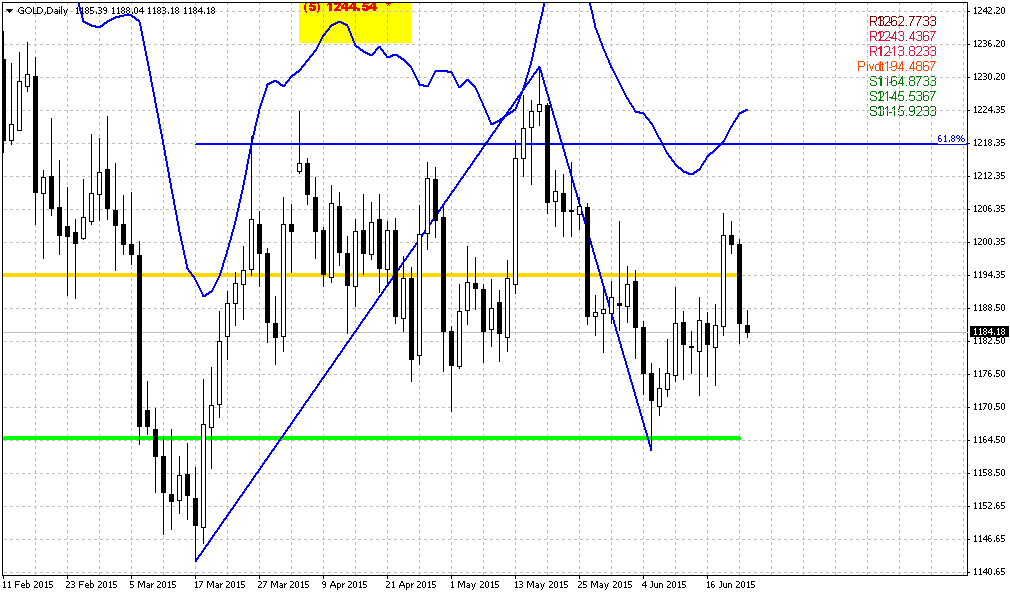
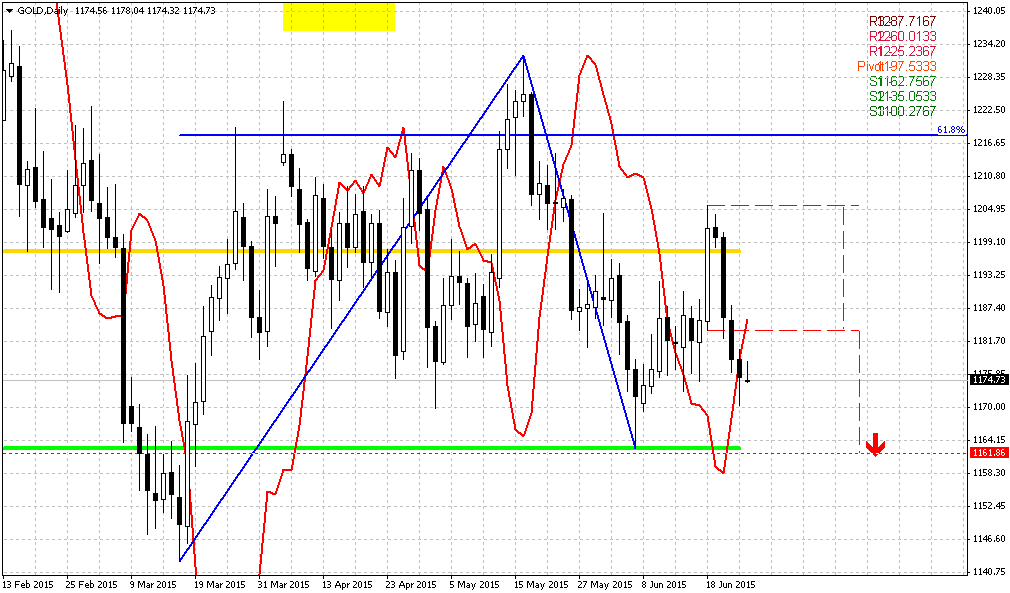
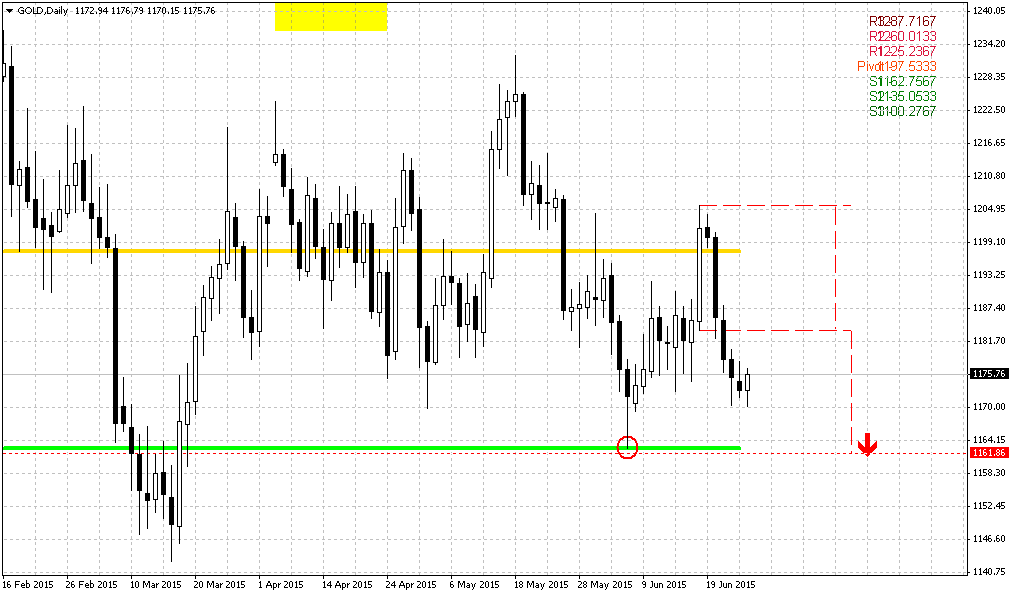
Daily
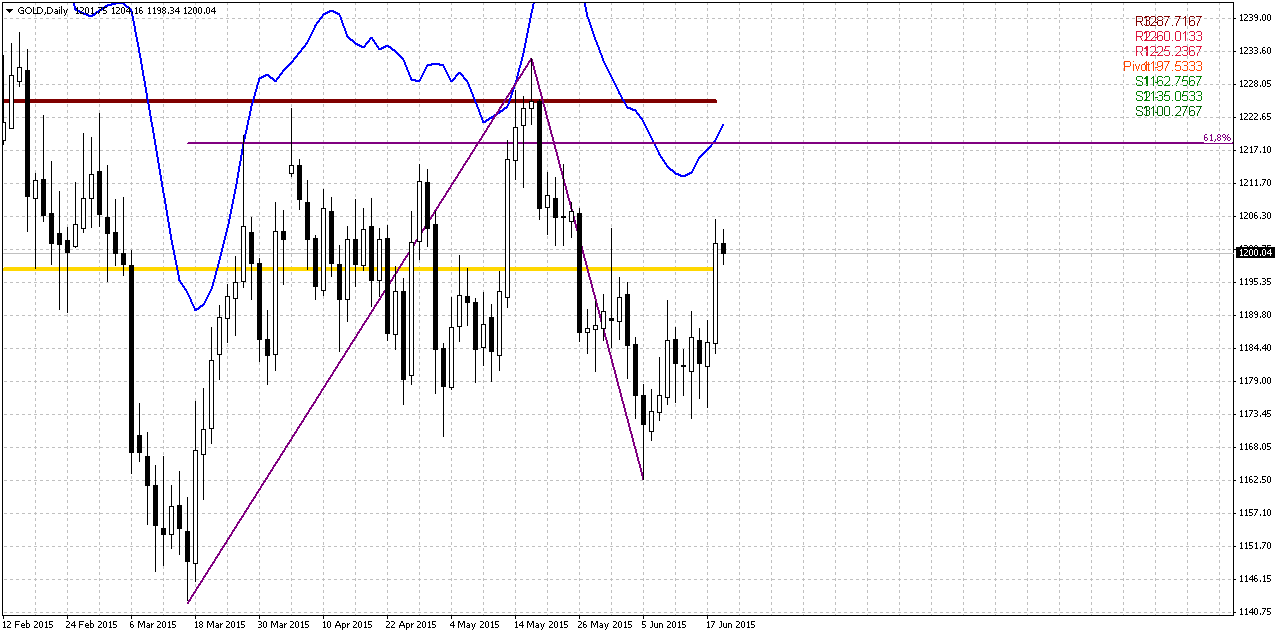
As long-term picture has not been changed by upside action, and probably will not be changed until gold will not exceed 1230 level, we should focus on daily and lower time frames. Here again we have to warn you on fragile background of current rally. This rally mostly stands on short covering and is not supported by any real purchases from investors. It means that it could stop on any time. And this, in turn, means that we should not marry any position, take fast profits on clear patterns and setups.
Here we need to estimate how far this retracement could go to upside. Daily picture shows that we have big AB-CD in progress and its nearest target stands around 1218 area. 1225 is MPR1 and daily overbought. Recent acceleration was nice, so may be market will reach it.
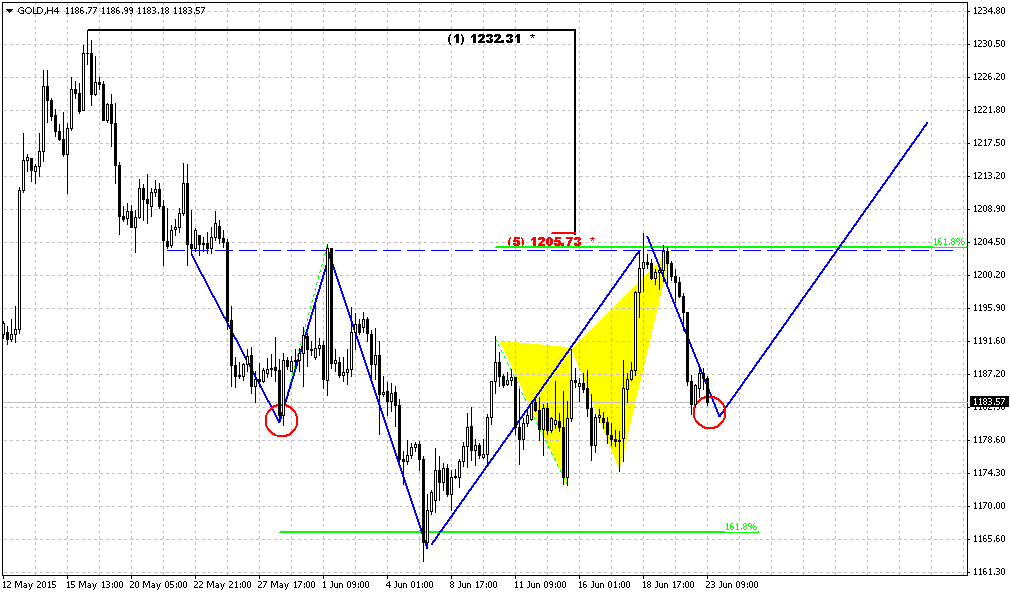
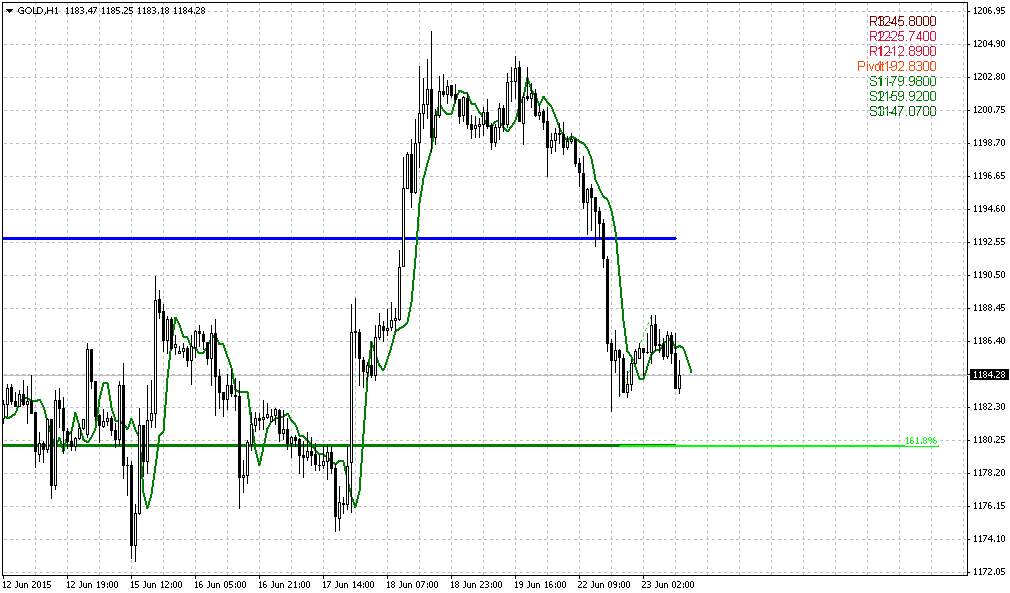
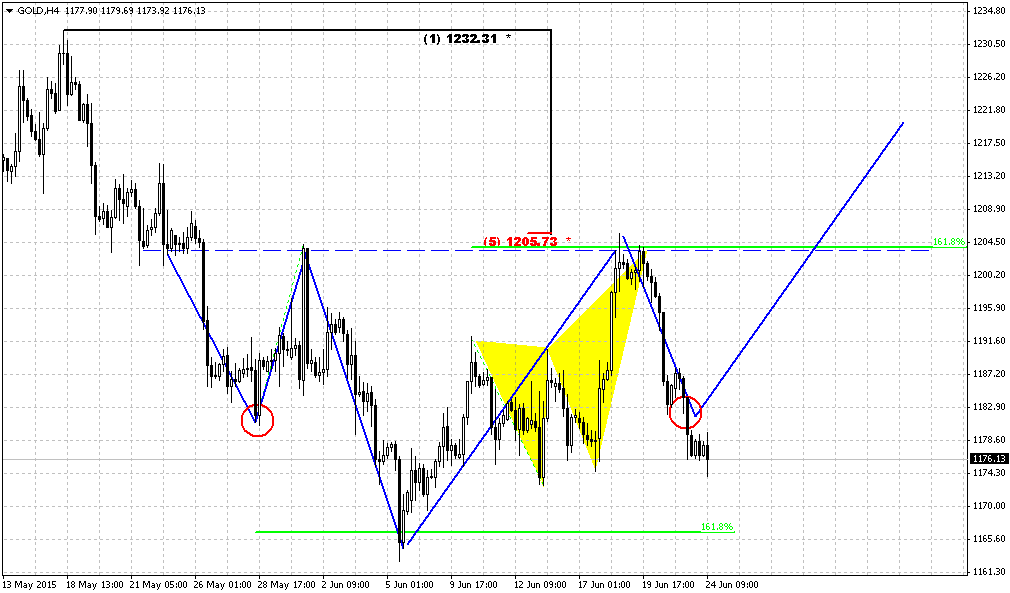
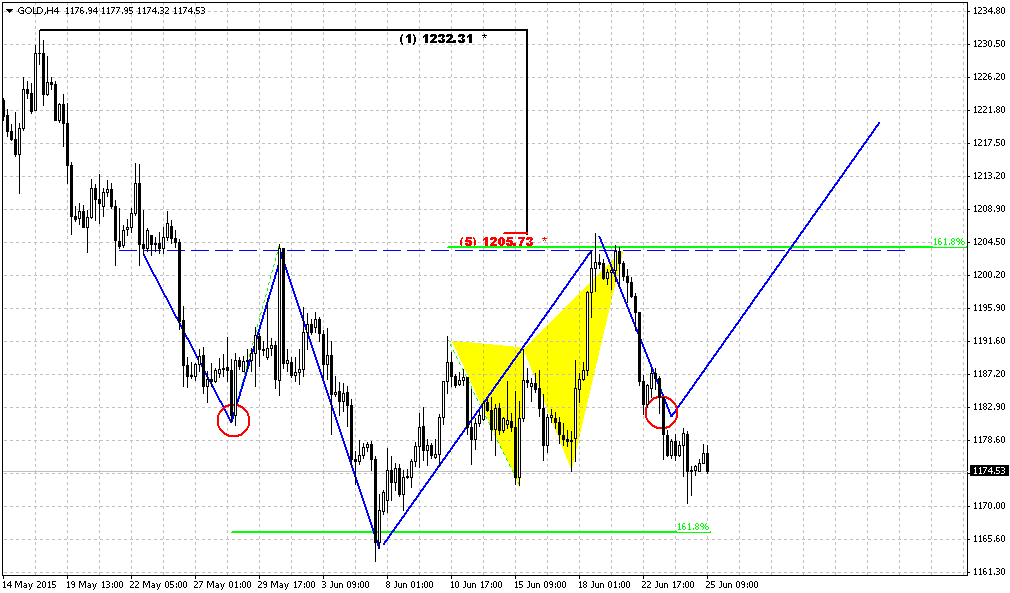
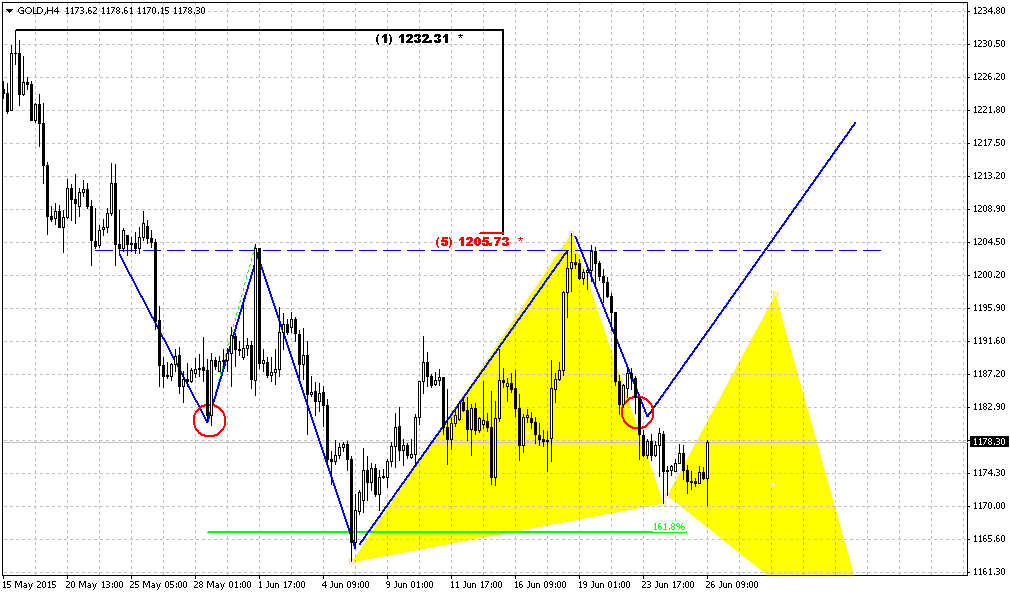
4-hour
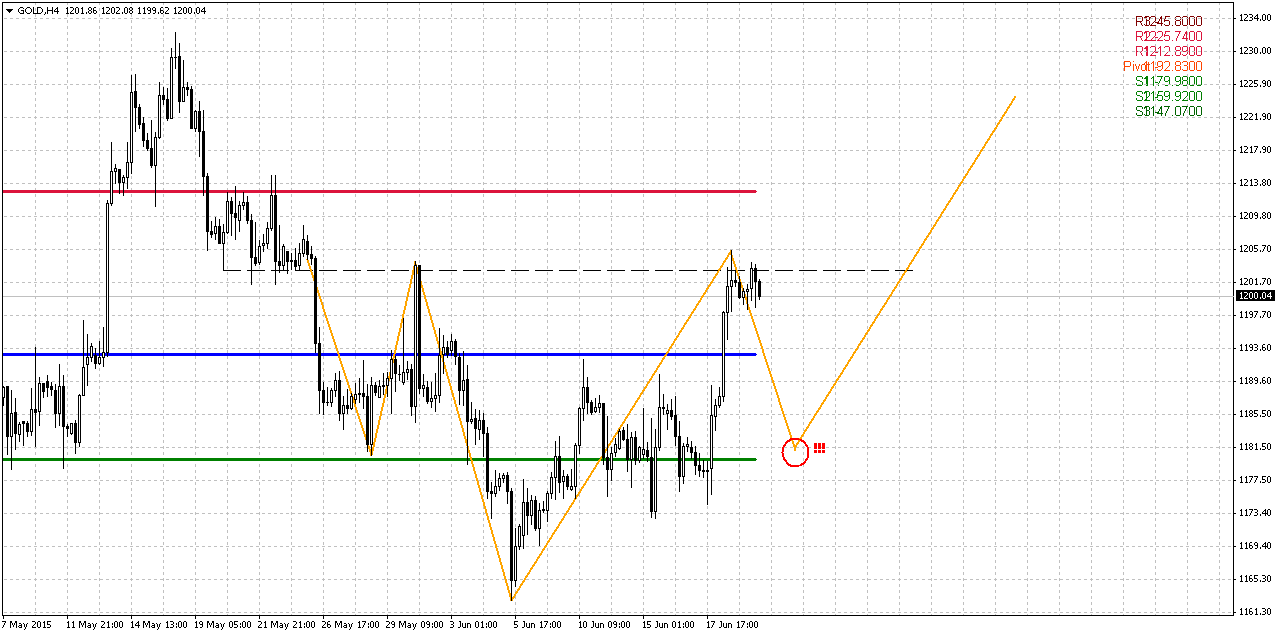
This time frame finalizes our analysis. As we’ve discussed on Friday, we could get reverse H&S pattern. Head looks a bit skewed, but this pattern shows good holding of 1.618 ratio between head and shoulder. If our suggestion is correct then right shoulder should appear somewhere around 1180 area. Thus, this is major point in our trading plan – wait for retracement down and watch for bullish reversal patterns there. This pattern also is useful from failure point of view. If, say, market will break through 1180 and H&S will fail – this will be definite signal of downward trend continuation. H&S target points at the same 1220 area, as daily targets.
Conclusion:
Long-term picture remains bearish and major patterns stand mostly intact.
On short-term charts market has turned to upside retracement as reaction on Fed dovish comments and Greece tensions. Technical picture suggests that retracement could continue a bit higher. But we can’t rely on it too much, since this upside action is not supported by real gold purchases from investors.
The technical portion of Sive's analysis owes a great deal to Joe DiNapoli's methods, and uses a number of Joe's proprietary indicators. Please note that Sive's analysis is his own view of the market and is not endorsed by Joe DiNapoli or any related companies.
Weekly Gold Tading Report prepared by Sive Morten exclusively for ForexPeaceArmy.com
Reuters reports euro declined against other major currencies on Friday, weighed down by anxieties Greece may soon default on debts that also drove safe-haven buying of the dollar.
Greece is days away from potentially missing debt repayments of 1.6 billion euros to the International Monetary Fund, and investors are looking to an emergency meeting next week where euro zone leaders will try to find a way to unlock aid for Athens.
Germany, the biggest European contributor to bailout programs that have kept Greece afloat for five years, insisted it still was not too late for Athens to come to terms with its creditors at the EU and IMF.
The European Central Bank on Friday raised the ceiling on emergency liquidity that Greek banks can draw from the country's central bank for the second time this week, a banking source told Reuters.
Bankers told Reuters that about 4.2 billion euros had flooded out of Greek bank accounts this week despite central bank efforts to restore calm.
"Greece remains highly combustible, and that's a recipe for dollar strength and risk aversion," said Richard Franulovich, senior currency strategist at Westpac in New York.
The dollar has been rallying for nearly a year but this week was on track for a third consecutive week of losses. Some analysts still see the dollar climbing.
"When we get to where we can see the white of the eyes of the Fed rate hike, we will have a second wave of the dollar rally," said Greg Anderson, global head of FX strategy at BMO Capital Markets in New York.
Recent CFTC data shows increase in open interest again mostly due increasing of speculative short positions. Although longs also has increased, short positions has increased on greater value. The same has happened with hedgers’ position. Longs has increased greater than shorts and this data mostly supports existing bear trend on the market, despite most recent upside action.
SPDR fund has lost another 3 tonnes on storages last week. Now they stand around 702 tonnes. This progress stands in the same stream as CFTC numbers. Although the pace of decreasing has slowed a bit, but still fund is losing value even on upside gold action that we’ve seen last week.
Here is detailed breakdown of speculative positions:
Open interest:
Monthly
Last week shows no impact on monthly chart despite solid upside action on daily time frame. Gold stands rather flat on monthly chart within 4 months in a row. Currently bearish dynamic pressure becomes very clear on this chart. It seems that gold just waits for some push. It means that as bearish dynamic pressure as VOB pattern are still valid.
On long-term horizon we still have last big pattern in progress that is Volatility breakout (VOB). It suggests at least 0.618 AB-CD down. And this target is 1050$. At the same time we need 1130 breakout to start clearly speak on 1050 target.
But what action market should show to break huge bearish patterns on monthly? Dynamic pressure is a tendency of lower highs within bullish trend. Hence, to break it, market should show higher high. I’ve marked it with arrow. It means that market should take out 1308 top to break this pattern and make investors doubt on bearish perspectives of gold market in long term. That’s why action that we have on daily and intraday charts right now is not an action of monthly one yet. Early bell of changing situation could be moving above YPP.
Overall picture still remains mostly bearish. In the beginning of the year market showed solid upside action. Gold was able to exceed yearly pivot, passed half way to Yearly Pivot resistance 1 but right now has reversed down and closed below YPP. From technical point of view this is bearish sign. This could be very significant moment and next logical destination will be yearly pivot support 1 around 1083$.
Currently, despite rare upside splashes in CFTC data, we couldn’t say yet that situation has changed drastically. We need to get few weeks of net long position increasing, to get positive dynamic on SPDR storages to get confidence with upside action. Other words, we need to get some proves that recent changes is not occasion. But right now we do not see any. Even more we see opposite signs.
Still right now gold mostly is hostage of dollar value and US economical data (mostly inflation) in nearest perspective. Approximately the same was announced by Fed in forecast on inflation and had become a reason of dovish approach to rate hiking. Another concern right now is too strong dollar that becomes a problem per se for economy growth and kills inflation. Prices are fallen so no needs to hike rates. Last week was a rumor about the same problem – it seems that Obama administration unsatisfied with too strong dollar and IMF was asking Fed to postpone rate hike on next year. We do not know whether these moments were become a reason of dovish tone in Fed comments or not, but result is the same. Fed has announced some worrying on employment and inflation and said that they need to get more strength in this data…
If we will take into consideration geopolitical situation and risks that have appeared recently, it could happen that situation will change, especially if situation in Ukraine will escalate and peaceful regulation will fail. Day by day we see worrying geopolitical news – Macedonia, Yemen, and Syria are to name some. Unfortunately the geopolicy is sphere where we can’t do much.
That’s being said, as gold has passed through 1200 and until it stands below 1308 top, our long-term next destination point is previous lows at 1130, but if gold will return to 1130 for second time – this is temporal destination and we should prepare for further downward action. Current upside action we should treat as retracement, although it could be really significant on lower time frames.
Weekly
Weekly chart is not very important for us. Yes, trend has turned bullish here, but small white candle is too small event and it can’t make any valuable impact on overall picture. It gives no new patterns or signals. Mostly because market stands below 1232 level. If gold somehow will exceed it – then picture here also could change, while right now our analysis mostly stands the same.
Our major pattern here is still big butterfly. Speaking on targets, we have three different patterns that point on the same level. They are butterfly “buy”, AB=CD and the part of this AB-CD that takes “222” Sell shape.
Thus, all these patterns point at the same destination around 1080$. This level is special, because it coincides with YPS1.
Daily
As long-term picture has not been changed by upside action, and probably will not be changed until gold will not exceed 1230 level, we should focus on daily and lower time frames. Here again we have to warn you on fragile background of current rally. This rally mostly stands on short covering and is not supported by any real purchases from investors. It means that it could stop on any time. And this, in turn, means that we should not marry any position, take fast profits on clear patterns and setups.
Here we need to estimate how far this retracement could go to upside. Daily picture shows that we have big AB-CD in progress and its nearest target stands around 1218 area. 1225 is MPR1 and daily overbought. Recent acceleration was nice, so may be market will reach it.
4-hour
This time frame finalizes our analysis. As we’ve discussed on Friday, we could get reverse H&S pattern. Head looks a bit skewed, but this pattern shows good holding of 1.618 ratio between head and shoulder. If our suggestion is correct then right shoulder should appear somewhere around 1180 area. Thus, this is major point in our trading plan – wait for retracement down and watch for bullish reversal patterns there. This pattern also is useful from failure point of view. If, say, market will break through 1180 and H&S will fail – this will be definite signal of downward trend continuation. H&S target points at the same 1220 area, as daily targets.
Conclusion:
Long-term picture remains bearish and major patterns stand mostly intact.
On short-term charts market has turned to upside retracement as reaction on Fed dovish comments and Greece tensions. Technical picture suggests that retracement could continue a bit higher. But we can’t rely on it too much, since this upside action is not supported by real gold purchases from investors.
The technical portion of Sive's analysis owes a great deal to Joe DiNapoli's methods, and uses a number of Joe's proprietary indicators. Please note that Sive's analysis is his own view of the market and is not endorsed by Joe DiNapoli or any related companies.