Sive Morten
Special Consultant to the FPA
- Messages
- 18,695
Fundamentals
Weekly Gold Tading Report prepared by Sive Morten exclusively for ForexPeaceArmy.com
Reuters reports Gold was little changed on Friday, after falling to a three-week low, on short-covering at the end of the week and caution ahead of crunch talks on Greece this weekend, while concerns over the longer-term outlook for the metal provided price pressure.
Greece failed again to clinch a deal with its international creditors on Thursday, setting up a last-ditch effort on Saturday either to avert a default next week or start preparing to protect the euro zone from financial market turmoil.
"It's just drifting higher," said one U.S. trader, adding that end-of-the-week short-covering combined with a lack of offers as the end of the quarter approaches, helped prices turn slightly higher.
Signs of possible agreement soon between Greece and its creditors steadied world stock markets and sent U.S. bond yields to nine-month highs by curbing demand for safe-haven U.S. debt.
Expectations that U.S. interest rates will rise for the first time in nearly a decade this year, lifting the U.S. currency and boosting the opportunity cost of holding non-yielding bullion, have pressured gold, keeping it in a range.
Gold has held largely between $1,160 and $1,230 since mid-March, struggling to break higher despite an ostensibly bullish rise in tensions over Greece.
It has drawn some support from a rise in holdings of gold-backed exchange-traded funds, which issue securities backed by physical metal, this week after outflows earlier this year.
Holdings of the biggest gold ETF, SPDR Gold Shares , rose 6.9 tonnes on Thursday, their biggest one-day increase since Feb. 2.
Silver was down 0.6 percent at $15.77 an ounce, having briefly touched a three-month low of $15.50. Platinum was down 0.5 percent at $1,075.99 an ounce, while palladium was up 0.1 percent at $678.22 an ounce.
"The industrial demand is light and there's a lot of recycling," the U.S. trader said, noting chart-based weakness as well.
Palladium fell to a two-year low at $666.82 in earlier trade and fell for the seventh straight week.
"While short-term moves are driven by many factors and the metal faces a number of challenges, we think the underlying weakness is due to a sharp slowdown in global auto sales growth," Macquarie said in a note.
Recent CFTC data shows increase in open interest and this increase mostly stands not in favor of peaceful compromise in Greek question. Speculators have increased long position, while short one mostly stands flat and even has decreased slightly. SPDR Fund also shows solid inflow last week. Although it is not necessary will lead to gradual upside trend, it could be just fast short-term reaction. But it also shows that investors see that agreement between EU and Greece is not as close as it is shown in mass media.
Here is detailed breakdown of speculative positions:
Open interest:
 Shorts:
 Longs:
 Summary:
As Gold also depends significantly on Greece solution, we suggest you to read our thoughts on this subject here:
https://www.forexpeacearmy.com/forex-forum/sive-morten-analysis/40833-forex-pro-weekly-june-29-03-2015-a.html
Technicals
Monthly
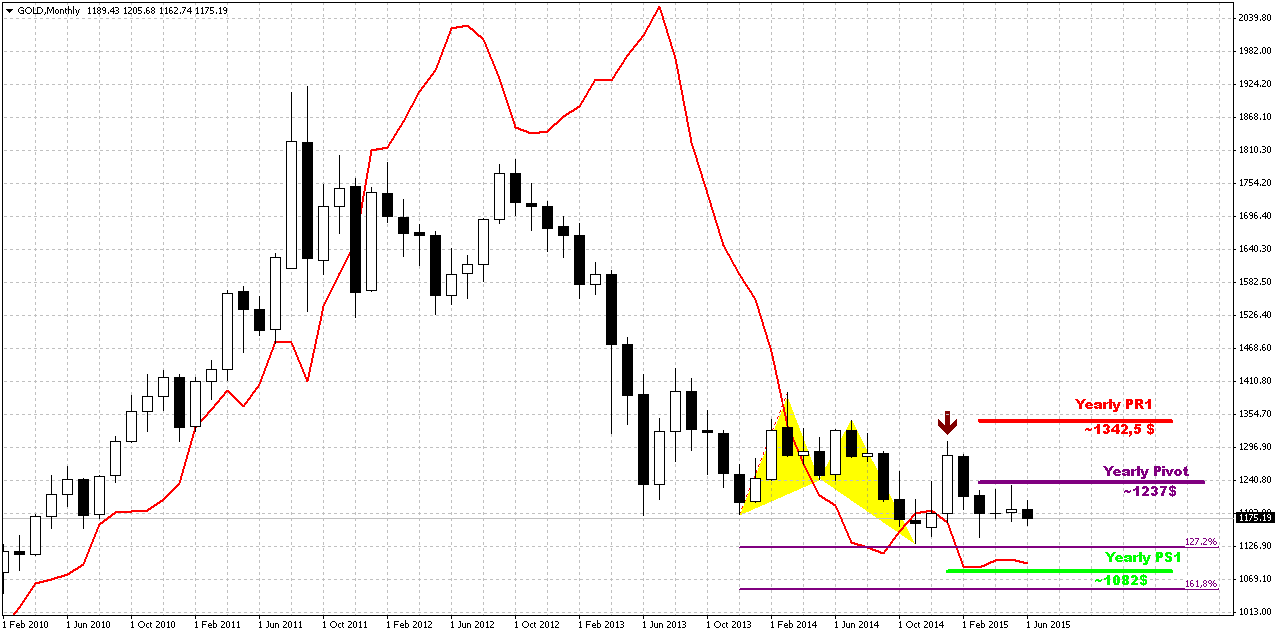
Last week shows no impact on monthly chart. Gold stands rather flat on monthly chart within 4 months in a row. Currently bearish dynamic pressure becomes very clear on this chart. It seems that gold just waits for some push. It means that as bearish dynamic pressure as VOB pattern are still valid.
On long-term horizon we still have last big pattern in progress that is Volatility breakout (VOB). It suggests at least 0.618 AB-CD down. And this target is 1050$. At the same time we need 1130 breakout to start clearly speak on 1050 target.
But what action market should show to break huge bearish patterns on monthly? Dynamic pressure is a tendency of lower highs within bullish trend. Hence, to break it, market should show higher high. I’ve marked it with arrow. It means that market should take out 1308 top to break this pattern and make investors doubt on bearish perspectives of gold market in long term. That’s why action that we have on daily and intraday charts right now is not an action of monthly one yet. Early bell of changing situation could be moving above YPP.
Overall picture still remains mostly bearish. In the beginning of the year market showed solid upside action. Gold was able to exceed yearly pivot, passed half way to Yearly Pivot resistance 1 but right now has reversed down and closed below YPP. From technical point of view this is bearish sign. This could be very significant moment and next logical destination will be yearly pivot support 1 around 1083$.
Currently, despite rare upside splashes in CFTC data, we couldn’t say yet that situation has changed drastically. We need to get few weeks of net long position increasing, to get positive dynamic on SPDR storages to get confidence with upside action. Other words, we need to get some proves that recent changes is not occasion. Last week data shows increasing as net long position as storages, but they are mostly driven by Greece hazard and investors are trying to hedge some risks, but not some drastical and fundamental reversal on gold market.
Still right now gold mostly is hostage of dollar value and US economical data (mostly inflation) in nearest perspective. Approximately the same was announced by Fed in forecast on inflation and had become a reason of dovish approach to rate hiking. Another concern right now is too strong dollar that becomes a problem per se for economy growth and kills inflation. Prices are fallen so no needs to hike rates. Last week was a rumor about the same problem – it seems that Obama administration unsatisfied with too strong dollar and IMF was asking Fed to postpone rate hike on next year. We do not know whether these moments were become a reason of dovish tone in Fed comments or not, but result is the same. Fed has announced some worrying on employment and inflation and said that they need to get more strength in this data…
If we will take into consideration geopolitical situation and risks that have appeared recently, it could happen that situation will change, especially if situation in Ukraine will escalate and peaceful regulation will fail. Day by day we see worrying geopolitical news – Macedonia, Yemen, and Syria are to name some. Unfortunately the geopolicy is sphere where we can’t do much.
That’s being said, as gold has passed through 1200 and until it stands below 1308 top, our long-term next destination point is previous lows at 1130, but if gold will return to 1130 for second time – this is temporal destination and we should prepare for further downward action. Current upside action we should treat as retracement, although it could be really significant on lower time frames.
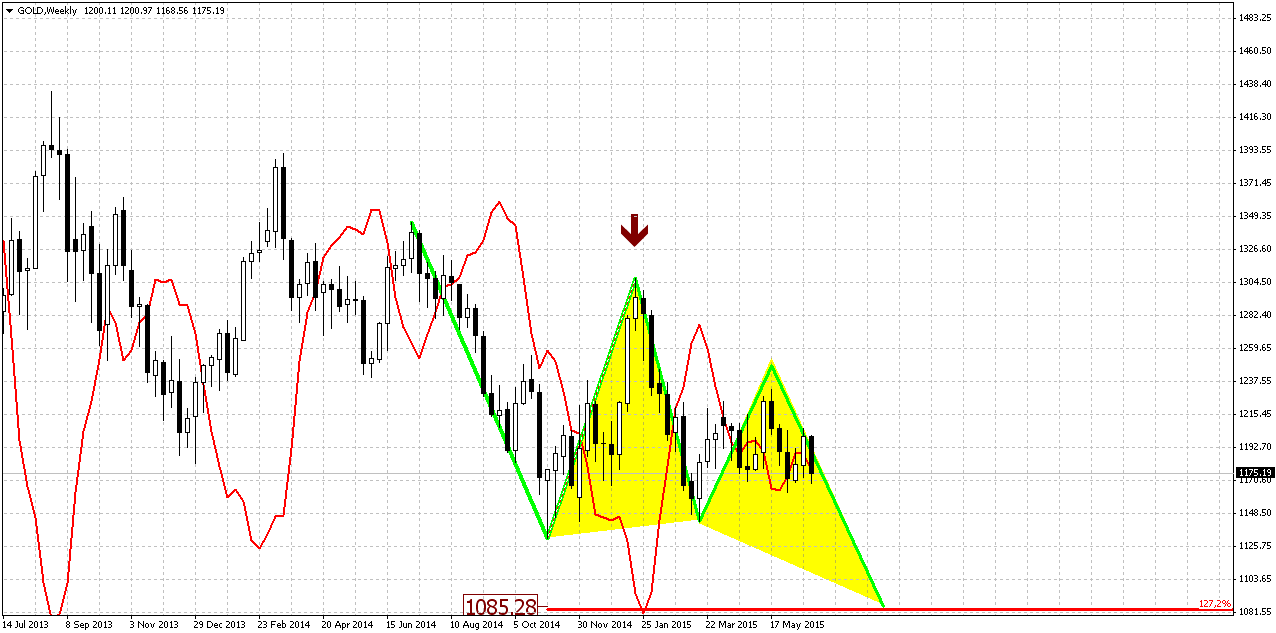
Weekly
Situation on weekly chart also has changed rather fast. Only last week we’ve discussed upside potential and how far market could move to the upside.
But on previous week trend has turned bearish again. Sometimes I call this kind of action as “2-day stop grabber”. This is not invention of DiNapoli, but I saw many times when market shifts trend and on next candle return it back – it very often works as grabber. This is easily could be explained – if you will increase time frame for 2 times you’ll get the grabber there. Anyway, here we could get something of that sort. Besides, take a look at action April. Trend mostly holds bullish, but price action is not, gold can’t start upside action. This could be the sign of market’s weakness.
Our major pattern here is still big butterfly. Speaking on targets, we have three different patterns that point on the same level. They are butterfly “buy”, AB=CD and the part of this AB-CD that takes “222” Sell shape.
Thus, all these patterns point at the same destination around 1080$. This level is special, because it coincides with YPS1.
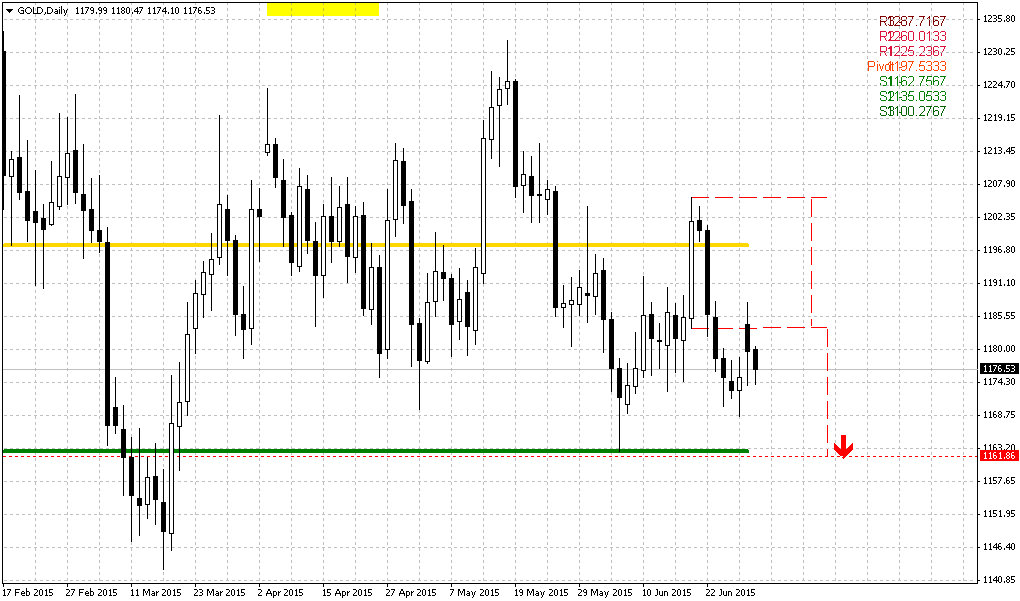
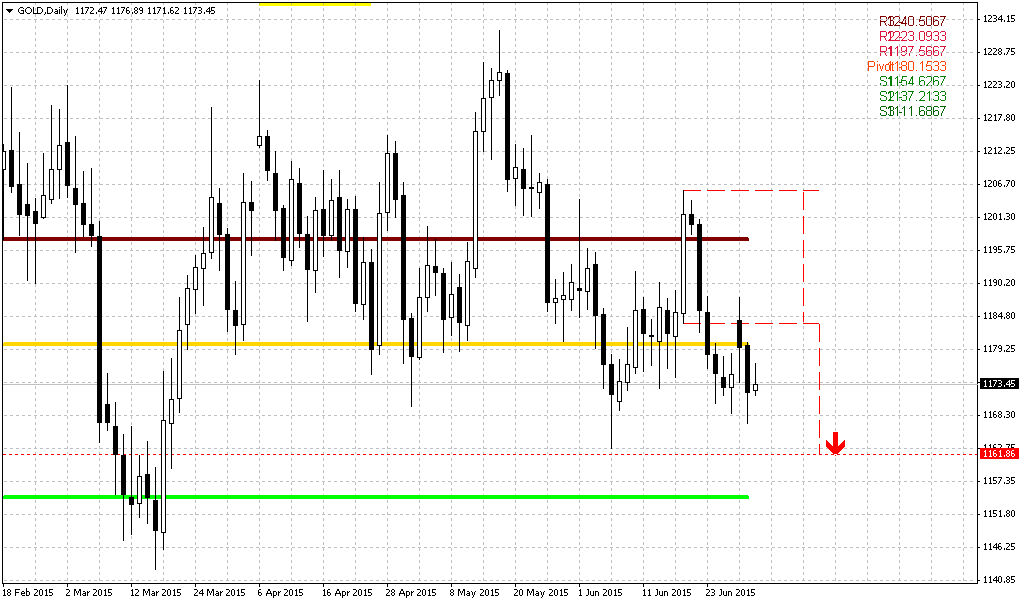
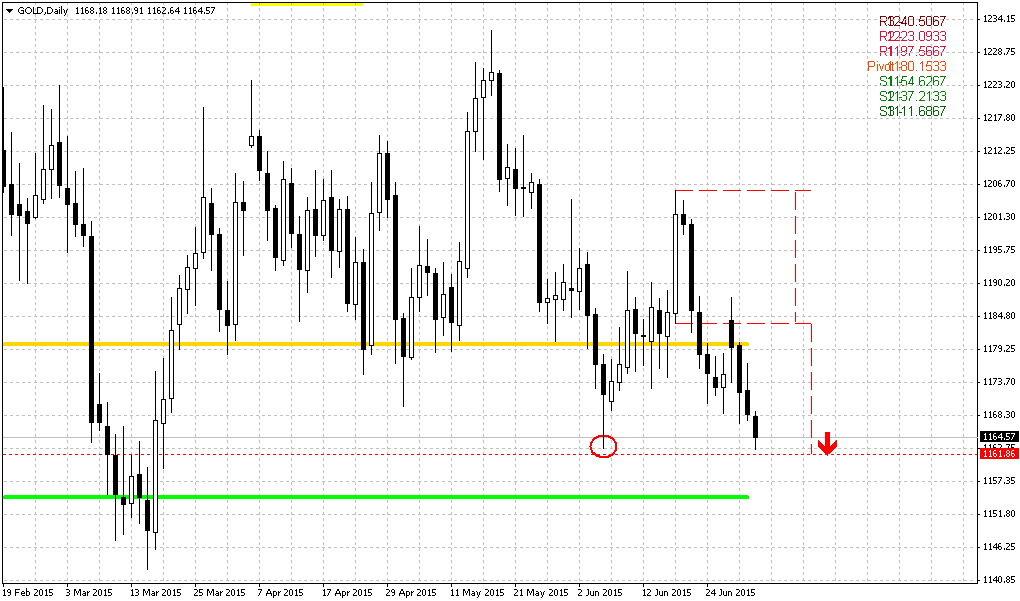
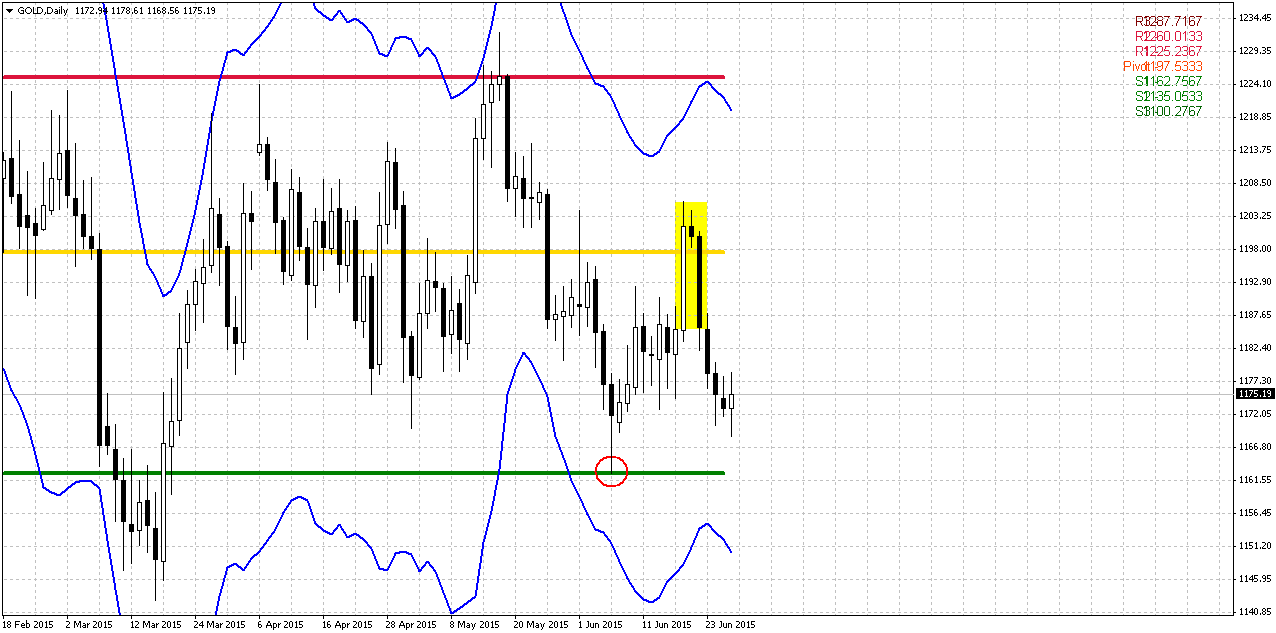
Daily
Trend is bearish here. Daily picture barely has changed and we have said everything on Friday. Our short-term target is still the same and it is based on large evening star pattern that points on 1160 level. At the same time this level will be important by many reasons. This is, in fact, an edge between upside and downside AB-CD’s. If market will drop below it – it will erase the former and trigger the latter. Any target below 1160, which is 1150, 1130 – they are just temporal, since market is returning back to them second time within a year. It means that all of them probably will be broken and real destination of the market is our long-term target 1050-1080.
Meantime, if there will be no peaceful solution on Greece we assume that gold turn to short-term upside rally, but hardly this rally will lead to major reversal on the market. For example we could get butterfly “Sell” based on most recent swing down, or even action of shyer scale. As we said in our FX research – before taking any position, it will be better to wait result on Greece question. It should come on Monday.
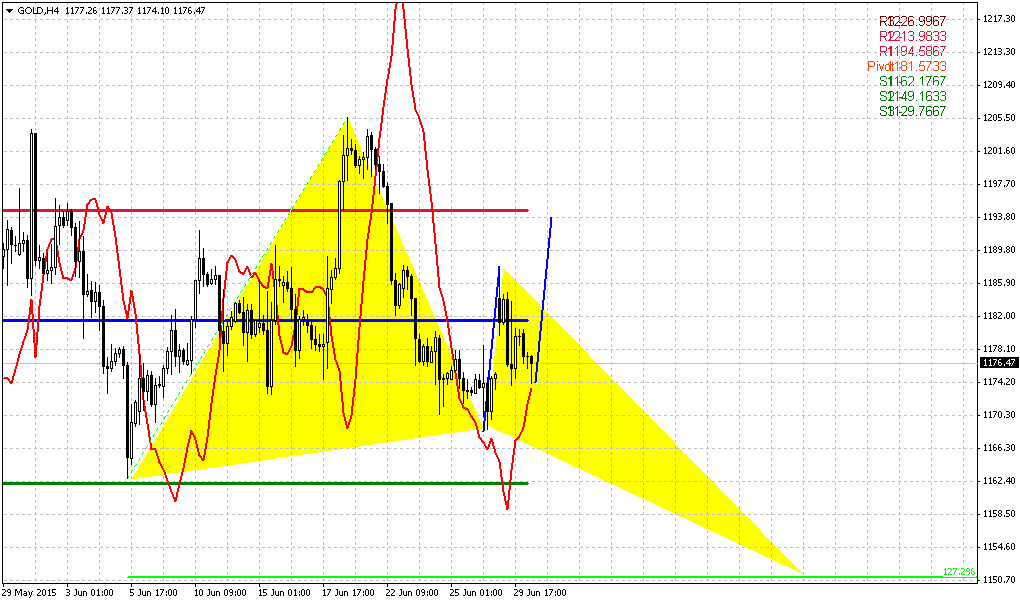
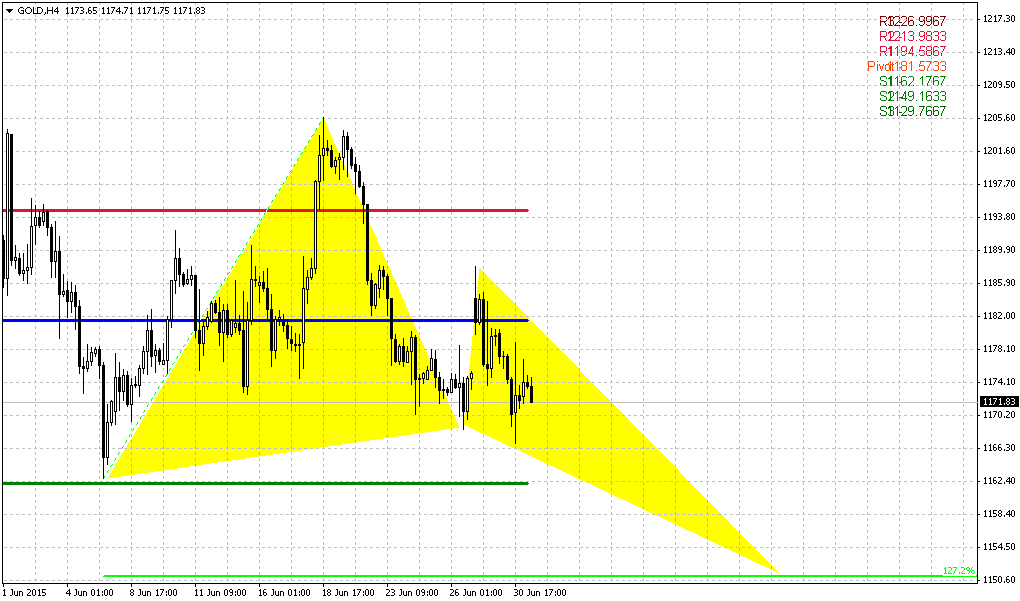
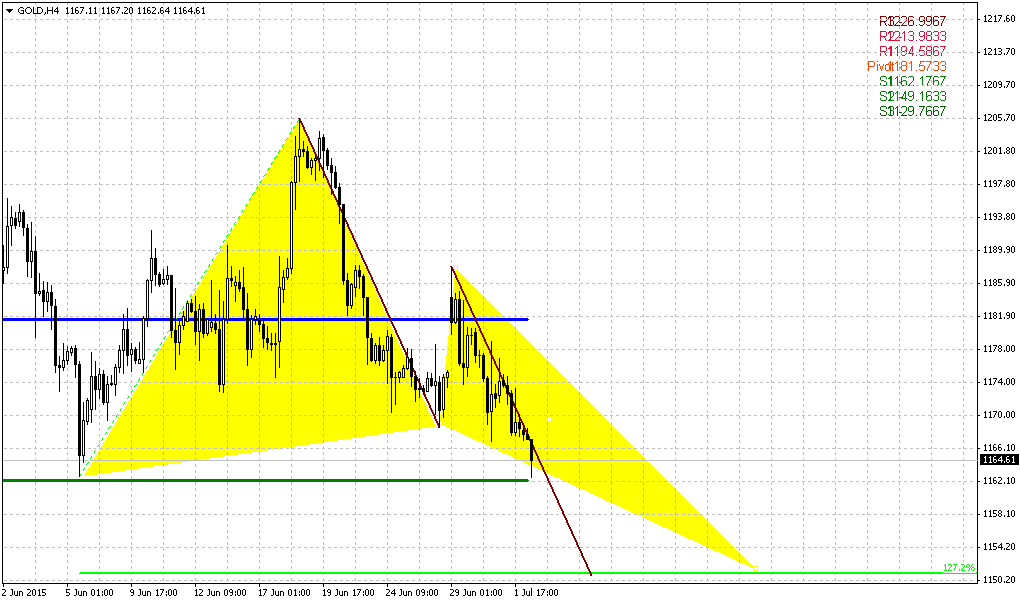
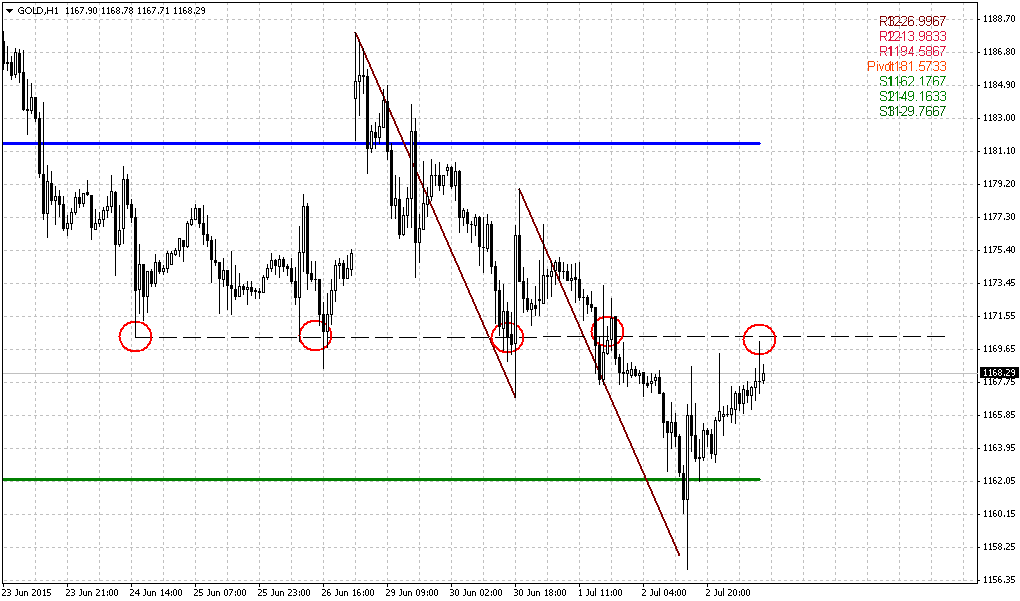
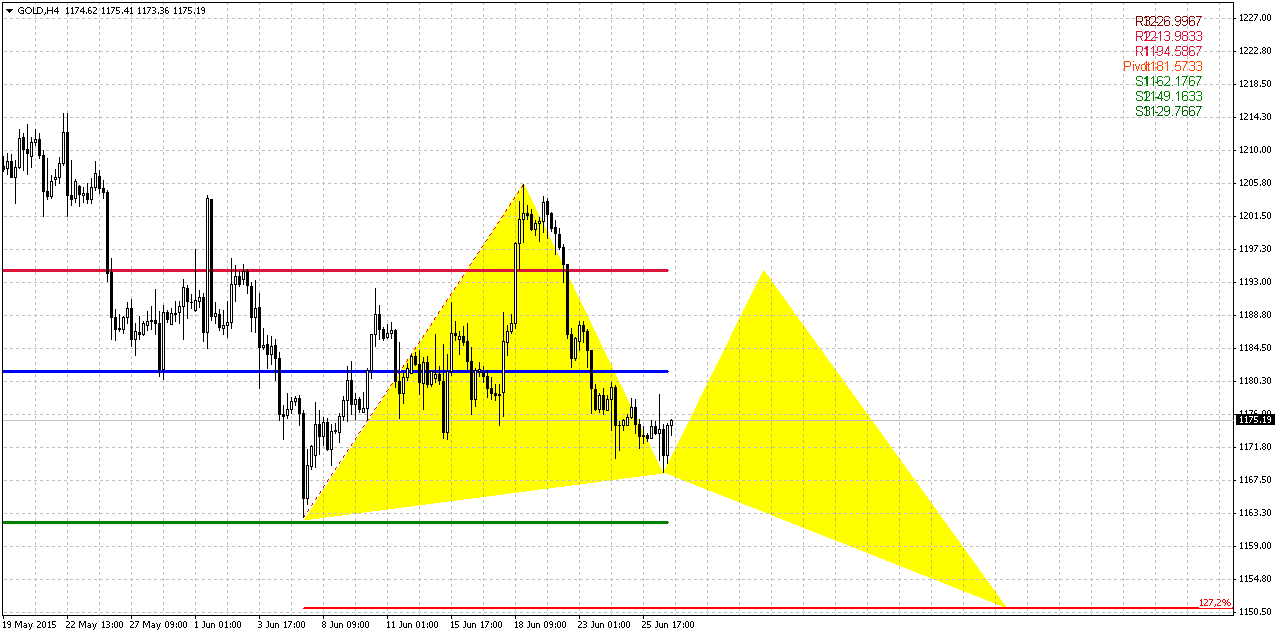
4-hour
If market will not be able to form large butterfly, and reaction on Greece demarche will be mild, in this case gold could try to form this butterfly and show upside action just to WPR1. The failure of H&S that we’ve discussed last week, also looks as bearish sign that decreases chances on upside reversal. Still, all scenarios that we’ve discussed here are mostly just an assumption, because real driving factor right now is Greece.
Conclusion:
Long-term picture remains bearish and major patterns stand mostly intact. Our long-term target still stands at 1050-1080 area. We do not exclude scenario with possible upside action if Greece default will happen on Monday but we think that hardly this event drastically will change the tendency. Other words speaking, we accept idea of possible upside action, may be it even could be significant, but this action hardly will break long-term bearish trend and sentiment. Reaction on Greece default could be strong, but probably it will not be long-term. Greece problem was discussing for a long period already and negative result probably partially was priced in already.
On short-term charts market could show different reaction in a case of Greece default. It could be stronger and lead to big butterfly on daily chart or, vice versa, it could be shyer and price could stop around WPR1… Anyway, as Greece situation should be resolved on Monday, despite the way how it will be resolved, we mostly call to not take any position until it will happen.
The technical portion of Sive's analysis owes a great deal to Joe DiNapoli's methods, and uses a number of Joe's proprietary indicators. Please note that Sive's analysis is his own view of the market and is not endorsed by Joe DiNapoli or any related companies.
Weekly Gold Tading Report prepared by Sive Morten exclusively for ForexPeaceArmy.com
Reuters reports Gold was little changed on Friday, after falling to a three-week low, on short-covering at the end of the week and caution ahead of crunch talks on Greece this weekend, while concerns over the longer-term outlook for the metal provided price pressure.
Greece failed again to clinch a deal with its international creditors on Thursday, setting up a last-ditch effort on Saturday either to avert a default next week or start preparing to protect the euro zone from financial market turmoil.
"It's just drifting higher," said one U.S. trader, adding that end-of-the-week short-covering combined with a lack of offers as the end of the quarter approaches, helped prices turn slightly higher.
Signs of possible agreement soon between Greece and its creditors steadied world stock markets and sent U.S. bond yields to nine-month highs by curbing demand for safe-haven U.S. debt.
Expectations that U.S. interest rates will rise for the first time in nearly a decade this year, lifting the U.S. currency and boosting the opportunity cost of holding non-yielding bullion, have pressured gold, keeping it in a range.
Gold has held largely between $1,160 and $1,230 since mid-March, struggling to break higher despite an ostensibly bullish rise in tensions over Greece.
It has drawn some support from a rise in holdings of gold-backed exchange-traded funds, which issue securities backed by physical metal, this week after outflows earlier this year.
Holdings of the biggest gold ETF, SPDR Gold Shares , rose 6.9 tonnes on Thursday, their biggest one-day increase since Feb. 2.
Silver was down 0.6 percent at $15.77 an ounce, having briefly touched a three-month low of $15.50. Platinum was down 0.5 percent at $1,075.99 an ounce, while palladium was up 0.1 percent at $678.22 an ounce.
"The industrial demand is light and there's a lot of recycling," the U.S. trader said, noting chart-based weakness as well.
Palladium fell to a two-year low at $666.82 in earlier trade and fell for the seventh straight week.
"While short-term moves are driven by many factors and the metal faces a number of challenges, we think the underlying weakness is due to a sharp slowdown in global auto sales growth," Macquarie said in a note.
Recent CFTC data shows increase in open interest and this increase mostly stands not in favor of peaceful compromise in Greek question. Speculators have increased long position, while short one mostly stands flat and even has decreased slightly. SPDR Fund also shows solid inflow last week. Although it is not necessary will lead to gradual upside trend, it could be just fast short-term reaction. But it also shows that investors see that agreement between EU and Greece is not as close as it is shown in mass media.
Here is detailed breakdown of speculative positions:
Open interest:
As Gold also depends significantly on Greece solution, we suggest you to read our thoughts on this subject here:
https://www.forexpeacearmy.com/forex-forum/sive-morten-analysis/40833-forex-pro-weekly-june-29-03-2015-a.html
Technicals
Monthly
Last week shows no impact on monthly chart. Gold stands rather flat on monthly chart within 4 months in a row. Currently bearish dynamic pressure becomes very clear on this chart. It seems that gold just waits for some push. It means that as bearish dynamic pressure as VOB pattern are still valid.
On long-term horizon we still have last big pattern in progress that is Volatility breakout (VOB). It suggests at least 0.618 AB-CD down. And this target is 1050$. At the same time we need 1130 breakout to start clearly speak on 1050 target.
But what action market should show to break huge bearish patterns on monthly? Dynamic pressure is a tendency of lower highs within bullish trend. Hence, to break it, market should show higher high. I’ve marked it with arrow. It means that market should take out 1308 top to break this pattern and make investors doubt on bearish perspectives of gold market in long term. That’s why action that we have on daily and intraday charts right now is not an action of monthly one yet. Early bell of changing situation could be moving above YPP.
Overall picture still remains mostly bearish. In the beginning of the year market showed solid upside action. Gold was able to exceed yearly pivot, passed half way to Yearly Pivot resistance 1 but right now has reversed down and closed below YPP. From technical point of view this is bearish sign. This could be very significant moment and next logical destination will be yearly pivot support 1 around 1083$.
Currently, despite rare upside splashes in CFTC data, we couldn’t say yet that situation has changed drastically. We need to get few weeks of net long position increasing, to get positive dynamic on SPDR storages to get confidence with upside action. Other words, we need to get some proves that recent changes is not occasion. Last week data shows increasing as net long position as storages, but they are mostly driven by Greece hazard and investors are trying to hedge some risks, but not some drastical and fundamental reversal on gold market.
Still right now gold mostly is hostage of dollar value and US economical data (mostly inflation) in nearest perspective. Approximately the same was announced by Fed in forecast on inflation and had become a reason of dovish approach to rate hiking. Another concern right now is too strong dollar that becomes a problem per se for economy growth and kills inflation. Prices are fallen so no needs to hike rates. Last week was a rumor about the same problem – it seems that Obama administration unsatisfied with too strong dollar and IMF was asking Fed to postpone rate hike on next year. We do not know whether these moments were become a reason of dovish tone in Fed comments or not, but result is the same. Fed has announced some worrying on employment and inflation and said that they need to get more strength in this data…
If we will take into consideration geopolitical situation and risks that have appeared recently, it could happen that situation will change, especially if situation in Ukraine will escalate and peaceful regulation will fail. Day by day we see worrying geopolitical news – Macedonia, Yemen, and Syria are to name some. Unfortunately the geopolicy is sphere where we can’t do much.
That’s being said, as gold has passed through 1200 and until it stands below 1308 top, our long-term next destination point is previous lows at 1130, but if gold will return to 1130 for second time – this is temporal destination and we should prepare for further downward action. Current upside action we should treat as retracement, although it could be really significant on lower time frames.
Weekly
Situation on weekly chart also has changed rather fast. Only last week we’ve discussed upside potential and how far market could move to the upside.
But on previous week trend has turned bearish again. Sometimes I call this kind of action as “2-day stop grabber”. This is not invention of DiNapoli, but I saw many times when market shifts trend and on next candle return it back – it very often works as grabber. This is easily could be explained – if you will increase time frame for 2 times you’ll get the grabber there. Anyway, here we could get something of that sort. Besides, take a look at action April. Trend mostly holds bullish, but price action is not, gold can’t start upside action. This could be the sign of market’s weakness.
Our major pattern here is still big butterfly. Speaking on targets, we have three different patterns that point on the same level. They are butterfly “buy”, AB=CD and the part of this AB-CD that takes “222” Sell shape.
Thus, all these patterns point at the same destination around 1080$. This level is special, because it coincides with YPS1.
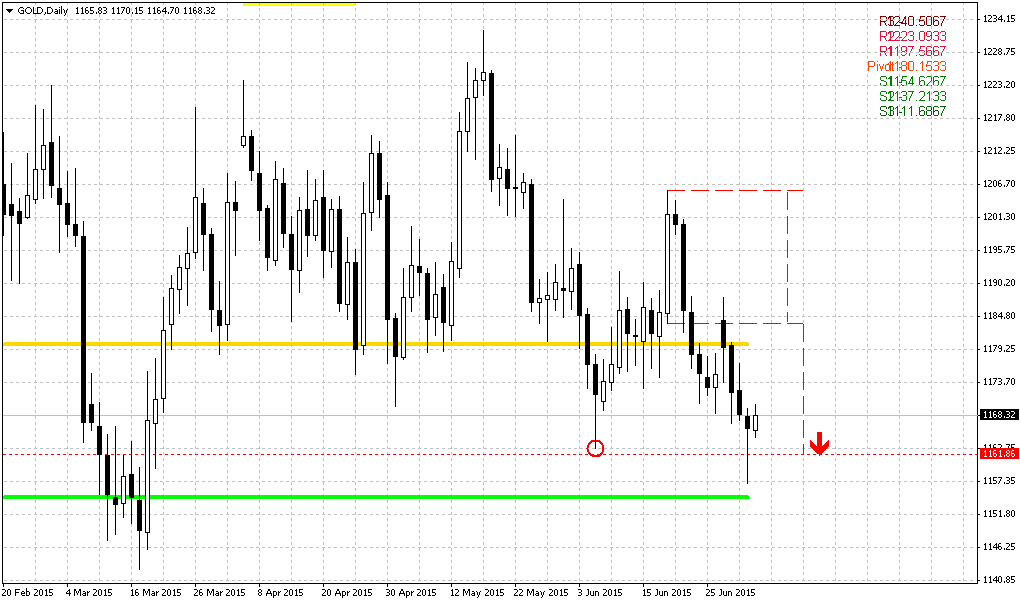
Daily
Trend is bearish here. Daily picture barely has changed and we have said everything on Friday. Our short-term target is still the same and it is based on large evening star pattern that points on 1160 level. At the same time this level will be important by many reasons. This is, in fact, an edge between upside and downside AB-CD’s. If market will drop below it – it will erase the former and trigger the latter. Any target below 1160, which is 1150, 1130 – they are just temporal, since market is returning back to them second time within a year. It means that all of them probably will be broken and real destination of the market is our long-term target 1050-1080.
Meantime, if there will be no peaceful solution on Greece we assume that gold turn to short-term upside rally, but hardly this rally will lead to major reversal on the market. For example we could get butterfly “Sell” based on most recent swing down, or even action of shyer scale. As we said in our FX research – before taking any position, it will be better to wait result on Greece question. It should come on Monday.
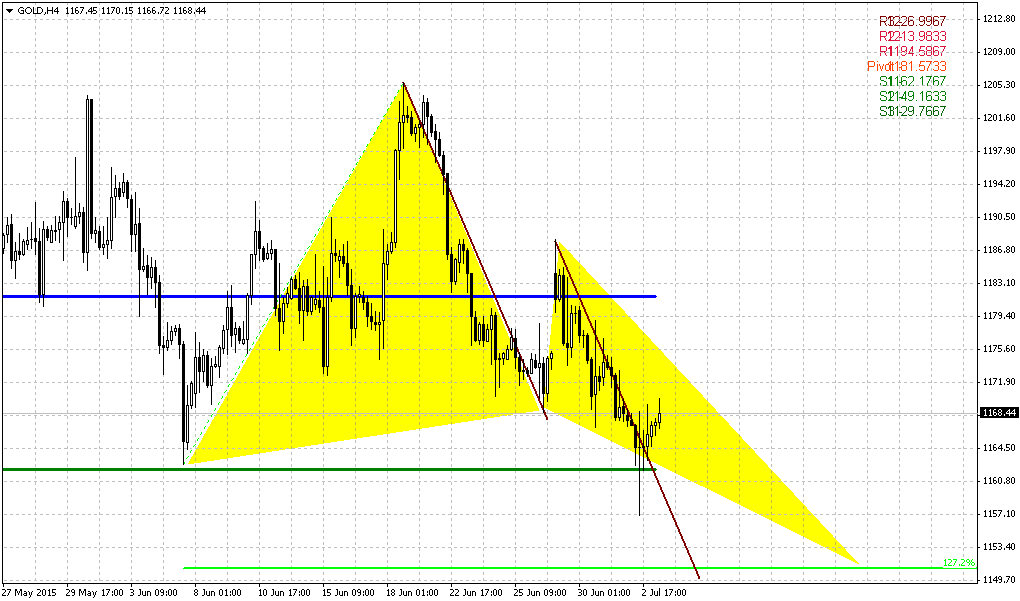
4-hour
If market will not be able to form large butterfly, and reaction on Greece demarche will be mild, in this case gold could try to form this butterfly and show upside action just to WPR1. The failure of H&S that we’ve discussed last week, also looks as bearish sign that decreases chances on upside reversal. Still, all scenarios that we’ve discussed here are mostly just an assumption, because real driving factor right now is Greece.
Conclusion:
Long-term picture remains bearish and major patterns stand mostly intact. Our long-term target still stands at 1050-1080 area. We do not exclude scenario with possible upside action if Greece default will happen on Monday but we think that hardly this event drastically will change the tendency. Other words speaking, we accept idea of possible upside action, may be it even could be significant, but this action hardly will break long-term bearish trend and sentiment. Reaction on Greece default could be strong, but probably it will not be long-term. Greece problem was discussing for a long period already and negative result probably partially was priced in already.
On short-term charts market could show different reaction in a case of Greece default. It could be stronger and lead to big butterfly on daily chart or, vice versa, it could be shyer and price could stop around WPR1… Anyway, as Greece situation should be resolved on Monday, despite the way how it will be resolved, we mostly call to not take any position until it will happen.
The technical portion of Sive's analysis owes a great deal to Joe DiNapoli's methods, and uses a number of Joe's proprietary indicators. Please note that Sive's analysis is his own view of the market and is not endorsed by Joe DiNapoli or any related companies.