Sive Morten
Special Consultant to the FPA
- Messages
- 18,699
Fundamentals
Weekly Gold Tading Report prepared by Sive Morten exclusively for ForexPeaceArmy.com
Today guys we’ve decided to combine Gold update with short-term look at NZD. Mostly because Gold is not very interesting in short-term perspective. As you can see price action on previous week mostly was anemic and our major thoughts on perspective of metal in general stand the same.
Conversely, NZD shows nice short-term setup and it needs some update to what we’ve said on Friday. Thus, first part of research, monthly and weekly charts will be dedicated to Gold, while daily and lower analysis will be on NZD.
Gold pared early gains on Friday, on track to break a nine-day streak lower despite the dollar's extended rally as the precious metal market appeared reluctant to extend losses ahead of the U.S. Federal Reserve meeting next week.
The metal was headed for its sixth weekly loss in the past seven, down 1 percent so far and having hit its lowest in more than three months at $1,147.10 on Wednesday.
"It's almost like it's confused. It looks like it's trying to find itself," said Teddy Sloup, senior market strategist for iiTrader in Chicago.
Gold has taken a beating since a stronger-than-expected U.S. jobs report last week stoked speculation the Federal Reserve would raise interest rates soon. The next focus will be the Fed's policy-setting committee meeting on March 17-18.
"Gold is holding just above this key area of $1,150, but there is more downside risk as the dollar could continue its ascent ahead of next week's Fed meeting, especially as it is so close to parity level with the euro," Saxo Bank head of strategy Ole Hansen said.
The dollar hit its highest in nearly 12 years on Friday and is widely expected to reach parity with the euro, due to the gap between U.S. and European interest rates.
A stronger dollar would continue to cloud the outlook for gold, making it more expensive for holders of other currencies, while higher interest rates usually dent demand for assets that do not pay interest such as bullion.
In a reflection of bearish sentiment, holdings in SPDR Gold Trust, the world's largest gold-backed exchange-traded fund, fell 0.28 percent on Thursday to 750.95 tonnes, the lowest since January. It had been three weeks since the fund saw any inflows.
Other precious metals have also taken a hit. Silver , which was on track for a second straight weekly fall, was down 0.3 percent at $15.52 an ounce, while palladium was heading for its worst week since mid-January. Prices were up 0.1 percent at $789 an ounce on Friday.
Platinum was flat at $1,111 an ounce, having fallen to its lowest since 2009 at $1,108.50 on Thursday.
Recent CFTC data again shows solid increase in short positions. As speculative shorts stands two times smaller than longs market has pretty lot potential for further downward action. It looks like situation really has changed.
SPDR fund reports on drop of storages for 6 tonnes to 750. This is not as large drop as on previous week, but the point stands in tendency and second – gold action on recent week also was not as strong as week before.
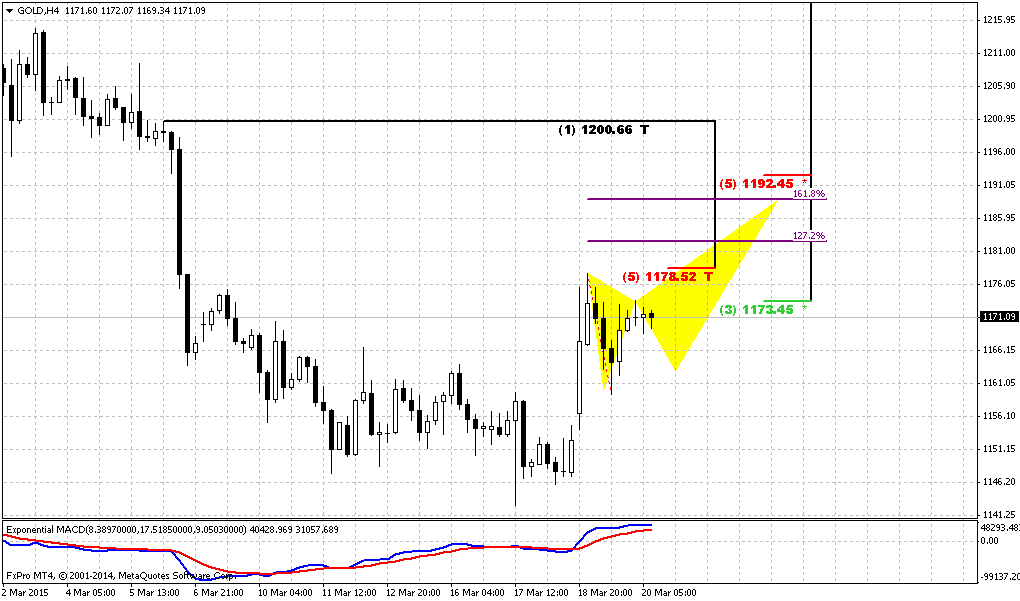
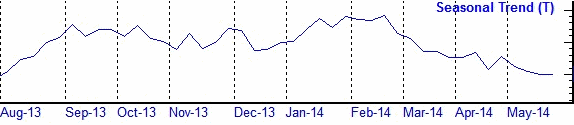
Also it makes sense to remind that gold is entering into bearish seasonal trend. All these moments obviously do not support bullish reversal on gold. It looks like bulls have failed the test on quality and recent upside action on gold mostly was respect of support and butterfly pattern, rather than reversal.
Here is detailed breakdown of speculative positions:
Open interest:
 Shorts:
 Longs:
 Technicals
Monthly
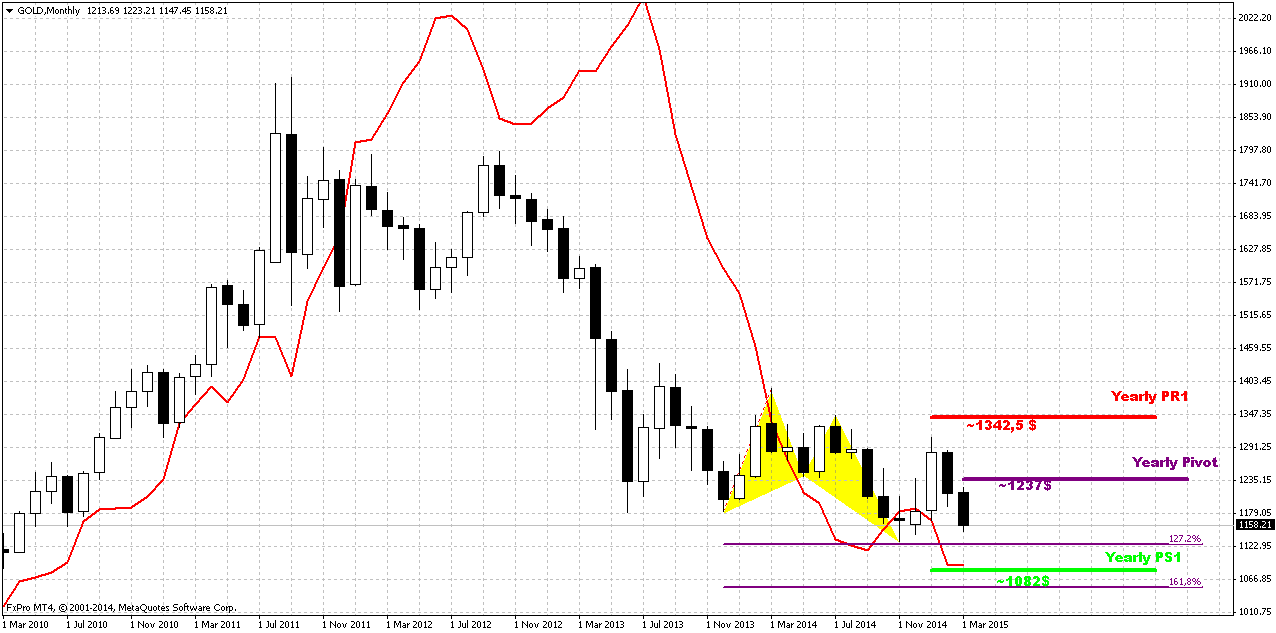
So, drop on recent couple of weeks looks significant. Here we still have last big pattern in progress that is Volatility breakout (VOB). It suggests at least 0.618 AB-CD down. And this target is 1050$. At the same time February still stands as inside month and we need 1130 breakout to start clearly speak on 1050 target.
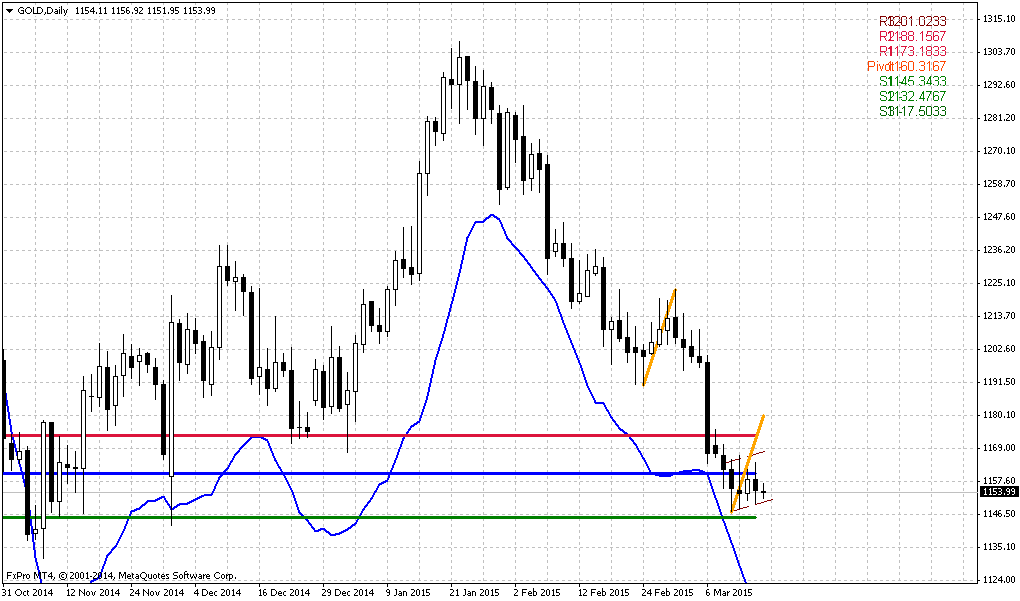
Since the beginning of the year market shows solid upside action. Market was able to exceed yearly pivot, passed half way to Yearly Pivot resistance 1 but right now has reversed down and closed below YPP. From technical point of view this is bearish sign. This could be very significant moment and next logical destination will be yearly pivot support 1 around 1083$.
Recent NFP data shows impressive growth, but labor cost not as stably good as unemployment. Many investors concern about anemic wage growth, although in recent time this indicator shows improving. So, it seems that gold will remain hostage of dollar value and US economical data in nearest perspective.
Still, if we will take into consideration geopolitical situation and risks that have appeared recently, it could happen that situation will change, especially if situation in Ukraine will escalate and peaceful regulation will fail.
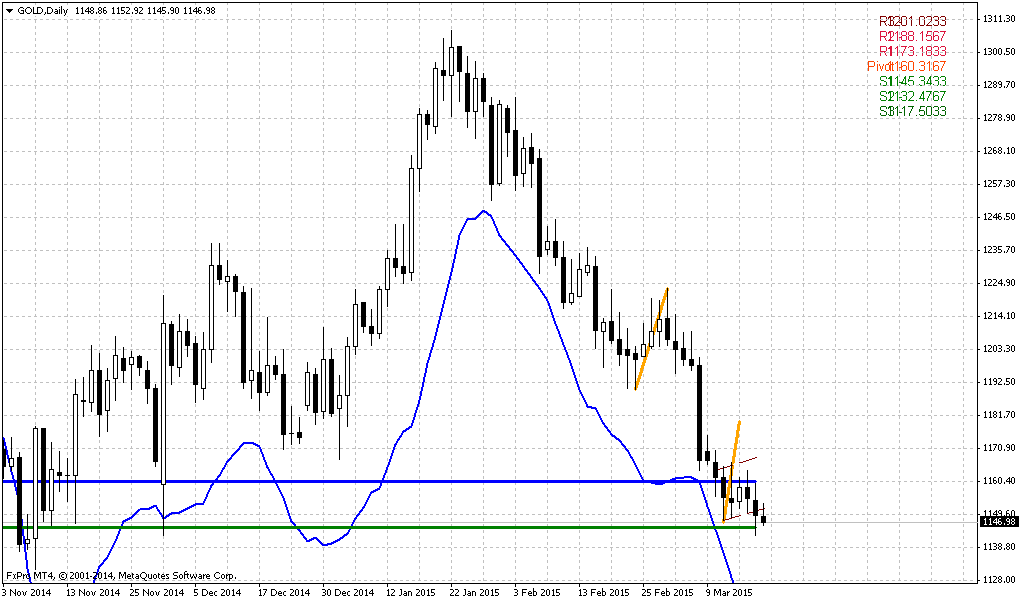
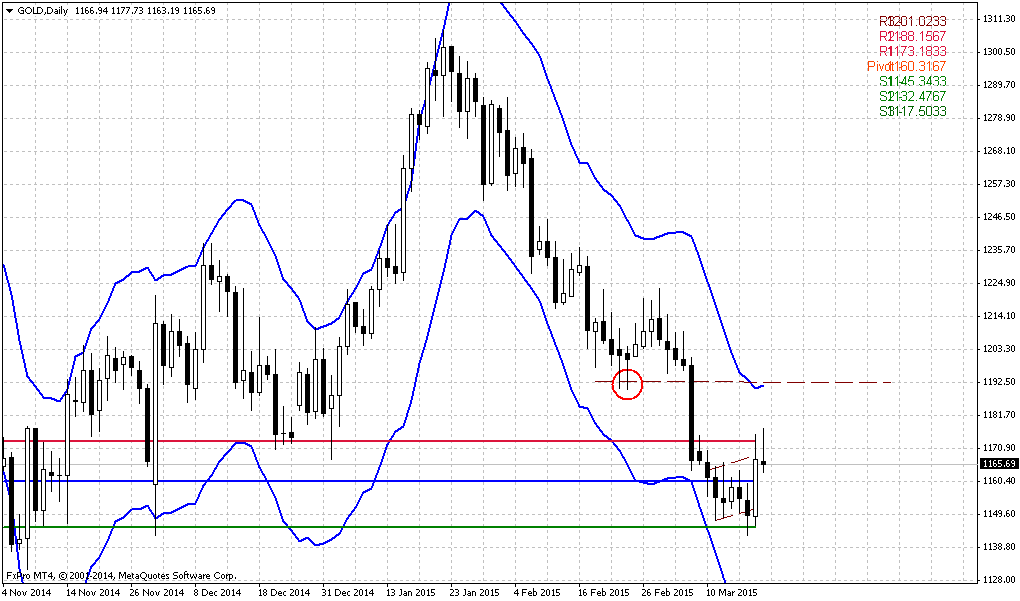
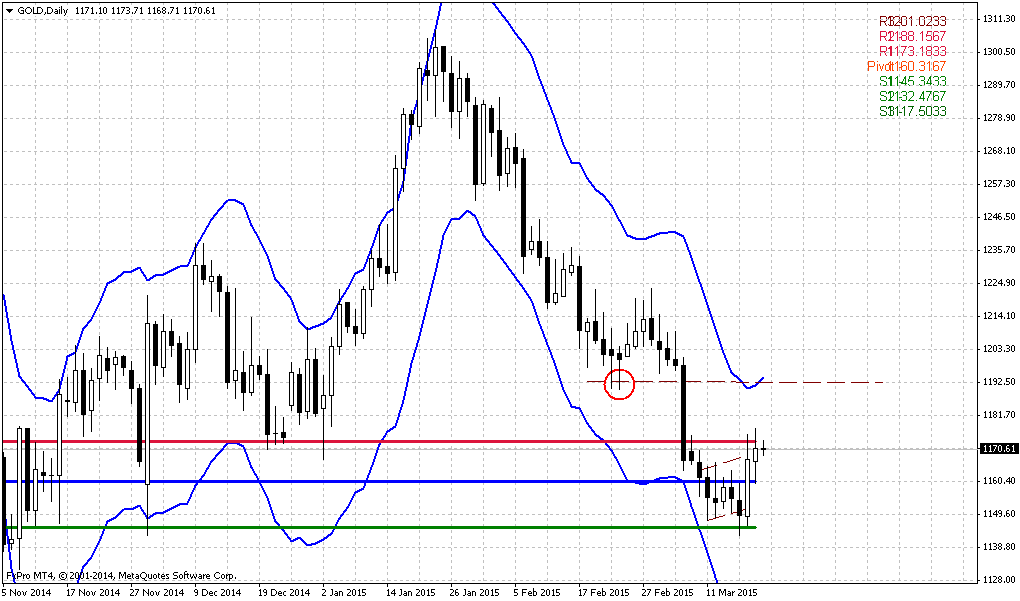
That’s being said, economical data supports further gold decreasing but geopolicy could bring significant adjustment. Unfortunately the geopolicy is sphere where we can’t do much. As gold has passed through 1200, our next destination point is previous lows at 1130, but since gold is returning to them again – this is temporal destination and we should prepare for further downward action. Besides, right now we can clear recognized bearish dynamic pressure on monthly chart. Take a look, although trend has turned bullish, but market was unable to show more or less meaningful upside action. Right now we see the tendency of lower highs creation and this significantly increases chances on downward breakout.
Weekly
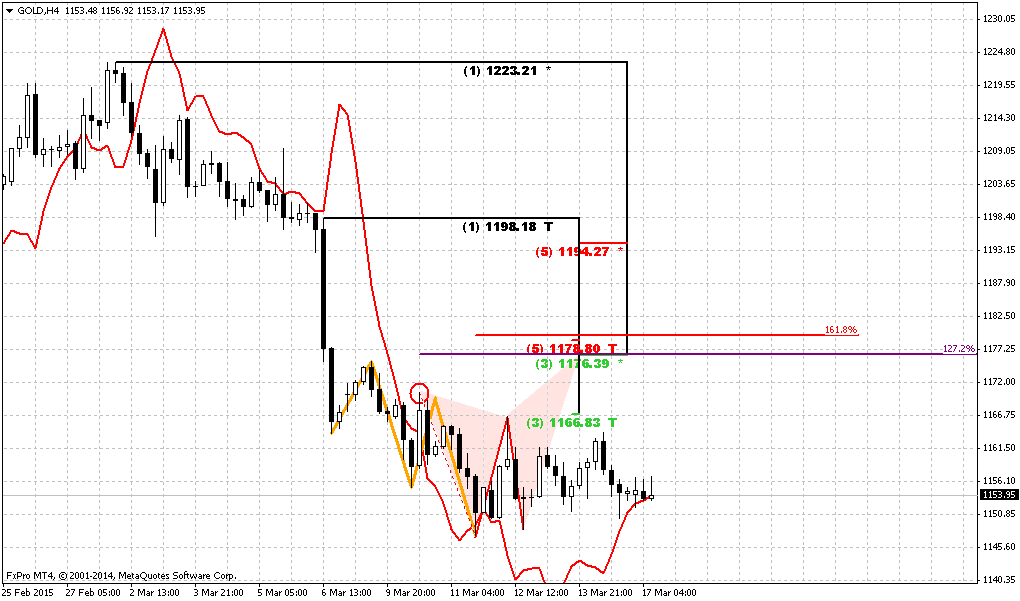
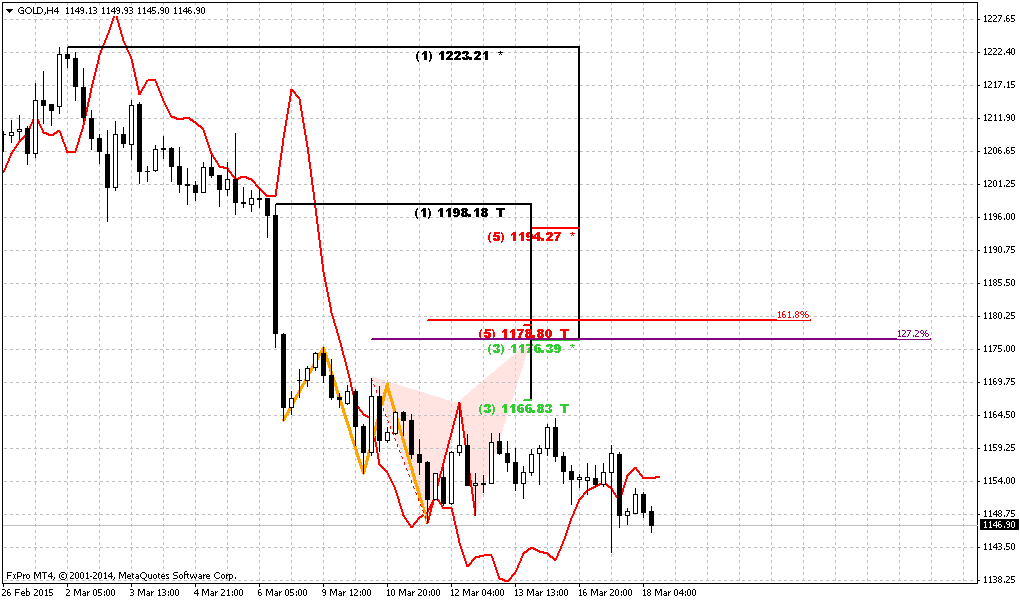
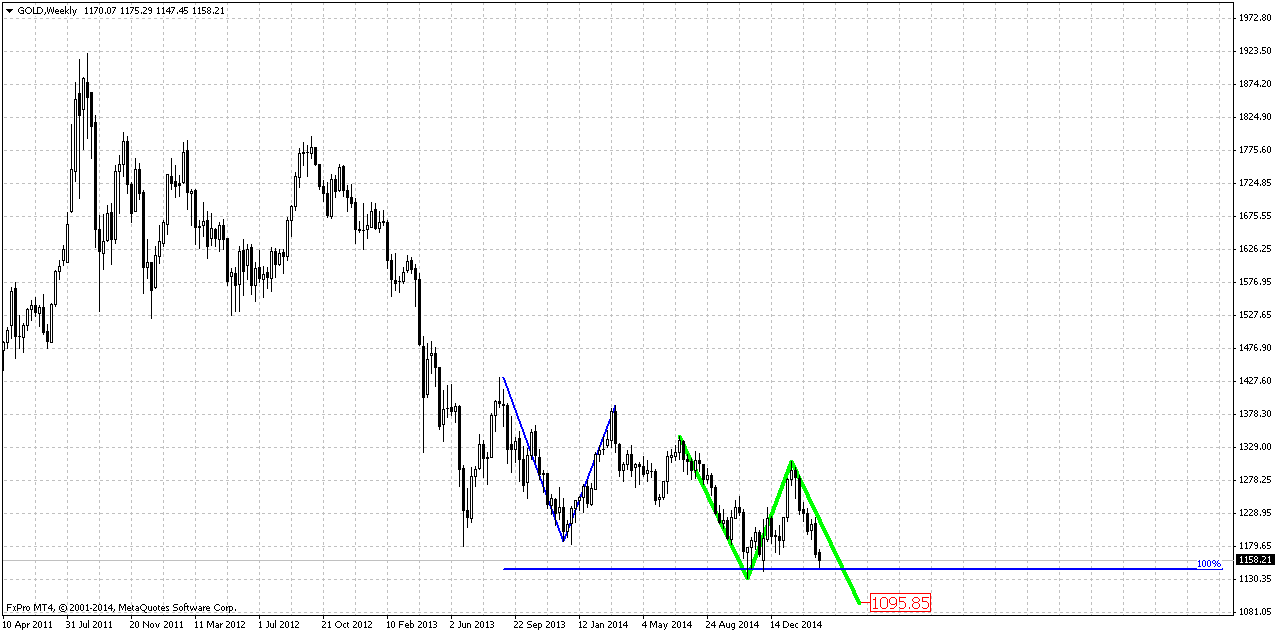
Trend has turned bearish. So gold was not able to hold above 1200 strong support and moved below not just Fib level, but also MPS1. This tells that previous upside trend has failed. If you will take a look at weekly chart closely you will find a lot of different targets – AB-CD’s, couple of butterflies etc. But right now it makes sense probably to focus on most close target that is based on most recent AB-CD pattern. 1130 level is very close and it makes sense to take a look a bit lower. This AB-CD points on 1095-1100 destination point. Current picture points on solid chances of downward continuation, because CD leg is faster than AB. All other targets stand significantly lower – 1080, 1050 and even 990$.
And now to NZD…
Daily
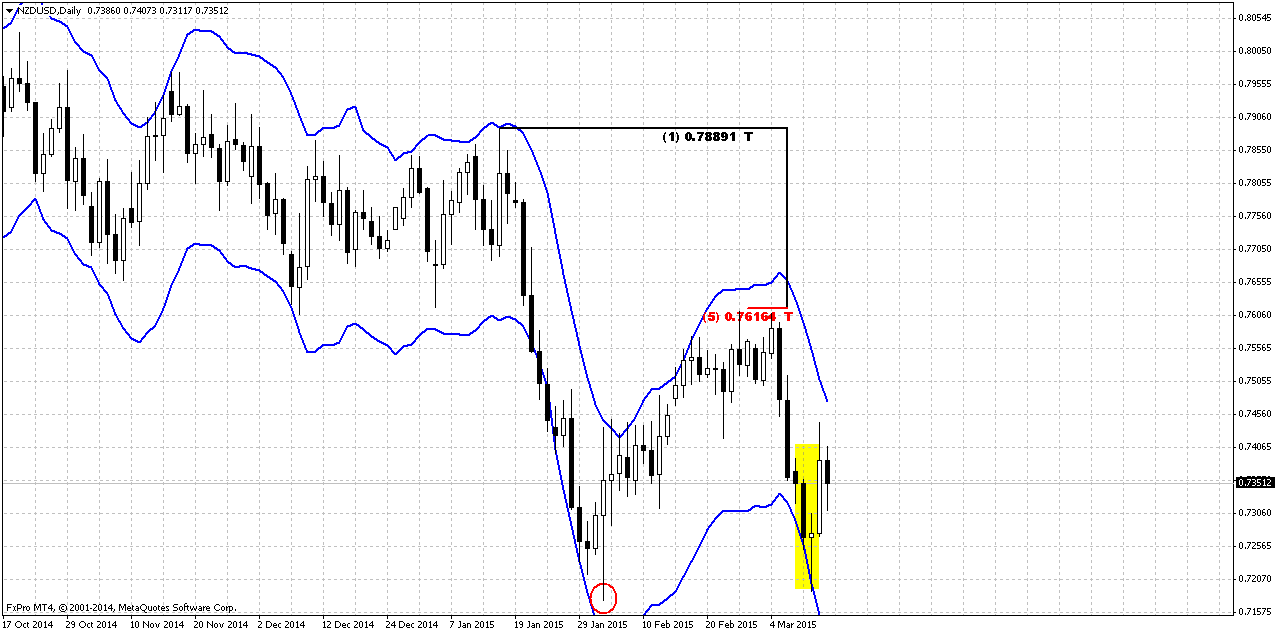
As we’ve said on Friday, our idea on NZD mostly tactical and short-term and assumes upside retracement. Currently we do not look too far and do not gamble whether trend will drastically change or not. For us this is just retracement up by far.
So, the background of this context is weekly bullish grabber, oversold on daily chart and appearing of huge bullish “morning star” candlestick pattern. Our target here is some upside AB=CD that is based on morning star. Right now on NZD chart we see classical action – shy retracement back inside of pattern’s body after pattern has been formed. Usually traders, who work with candlestick patterns, use this retracement for taking position. So, this issue we particularly have called to in our Friday video.
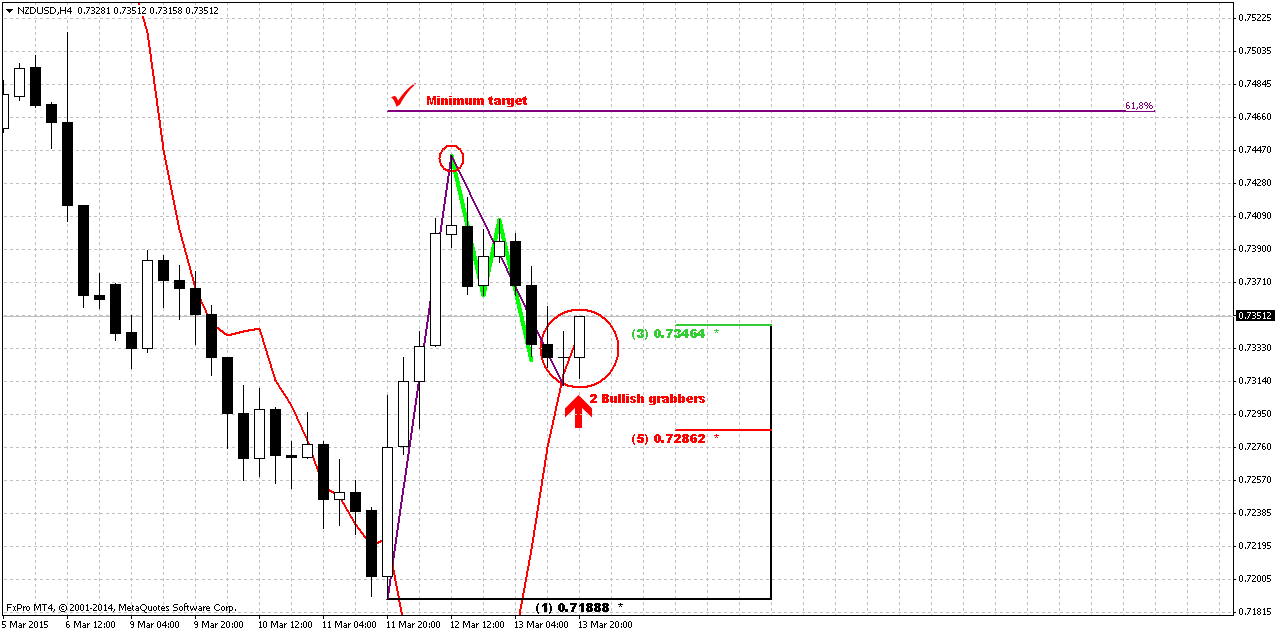
4-hour
Here is our major chart for NZD. You can see that our trading plan has started perfect. Our entry area was crossing of downward AB=CD retracement and Fib support area. Market has reached 50% Fib level (not shown) and has formed two side-by-side bullish grabbers. This is the kind of grabber that I like to trade since they stand in the same direction as previous thrust. Grabbers themselves assume taking out of recent top, but most probable target is 0.618 AB=CD at 0.7465. Next target will be 1.0 AB=CD at 0.7565.
Now speaking on previous analysis that we’ve made at the end of February and suggested taking out of recent lows on weekly chart. If even NZD will complete whole AB=CD – this swing will stay inside of recent drop and will not change overall picture. Currently it is difficult to say whether market still will continue move down below lows on weekly chart, but if this will not happen – the reason will be not in upside retracement.
Taking into consideration Fed meeting on 17-18 of March, we could suggest upside action to 0.7465 as positions contracting before Fed, and downward continuation (may be even below lows) if Fed rhetoric will be hawkish.
Conclusion:
From technical point of view we have no reasons yet to abandon possible long-term downward AB-CD as VoB (Volatility breakout) development. Fundamental background is not very supportive for gold right now and one cluster of events that could bring unexpected bullish surprise is geopolitical tensions.
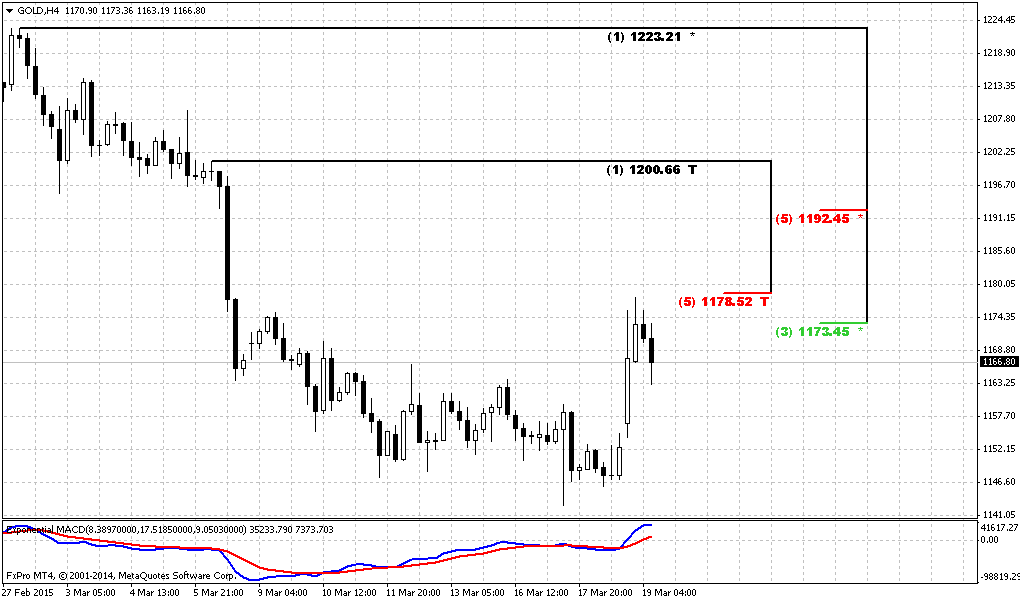
Market has dropped below key level of 1200 and if it will not return back to 1220 area somehow – road to 1130 will be open.
The technical portion of Sive's analysis owes a great deal to Joe DiNapoli's methods, and uses a number of Joe's proprietary indicators. Please note that Sive's analysis is his own view of the market and is not endorsed by Joe DiNapoli or any related companies.
Weekly Gold Tading Report prepared by Sive Morten exclusively for ForexPeaceArmy.com
Today guys we’ve decided to combine Gold update with short-term look at NZD. Mostly because Gold is not very interesting in short-term perspective. As you can see price action on previous week mostly was anemic and our major thoughts on perspective of metal in general stand the same.
Conversely, NZD shows nice short-term setup and it needs some update to what we’ve said on Friday. Thus, first part of research, monthly and weekly charts will be dedicated to Gold, while daily and lower analysis will be on NZD.
Gold pared early gains on Friday, on track to break a nine-day streak lower despite the dollar's extended rally as the precious metal market appeared reluctant to extend losses ahead of the U.S. Federal Reserve meeting next week.
The metal was headed for its sixth weekly loss in the past seven, down 1 percent so far and having hit its lowest in more than three months at $1,147.10 on Wednesday.
"It's almost like it's confused. It looks like it's trying to find itself," said Teddy Sloup, senior market strategist for iiTrader in Chicago.
Gold has taken a beating since a stronger-than-expected U.S. jobs report last week stoked speculation the Federal Reserve would raise interest rates soon. The next focus will be the Fed's policy-setting committee meeting on March 17-18.
"Gold is holding just above this key area of $1,150, but there is more downside risk as the dollar could continue its ascent ahead of next week's Fed meeting, especially as it is so close to parity level with the euro," Saxo Bank head of strategy Ole Hansen said.
The dollar hit its highest in nearly 12 years on Friday and is widely expected to reach parity with the euro, due to the gap between U.S. and European interest rates.
A stronger dollar would continue to cloud the outlook for gold, making it more expensive for holders of other currencies, while higher interest rates usually dent demand for assets that do not pay interest such as bullion.
In a reflection of bearish sentiment, holdings in SPDR Gold Trust, the world's largest gold-backed exchange-traded fund, fell 0.28 percent on Thursday to 750.95 tonnes, the lowest since January. It had been three weeks since the fund saw any inflows.
Other precious metals have also taken a hit. Silver , which was on track for a second straight weekly fall, was down 0.3 percent at $15.52 an ounce, while palladium was heading for its worst week since mid-January. Prices were up 0.1 percent at $789 an ounce on Friday.
Platinum was flat at $1,111 an ounce, having fallen to its lowest since 2009 at $1,108.50 on Thursday.
Recent CFTC data again shows solid increase in short positions. As speculative shorts stands two times smaller than longs market has pretty lot potential for further downward action. It looks like situation really has changed.
SPDR fund reports on drop of storages for 6 tonnes to 750. This is not as large drop as on previous week, but the point stands in tendency and second – gold action on recent week also was not as strong as week before.
Also it makes sense to remind that gold is entering into bearish seasonal trend. All these moments obviously do not support bullish reversal on gold. It looks like bulls have failed the test on quality and recent upside action on gold mostly was respect of support and butterfly pattern, rather than reversal.
Here is detailed breakdown of speculative positions:
Open interest:
Monthly
So, drop on recent couple of weeks looks significant. Here we still have last big pattern in progress that is Volatility breakout (VOB). It suggests at least 0.618 AB-CD down. And this target is 1050$. At the same time February still stands as inside month and we need 1130 breakout to start clearly speak on 1050 target.
Since the beginning of the year market shows solid upside action. Market was able to exceed yearly pivot, passed half way to Yearly Pivot resistance 1 but right now has reversed down and closed below YPP. From technical point of view this is bearish sign. This could be very significant moment and next logical destination will be yearly pivot support 1 around 1083$.
Recent NFP data shows impressive growth, but labor cost not as stably good as unemployment. Many investors concern about anemic wage growth, although in recent time this indicator shows improving. So, it seems that gold will remain hostage of dollar value and US economical data in nearest perspective.
Still, if we will take into consideration geopolitical situation and risks that have appeared recently, it could happen that situation will change, especially if situation in Ukraine will escalate and peaceful regulation will fail.
That’s being said, economical data supports further gold decreasing but geopolicy could bring significant adjustment. Unfortunately the geopolicy is sphere where we can’t do much. As gold has passed through 1200, our next destination point is previous lows at 1130, but since gold is returning to them again – this is temporal destination and we should prepare for further downward action. Besides, right now we can clear recognized bearish dynamic pressure on monthly chart. Take a look, although trend has turned bullish, but market was unable to show more or less meaningful upside action. Right now we see the tendency of lower highs creation and this significantly increases chances on downward breakout.
Weekly
Trend has turned bearish. So gold was not able to hold above 1200 strong support and moved below not just Fib level, but also MPS1. This tells that previous upside trend has failed. If you will take a look at weekly chart closely you will find a lot of different targets – AB-CD’s, couple of butterflies etc. But right now it makes sense probably to focus on most close target that is based on most recent AB-CD pattern. 1130 level is very close and it makes sense to take a look a bit lower. This AB-CD points on 1095-1100 destination point. Current picture points on solid chances of downward continuation, because CD leg is faster than AB. All other targets stand significantly lower – 1080, 1050 and even 990$.
And now to NZD…
Daily
As we’ve said on Friday, our idea on NZD mostly tactical and short-term and assumes upside retracement. Currently we do not look too far and do not gamble whether trend will drastically change or not. For us this is just retracement up by far.
So, the background of this context is weekly bullish grabber, oversold on daily chart and appearing of huge bullish “morning star” candlestick pattern. Our target here is some upside AB=CD that is based on morning star. Right now on NZD chart we see classical action – shy retracement back inside of pattern’s body after pattern has been formed. Usually traders, who work with candlestick patterns, use this retracement for taking position. So, this issue we particularly have called to in our Friday video.
4-hour
Here is our major chart for NZD. You can see that our trading plan has started perfect. Our entry area was crossing of downward AB=CD retracement and Fib support area. Market has reached 50% Fib level (not shown) and has formed two side-by-side bullish grabbers. This is the kind of grabber that I like to trade since they stand in the same direction as previous thrust. Grabbers themselves assume taking out of recent top, but most probable target is 0.618 AB=CD at 0.7465. Next target will be 1.0 AB=CD at 0.7565.
Now speaking on previous analysis that we’ve made at the end of February and suggested taking out of recent lows on weekly chart. If even NZD will complete whole AB=CD – this swing will stay inside of recent drop and will not change overall picture. Currently it is difficult to say whether market still will continue move down below lows on weekly chart, but if this will not happen – the reason will be not in upside retracement.
Taking into consideration Fed meeting on 17-18 of March, we could suggest upside action to 0.7465 as positions contracting before Fed, and downward continuation (may be even below lows) if Fed rhetoric will be hawkish.
Conclusion:
From technical point of view we have no reasons yet to abandon possible long-term downward AB-CD as VoB (Volatility breakout) development. Fundamental background is not very supportive for gold right now and one cluster of events that could bring unexpected bullish surprise is geopolitical tensions.
Market has dropped below key level of 1200 and if it will not return back to 1220 area somehow – road to 1130 will be open.
The technical portion of Sive's analysis owes a great deal to Joe DiNapoli's methods, and uses a number of Joe's proprietary indicators. Please note that Sive's analysis is his own view of the market and is not endorsed by Joe DiNapoli or any related companies.