Sive Morten
Special Consultant to the FPA
- Messages
- 18,673
Fundamentals
According to Reuters news, Gold rose on Friday on bargain hunting, though the market posted its biggest weekly drop since November following the Federal Reserve's latest indication that an interest rate hike could come in early 2015. Palladium rose about 3 percent to its highest level since August 2011, outperforming other precious metals as a miners' strike in South Africa continued and concerns grew that the standoff between major producer Russia and the West over Ukraine could escalate. Gold's gains on Friday, however, were limited as the market was still reeling from a two-percent drop on Wednesday, when Fed Chair Janet Yellen said the central bank will probably end its massive bond-buying program this fall, and could start raising interest rates around six months later. "If the Fed is going to raise rates quicker than people had expected, that's definitely bearish for gold," said Bill O'Neill, partner of commodities investment firm LOGIC Advisors.
On Monday, bullion briefly touched a six-month high of $1,391.76 on tensions in Ukraine and concerns about growth in China before the focus shifted towards the U.S. monetary stance. For the week, gold fell nearly 3.5 percent. "Once again the market has proven it cannot maintain strength based on political tensions," O'Neill said.
GOLDEN CROSS
A "golden cross" on the spot bullion chart following a three-month rally suggests prices could climb further this year even after the Federal Reserve is set to keep trimming its bond-buying stimulus, analysts said. Reuters data showed spot gold's 50-day moving average on late Wednesday broke above its 200-day moving average, a highly bullish formation known as a golden cross, just as comments from Federal Reserve Chair Janet Yellen suggested U.S. interest rates could rise sooner than expected. "The golden cross is a confirmation of what we have been seeing all year - gold has been one of the best performing assets," said Adam Sarhan, chief executive of New York-based Sarhan Capital. "Typically the golden cross indicates a bullish intermediate to longer-term outlook in the next six to nine months. In the short term, gold is over-extended and due for a pullback," he said. Technical traders and momentum investors pay close attention to the golden cross because of its strong bullish indication. "While gold may be at risk of further losses, given the prospects for tighter monetary policy, should follow-through selling materialize, technical traders may view current price levels as an attractive entry point for bullion," said James Steel, analyst at HSBC, referring to the golden cross.
Another bullish chart pattern - the double bottom which has two troughs at about the same level near a three-year low of $1,180, also particularly appeals to chartists because it reflects investors' psychology by pinpointing the critical level where heavy selling has exhausted twice – that’s what we also discuss every time on monthly chart…
Monthly
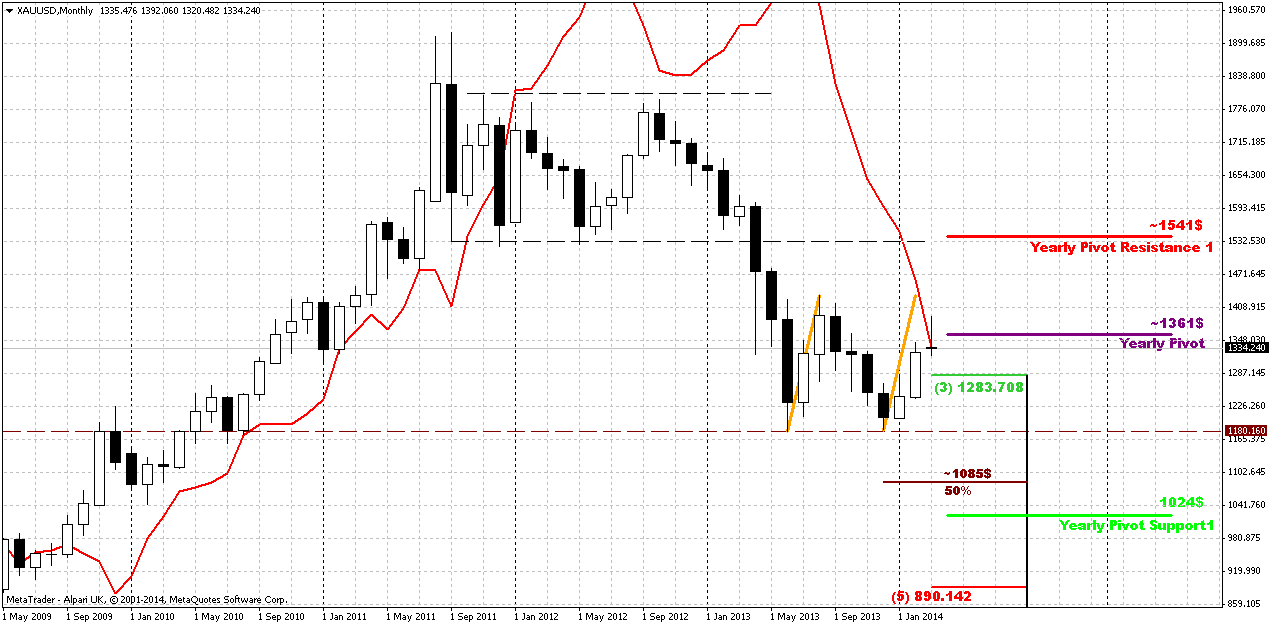
Although on previous week we’ve noted that price has moved above YPP and shifted trend to bullish, but also we said that this could shift to bearish stop grabber and that it is too early to be fascinating with bullish break. Now we have the picture how it could look like by the end of the month. At the same time let’s not to give dramatic turn to this event. All that I would like to point is that nothing is done yet here. Of cause turning down from YPP can’t treated as positive sign, but this is normal – respect and react on reaching solid resistance. Besides, market has not shown too extended downward action, so it is too early to fall in histeric on possible downward reversal.
Yes, this could be bearish grabber, but it could fail as well, right? Taking into consideration all issues that we have now on gold market – I would not rush with reversal conclusions and treat current move down as retracement by far. Another interesting moment here is that market has not reached neckline of potential Double Bottom pattern and has not reached AB=CD upward target around 1430. The question what will it be – another gold’s trick and pitfall? When traders will take shorts - will market make another leg up to neckline before following retracement? If not, then market should not show too deep retracement right now. If gold is really bullish, and it stands above 0.618 target already – there is no reasons for too extended retracement to downside.
Long term upside target stands around yearly PR1. We know that gold likes to re-test previously broken lows and consolidations. 1540 area is monthly overbought, YPR1 and low border of broken long-term rectangle. As market was strongly oversold, very often it has tendency to reach overbought. Market is a impulse substance and reaction equals to counter reacion.
So our long-term analysis is the same. As another application of significantly oversold we’ve suggested retracement up. Thus, we’ve made an assumption of possible deeper upward retracement that could take a shape of AB=CD, and invalidation for this setup is previous lows around 1170s. Market right now is forming something like double bottom.
That’s being said – nearest target here is 1430 resistance level, while taking in consideration golds’ habits, geopolitical tension and technical issues, now we treat probability of reaching 1540 level as very high. In nearest future we have to keep close eye on current retracement down.
Weekly
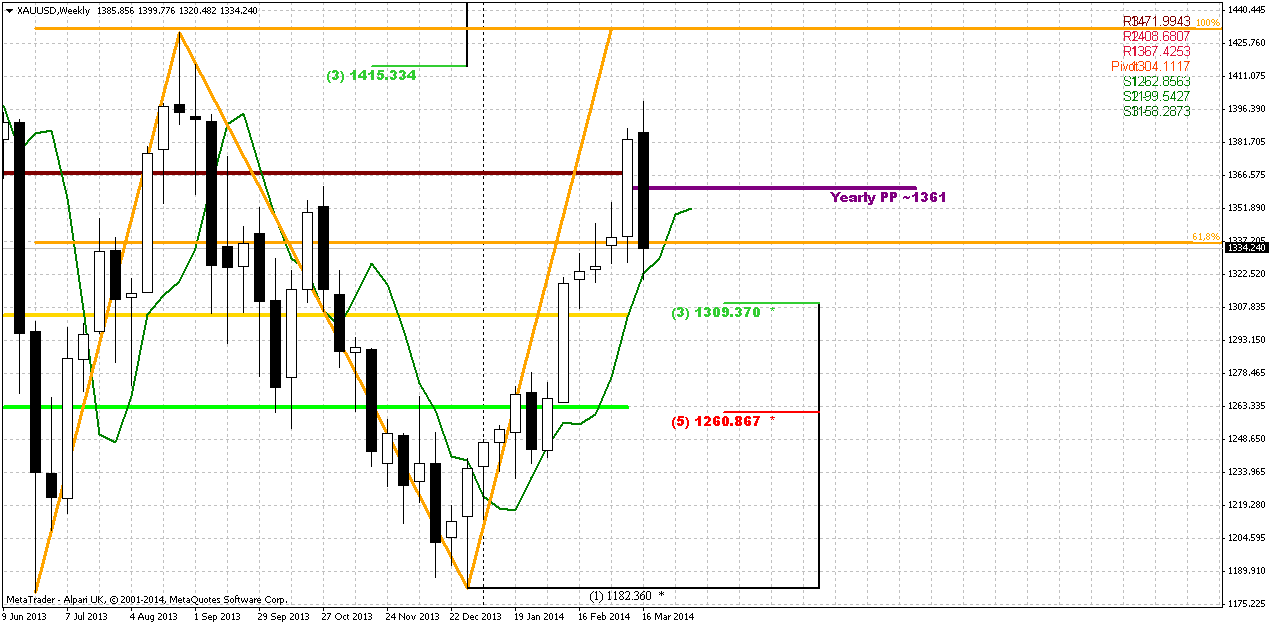
Trend is bullish here, market is not at overbought. Here you can clearer see that market stands between 1.0 and 0.618 AB=CD targets. In such situations price should not show too deep move down, if gold is really bullish. Now price has formed huge bearish engulfing pattern and it could become reason for DiNapoli directional pattern here. We’ve said the same on previous week – nice thrust up, if any retracement will happen we could get DiNapoli “B&B” buy setup. That’s the pattern that we will be watching for in nearest 1-2 weeks here. At the same time this expectation absolutely does not forbid us to trade market short on lower time frames and based on engulfing pattern.
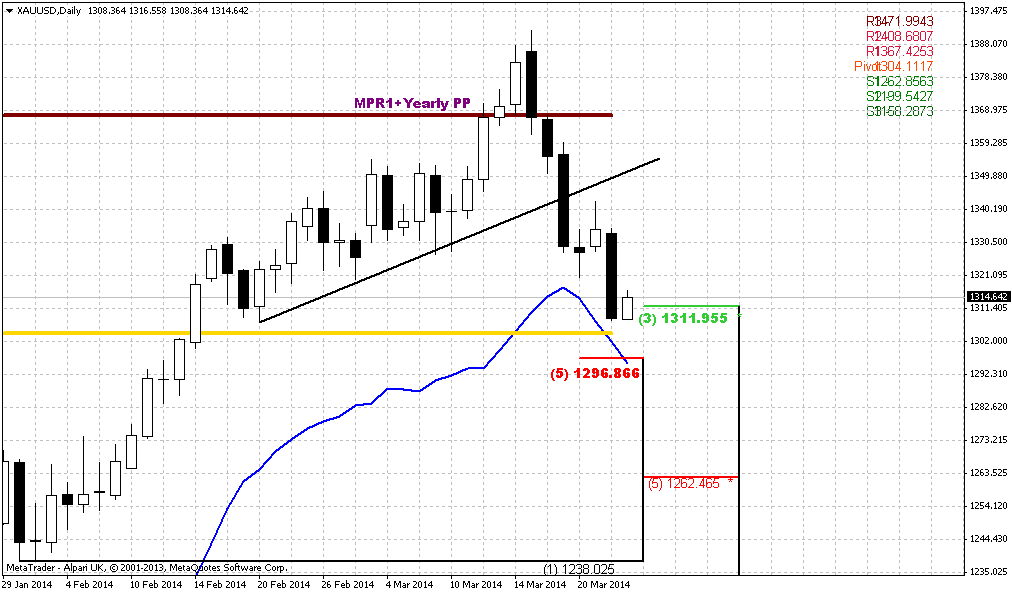
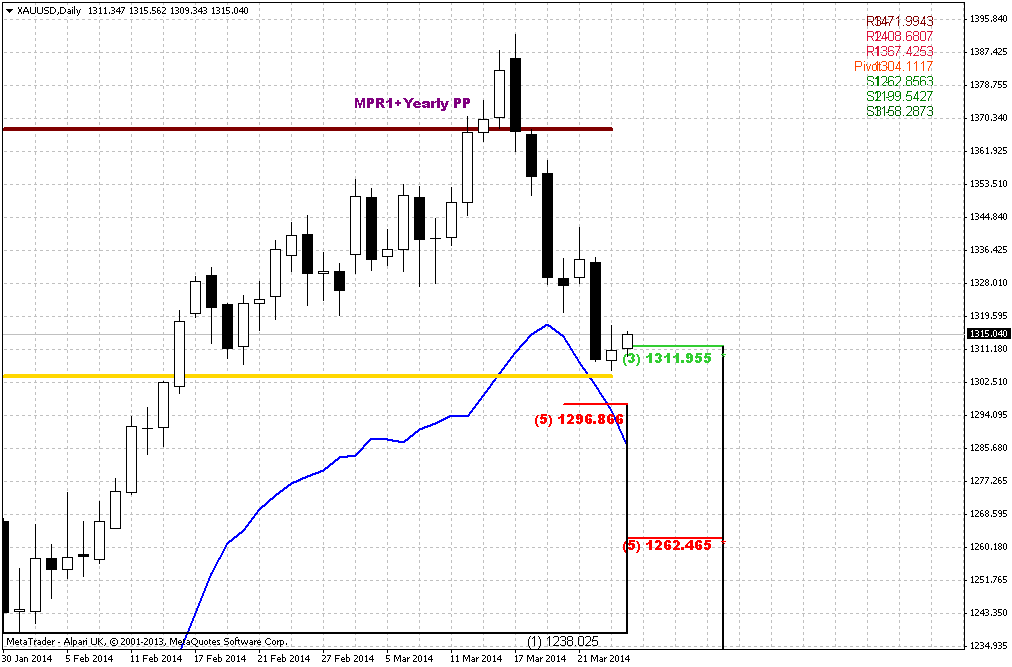
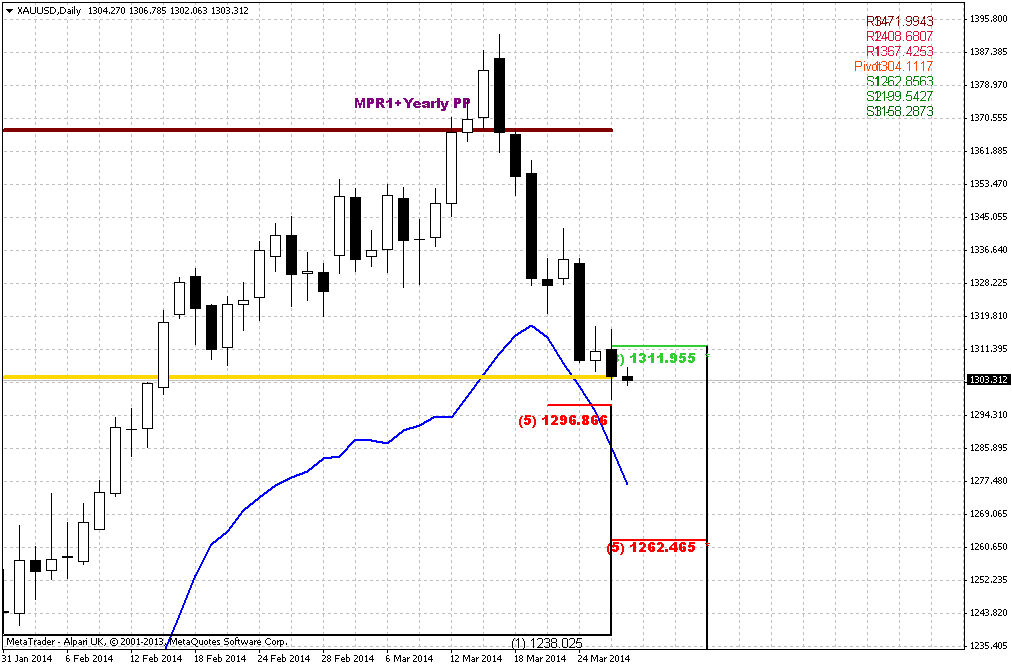
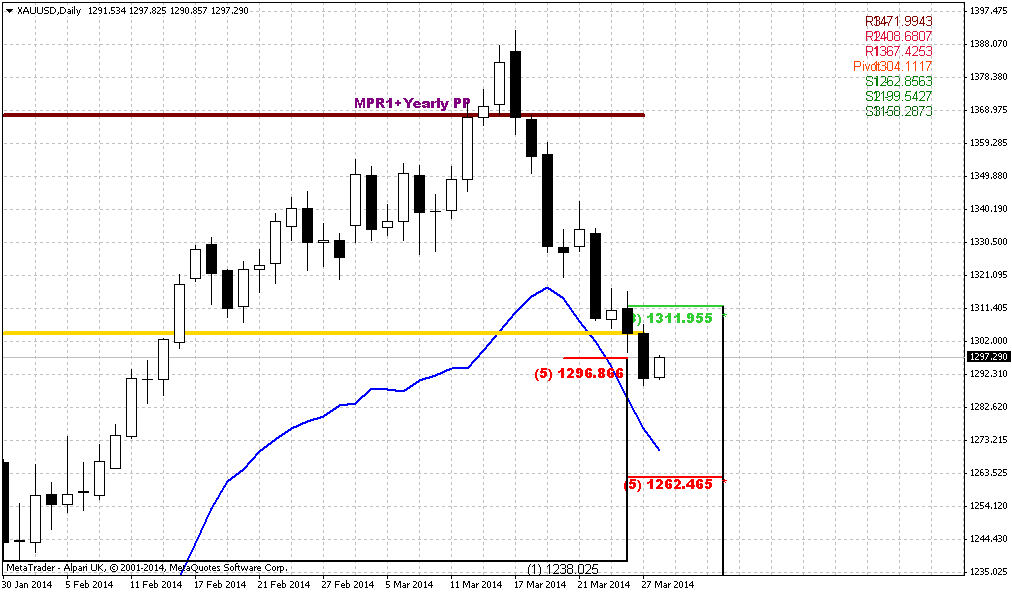
Daily
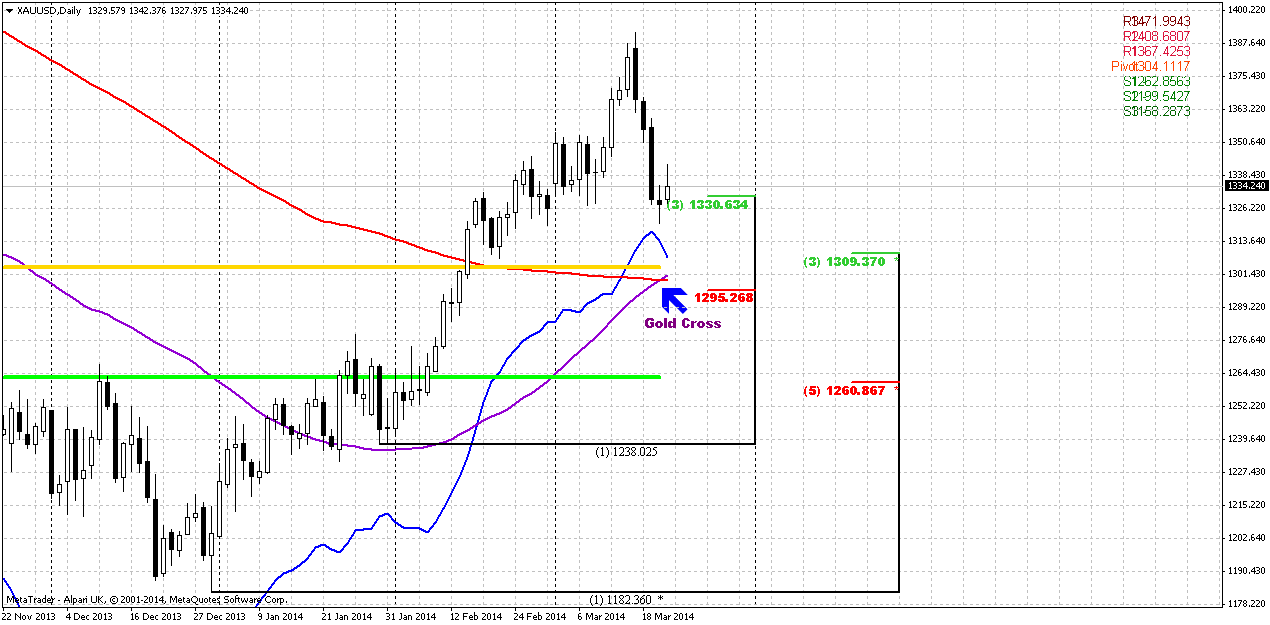
Here I’ve drawn many lines… I just want to show you “golden cross” that we’ve mentioned in fundamental part of research – crossing of 50-day and 200-day MA. Blue line is oversold one, this is not MA… So, we have initial solid plunge down and market has reached first 1330 Fib support. As market has not tested MPP yet, we assess the chance of reaching it as significant. And, in general 1300 area is very strong support – oversold, K-support and MPP. So, probably this will be our short-term target of possible retracement down and… - primary area where we will watch for bullish reversal patterns to step into B&B “Buy” on weekly chart, right?
Now we should monitor possible upward bounce for taking short position. Also, guys, retracement even to MPS1 at 1260 area will be acceptable and will not break bullish trend, since we know – until market stands above MPS1 – long term bullish trend is valid. Usually PS1 has to hold retracement within bullish trend and it works like some type of indicator of trend’s validation. But the moment of truth will happen earlier probably. If market is really bullish, then it should use weekly B&B to re-establish upward action…
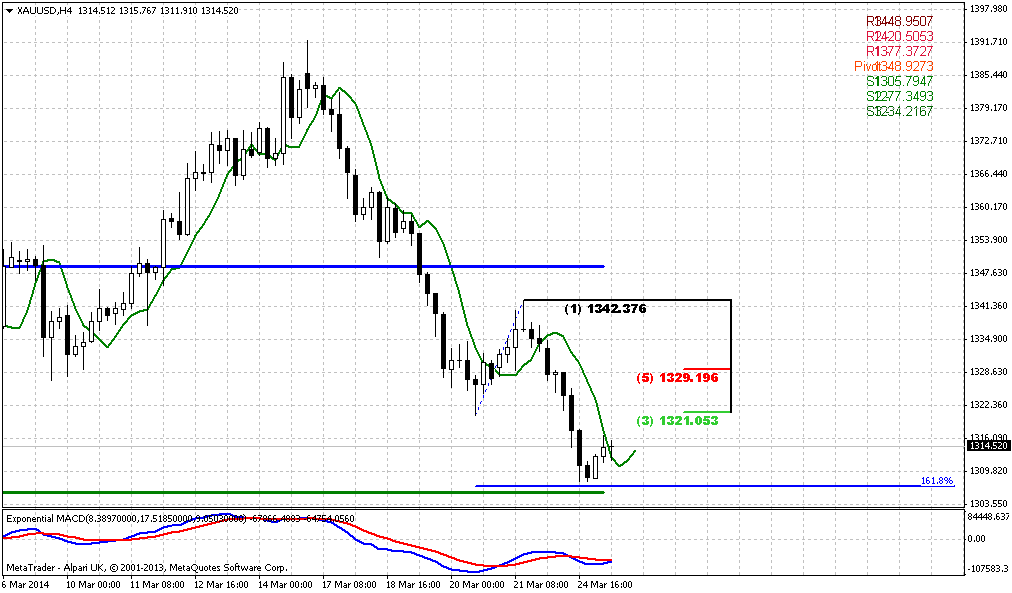
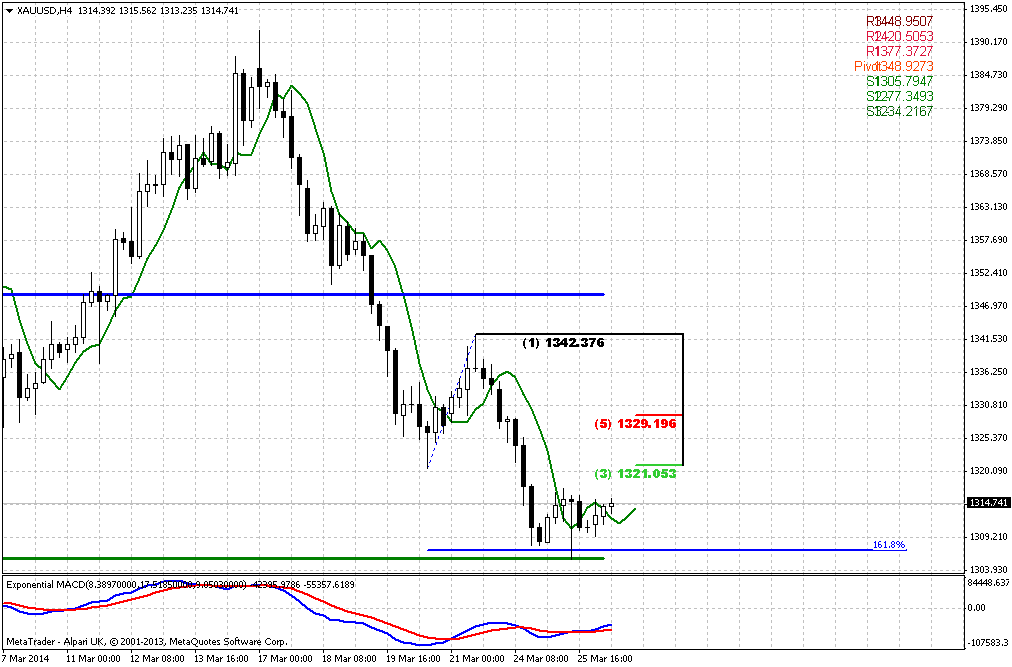
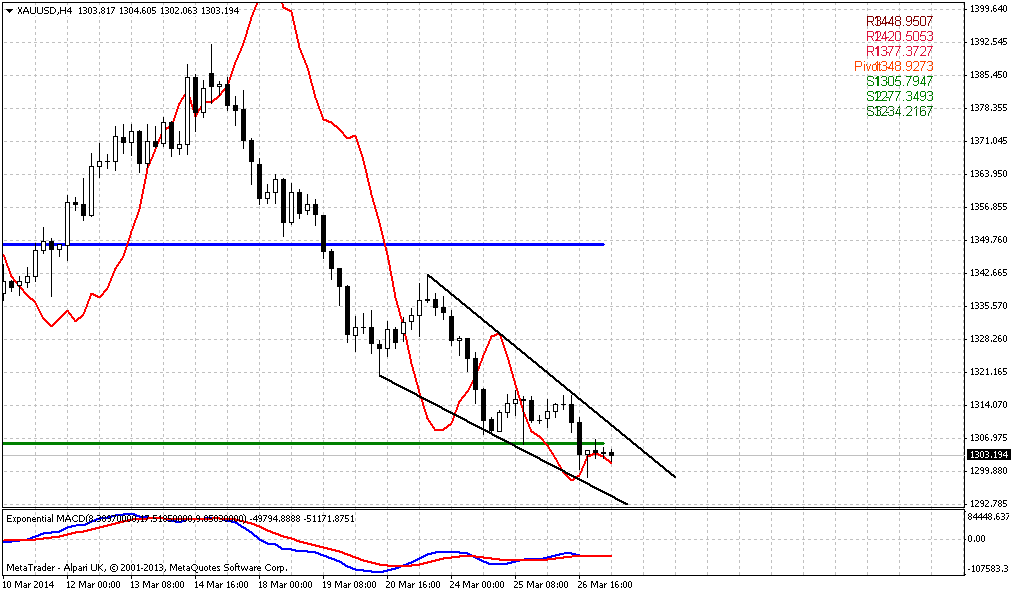
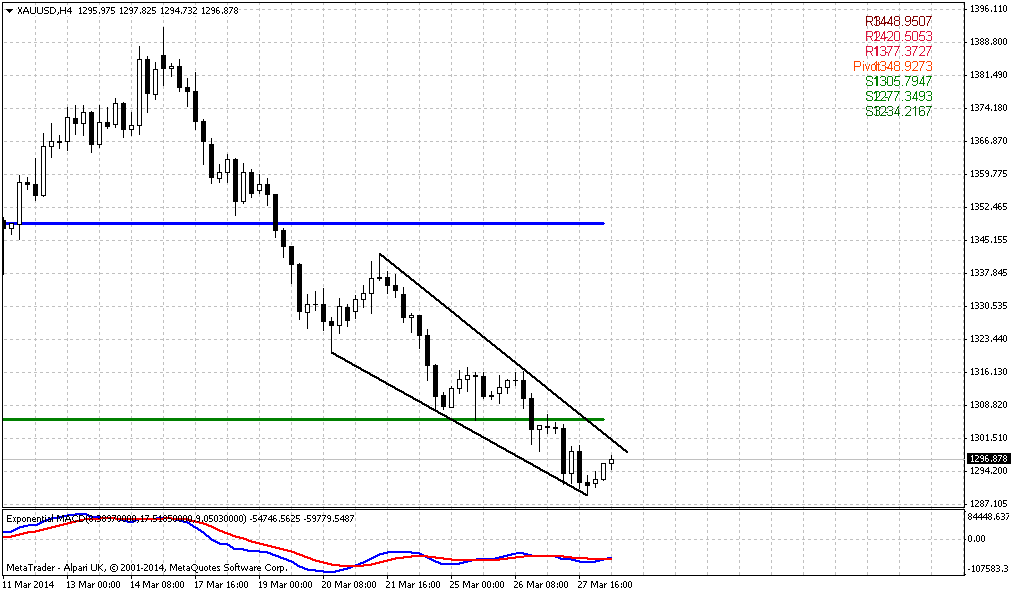
4-hour
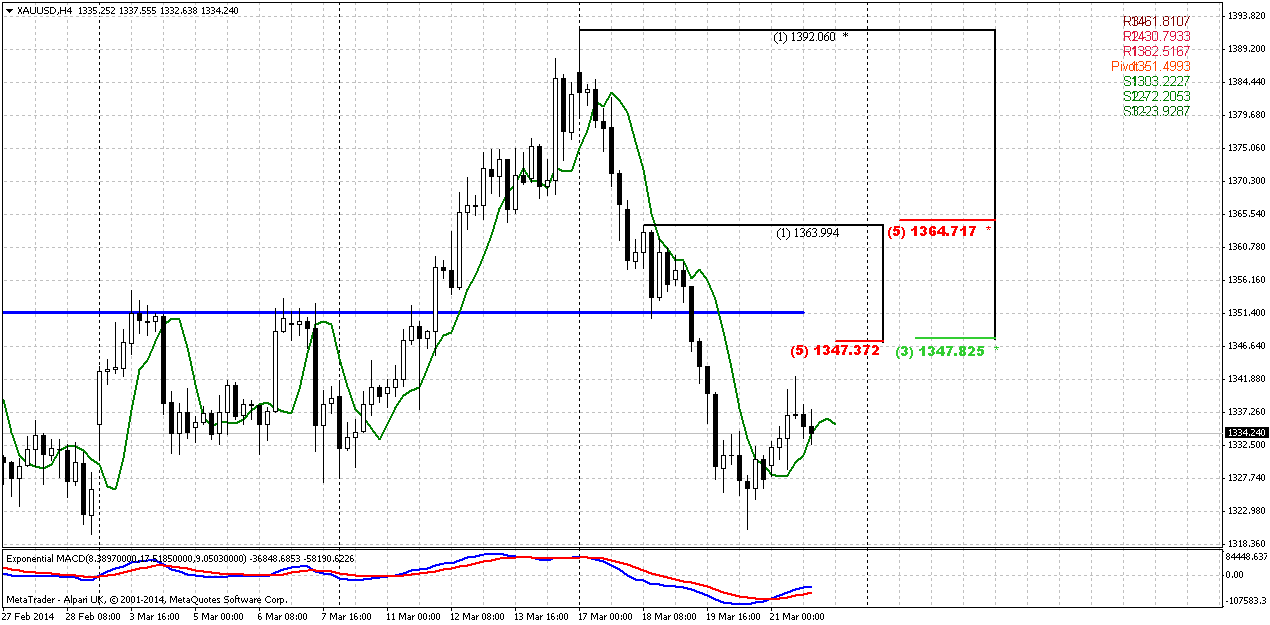
Here trend has turned bullish. We didn’t get B&B “Sell” as we’ve discussed on previous week, but chances on DiNapoli directional pattern still exist. Thus, this could be DRPO “Buy” that could bring market right to K-resistance area and WPP. This could be very nice area for taking short position.
Conclusion:
Since gold market stands in strong geopolitical and fundamental storm – price is flirting with very significant crucial level of YPP that potentially could lead to appearing of drastical moments. Thus, while situation on long-term charts needs to be more clarified, we will focus on lower time frames.
Our medium-term trading plan suggests taking long position and first area where we could get the chance to do it stands around 1300. Our reason for this is potential B&B “Buy” on weekly chart.
Meantime, as we have permission to trade on daily charts as well, we will try to take short position on daily that should lead us right to 1300. If market will show retracement on Monday-Tuesday and will reach 1350 area – we could get chance to take it…
The technical portion of Sive's analysis owes a great deal to Joe DiNapoli's methods, and uses a number of Joe's proprietary indicators. Please note that Sive's analysis is his own view of the market and is not endorsed by Joe DiNapoli or any related companies.
According to Reuters news, Gold rose on Friday on bargain hunting, though the market posted its biggest weekly drop since November following the Federal Reserve's latest indication that an interest rate hike could come in early 2015. Palladium rose about 3 percent to its highest level since August 2011, outperforming other precious metals as a miners' strike in South Africa continued and concerns grew that the standoff between major producer Russia and the West over Ukraine could escalate. Gold's gains on Friday, however, were limited as the market was still reeling from a two-percent drop on Wednesday, when Fed Chair Janet Yellen said the central bank will probably end its massive bond-buying program this fall, and could start raising interest rates around six months later. "If the Fed is going to raise rates quicker than people had expected, that's definitely bearish for gold," said Bill O'Neill, partner of commodities investment firm LOGIC Advisors.
On Monday, bullion briefly touched a six-month high of $1,391.76 on tensions in Ukraine and concerns about growth in China before the focus shifted towards the U.S. monetary stance. For the week, gold fell nearly 3.5 percent. "Once again the market has proven it cannot maintain strength based on political tensions," O'Neill said.
GOLDEN CROSS
A "golden cross" on the spot bullion chart following a three-month rally suggests prices could climb further this year even after the Federal Reserve is set to keep trimming its bond-buying stimulus, analysts said. Reuters data showed spot gold's 50-day moving average on late Wednesday broke above its 200-day moving average, a highly bullish formation known as a golden cross, just as comments from Federal Reserve Chair Janet Yellen suggested U.S. interest rates could rise sooner than expected. "The golden cross is a confirmation of what we have been seeing all year - gold has been one of the best performing assets," said Adam Sarhan, chief executive of New York-based Sarhan Capital. "Typically the golden cross indicates a bullish intermediate to longer-term outlook in the next six to nine months. In the short term, gold is over-extended and due for a pullback," he said. Technical traders and momentum investors pay close attention to the golden cross because of its strong bullish indication. "While gold may be at risk of further losses, given the prospects for tighter monetary policy, should follow-through selling materialize, technical traders may view current price levels as an attractive entry point for bullion," said James Steel, analyst at HSBC, referring to the golden cross.
Another bullish chart pattern - the double bottom which has two troughs at about the same level near a three-year low of $1,180, also particularly appeals to chartists because it reflects investors' psychology by pinpointing the critical level where heavy selling has exhausted twice – that’s what we also discuss every time on monthly chart…
Monthly
Although on previous week we’ve noted that price has moved above YPP and shifted trend to bullish, but also we said that this could shift to bearish stop grabber and that it is too early to be fascinating with bullish break. Now we have the picture how it could look like by the end of the month. At the same time let’s not to give dramatic turn to this event. All that I would like to point is that nothing is done yet here. Of cause turning down from YPP can’t treated as positive sign, but this is normal – respect and react on reaching solid resistance. Besides, market has not shown too extended downward action, so it is too early to fall in histeric on possible downward reversal.
Yes, this could be bearish grabber, but it could fail as well, right? Taking into consideration all issues that we have now on gold market – I would not rush with reversal conclusions and treat current move down as retracement by far. Another interesting moment here is that market has not reached neckline of potential Double Bottom pattern and has not reached AB=CD upward target around 1430. The question what will it be – another gold’s trick and pitfall? When traders will take shorts - will market make another leg up to neckline before following retracement? If not, then market should not show too deep retracement right now. If gold is really bullish, and it stands above 0.618 target already – there is no reasons for too extended retracement to downside.
Long term upside target stands around yearly PR1. We know that gold likes to re-test previously broken lows and consolidations. 1540 area is monthly overbought, YPR1 and low border of broken long-term rectangle. As market was strongly oversold, very often it has tendency to reach overbought. Market is a impulse substance and reaction equals to counter reacion.
So our long-term analysis is the same. As another application of significantly oversold we’ve suggested retracement up. Thus, we’ve made an assumption of possible deeper upward retracement that could take a shape of AB=CD, and invalidation for this setup is previous lows around 1170s. Market right now is forming something like double bottom.
That’s being said – nearest target here is 1430 resistance level, while taking in consideration golds’ habits, geopolitical tension and technical issues, now we treat probability of reaching 1540 level as very high. In nearest future we have to keep close eye on current retracement down.
Weekly
Trend is bullish here, market is not at overbought. Here you can clearer see that market stands between 1.0 and 0.618 AB=CD targets. In such situations price should not show too deep move down, if gold is really bullish. Now price has formed huge bearish engulfing pattern and it could become reason for DiNapoli directional pattern here. We’ve said the same on previous week – nice thrust up, if any retracement will happen we could get DiNapoli “B&B” buy setup. That’s the pattern that we will be watching for in nearest 1-2 weeks here. At the same time this expectation absolutely does not forbid us to trade market short on lower time frames and based on engulfing pattern.
Daily
Here I’ve drawn many lines… I just want to show you “golden cross” that we’ve mentioned in fundamental part of research – crossing of 50-day and 200-day MA. Blue line is oversold one, this is not MA… So, we have initial solid plunge down and market has reached first 1330 Fib support. As market has not tested MPP yet, we assess the chance of reaching it as significant. And, in general 1300 area is very strong support – oversold, K-support and MPP. So, probably this will be our short-term target of possible retracement down and… - primary area where we will watch for bullish reversal patterns to step into B&B “Buy” on weekly chart, right?
Now we should monitor possible upward bounce for taking short position. Also, guys, retracement even to MPS1 at 1260 area will be acceptable and will not break bullish trend, since we know – until market stands above MPS1 – long term bullish trend is valid. Usually PS1 has to hold retracement within bullish trend and it works like some type of indicator of trend’s validation. But the moment of truth will happen earlier probably. If market is really bullish, then it should use weekly B&B to re-establish upward action…
4-hour
Here trend has turned bullish. We didn’t get B&B “Sell” as we’ve discussed on previous week, but chances on DiNapoli directional pattern still exist. Thus, this could be DRPO “Buy” that could bring market right to K-resistance area and WPP. This could be very nice area for taking short position.
Conclusion:
Since gold market stands in strong geopolitical and fundamental storm – price is flirting with very significant crucial level of YPP that potentially could lead to appearing of drastical moments. Thus, while situation on long-term charts needs to be more clarified, we will focus on lower time frames.
Our medium-term trading plan suggests taking long position and first area where we could get the chance to do it stands around 1300. Our reason for this is potential B&B “Buy” on weekly chart.
Meantime, as we have permission to trade on daily charts as well, we will try to take short position on daily that should lead us right to 1300. If market will show retracement on Monday-Tuesday and will reach 1350 area – we could get chance to take it…
The technical portion of Sive's analysis owes a great deal to Joe DiNapoli's methods, and uses a number of Joe's proprietary indicators. Please note that Sive's analysis is his own view of the market and is not endorsed by Joe DiNapoli or any related companies.
")