Sive Morten
Special Consultant to the FPA
- Messages
- 18,699
Fundamentals
Weekly Gold Tading Report prepared by Sive Morten exclusively for ForexPeaceArmy.com
Gold fell on Friday, snapping a seven-day rally as investors remained cautious ahead of comments from U.S. Federal Reserve Chair Janet Yellen, but the metal still looked set to post its second straight weekly gain.
Despite Friday's losses, gold was on track to finish the week up around 1.5 percent after its longest winning stretch since August 2012.
Yellen will speak in San Francisco on monetary policy in a speech scheduled for 1945 GMT and traders will be listening for clues on when the Fed may begin tightening monetary policy.
"Yellen ... has been accused of being too dovish and maybe she wants to react to that by making her speech sound a little bit less dovish," Saxo Bank senior manager Ole Hansen said.
Saudi Arabia and its allies launched air strikes in Yemen this week, rattling wider markets and supporting gold, usually seen as an insurance against risk. But even oil prices turned lower as fears eased about any disruption of Middle East crude shipments due to the Yemen conflict.
"Geopolitics has never been something that could set a trend in gold prices, it only causes a short-term deviation from the existing trend," Julius Baer head of commodity research Norbert Ruecker said.
Gold had gained strength after the Fed sounded cautious at its policy meeting last week about the pace of any interest rate increase, prompting the dollar to fall from multi-year highs.
Investor caution over the price rally was evident as SPDR Gold Trust, the world's largest gold-backed exchange-traded fund, continued to post outflows. Holdings fell nearly 6 tonnes on Thursday to 737.24 tonnes, the lowest level since January.
Palladium lost 3 percent to a 5-1/2-month low of $736.80 an ounce.
Mike Dragosits of TD Securities in Toronto said in a note that vehicle sales in China are expected to increase. The bank forecast palladium prices at $800 an ounce in the second quarter.
"Since each new vehicle sold in China is a major demand driver for palladium, in the catalytic converter, we would suggest that the downturn in prices for the metal is near a bottom," he wrote.
Recent CFTC data shows solid growth in speculative short positions, while long positions stand flat after drop. This confirms bearish sentiment and tells that current upside rally mostly technical and has no support from institutional investors. It seems that we should use it for short entry.
The same tells SPDR fund report. It shows outflows for 2nd week in a row. Storages have dropped from 750 tonnes to 744 two weeks before and now they have decreased to 737 tonnes –for another 7 tonnes, although gold was in upside action last week.
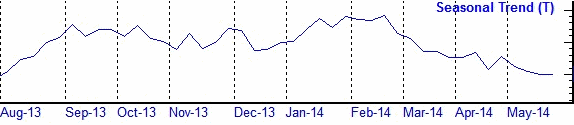
Again we remind that gold is entering into bearish seasonal trend. All these moments obviously do not support bullish reversal on gold. So sentiment statistics mostly confirms bearish sentiment and makes us treat recent upside action only as retracement. Thus, in long-term perspective we should use it for short entry.
Here is detailed breakdown of speculative positions:
Open interest:
 Shorts:
 Longs:
 Summary:
Technicals
Monthly
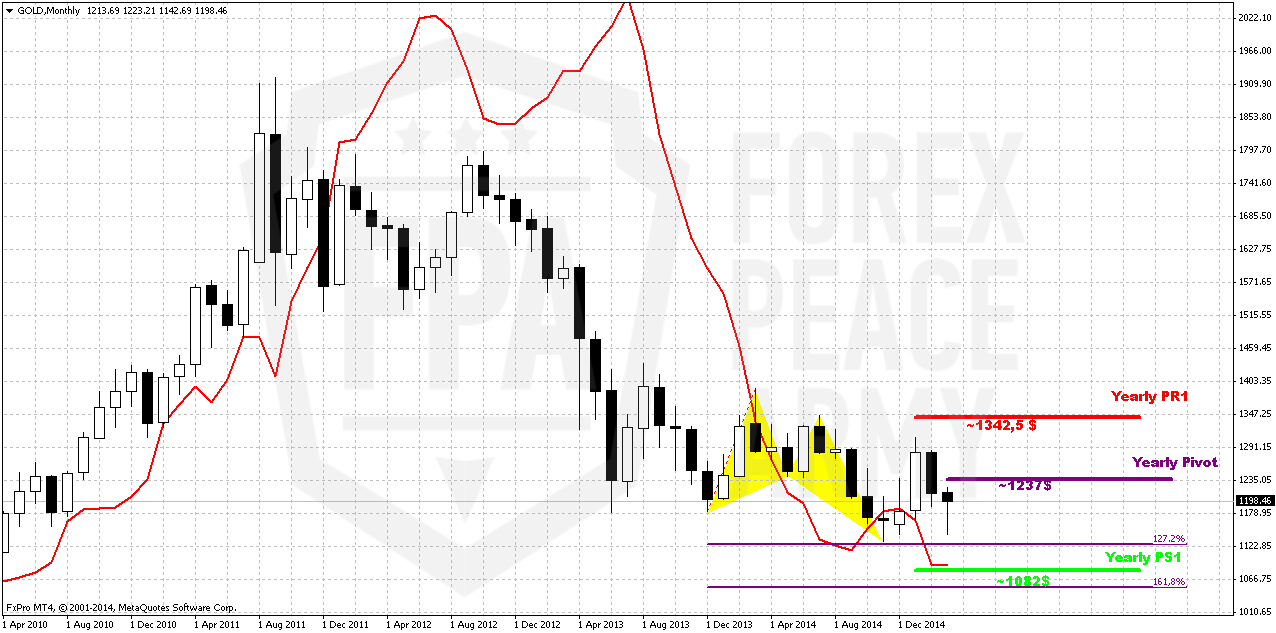
There is really shy difference in close price from previous week. So, drop on recent couple of weeks looks significant. Here we still have last big pattern in progress that is Volatility breakout (VOB). It suggests at least 0.618 AB-CD down. And this target is 1050$. At the same time we need 1130 breakout to start clearly speak on 1050 target.
In the beginning of the year market showed solid upside action. Gold was able to exceed yearly pivot, passed half way to Yearly Pivot resistance 1 but right now has reversed down and closed below YPP. From technical point of view this is bearish sign. This could be very significant moment and next logical destination will be yearly pivot support 1 around 1083$.
Recent US economy data mostly shows solid growth, but labor cost not as stably good as unemployment. Many investors concern about anemic wage growth, although in recent time this indicator shows improving. So, it seems that gold will remain hostage of dollar value and US economical data (mostly inflation) in nearest perspective. Approximately the same was announced by Fed in forecast on inflation and had become a reason of dovish approach to rate hiking. Another concern right now is too strong dollar that becomes a problem per se for economy growth. Yesterday we’ve talked about this in our FX weekly research and if you want some details, please read it directly.
Still, if we will take into consideration geopolitical situation and risks that have appeared recently, it could happen that situation will change, especially if situation in Ukraine will escalate and peaceful regulation will fail. Day by day we see worrying geopolitical news.
That’s being said, economical data supports further gold decreasing but geopolicy could bring significant adjustment. Unfortunately the geopolicy is sphere where we can’t do much. As gold has passed through 1200, our next destination point is previous lows at 1130, but since gold is returning to them again – this is temporal destination and we should prepare for further downward action. Besides, right now we can clear recognized bearish dynamic pressure on monthly chart. Take a look, although trend has turned bullish, but market was unable to show more or less meaningful upside action. Right now we see the tendency of lower highs creation and this significantly increases chances on downward breakout.
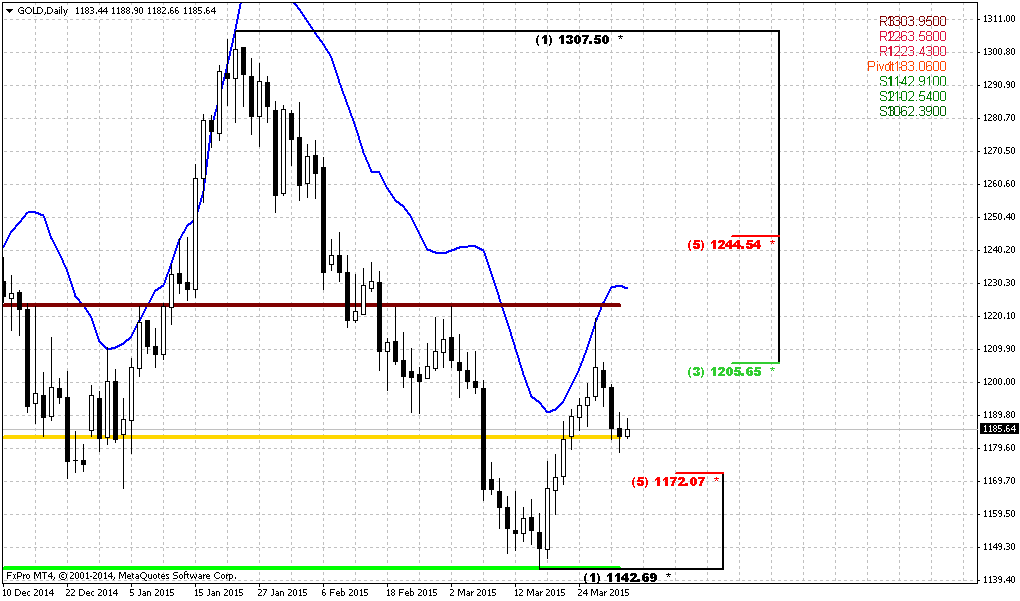
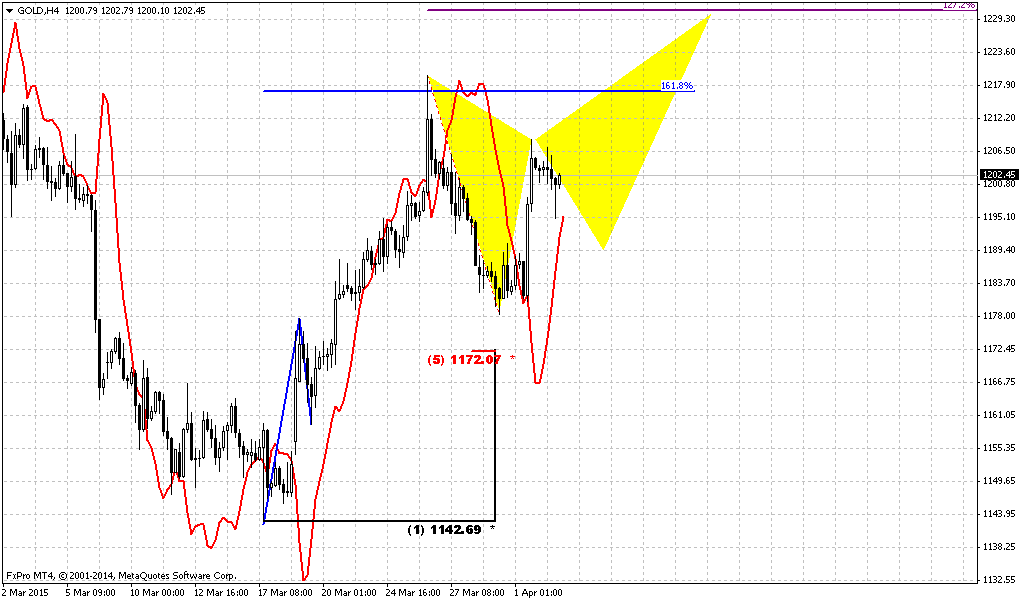
Weekly
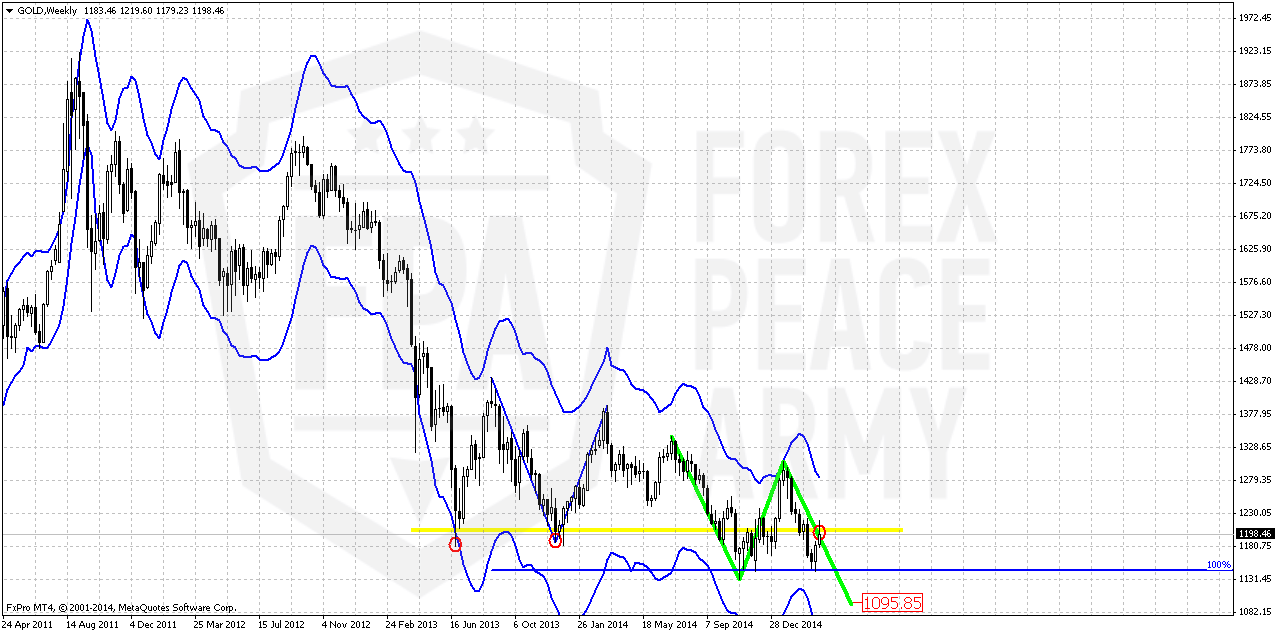
Trend has turned bearish. So gold was not able to hold above 1200 strong support and moved below not just Fib level, but also MPS1. This tells that previous upside trend has failed. If you will take a look at weekly chart closely you will find a lot of different targets – AB-CD’s, couple of butterflies etc. By the way, most recent action also could turn to butterfly…
But right now it makes sense probably to focus on most close target that is based on most recent AB-CD pattern. 1130 level is very close and it makes sense to take a look a bit lower. This AB-CD points on 1095-1100 destination point. Current picture points on solid chances of downward continuation, because CD leg is faster than AB. Right now market stands at resistance that includes some daily Fib level and as you can see – weekly previously broken lows. As market has no real support from big investors as CFTC and SPDR shows – chances on downward reversal looks significant.
All other targets stand significantly lower – 1080, 1050 and even 990$.
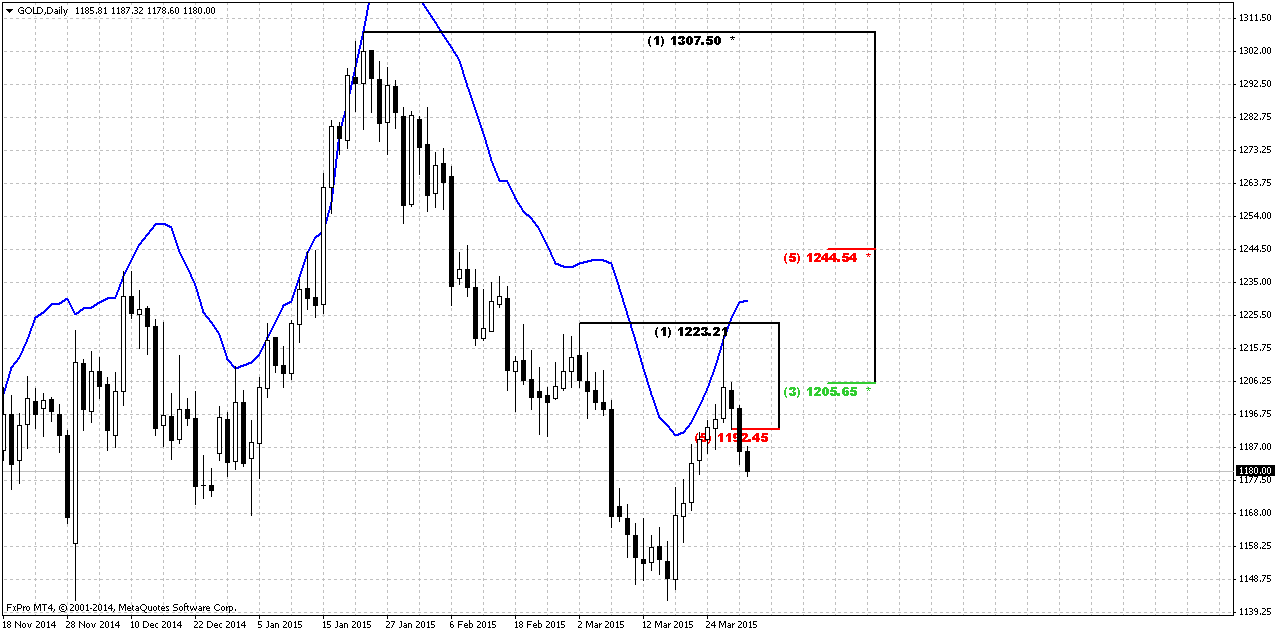
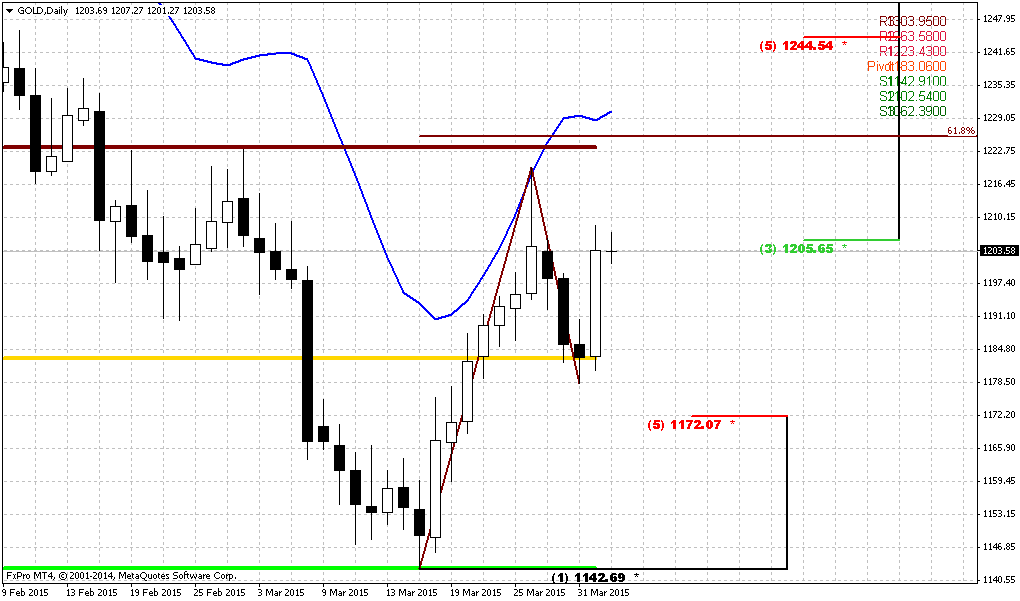
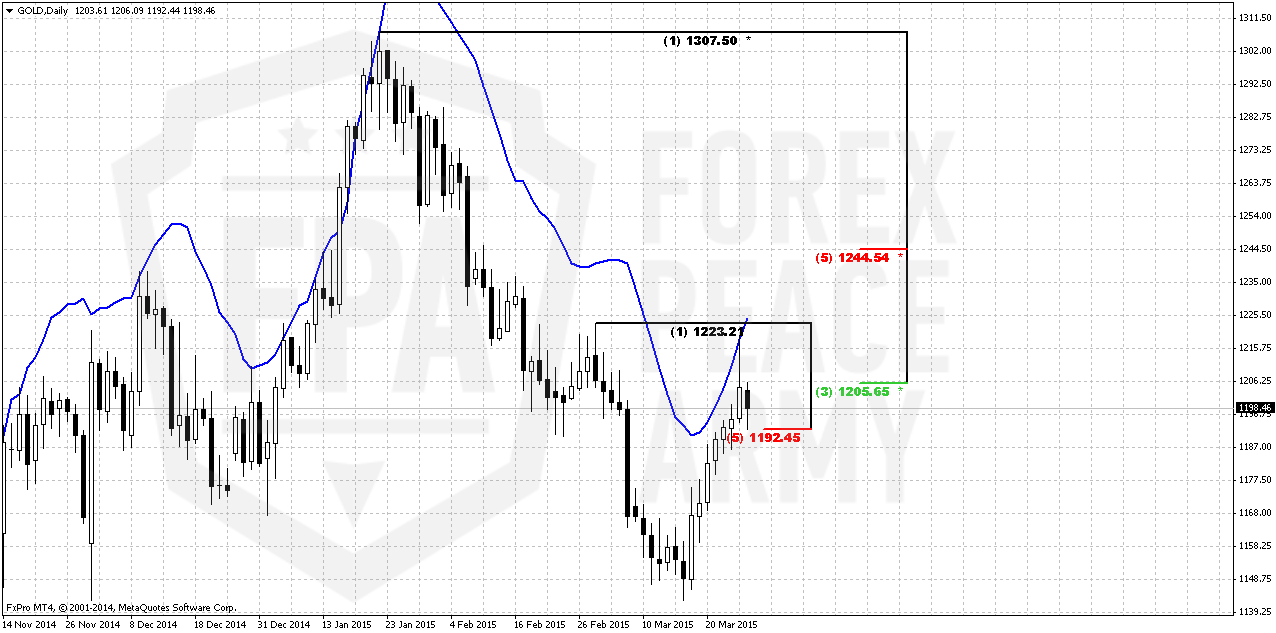
Daily
So guys, major question here – is it time to take short position or retracement could be higher? Based on sentiment data from CFTC, SPDR fund we could think that upward action should not be too deep and should finish somewhere around. At the same time market easily has passed through K-resistance area and only stopped due overbought. Unfortunately on daily chart we do not have any clear patterns yet that could let us make conclusion. We even do not have sufficient thrust for DiNapoli DRPO or “B&B” patterns.
It means that the only way how we could get the answer is to watch how market will react on intraday strong supports and how it will move to them. Gradual, choppy, slow action and standing above major support levels will increase chance on upside continuation. While thrusting plunge could be the sign of reversal down again. Any patterns also could give us assistance.
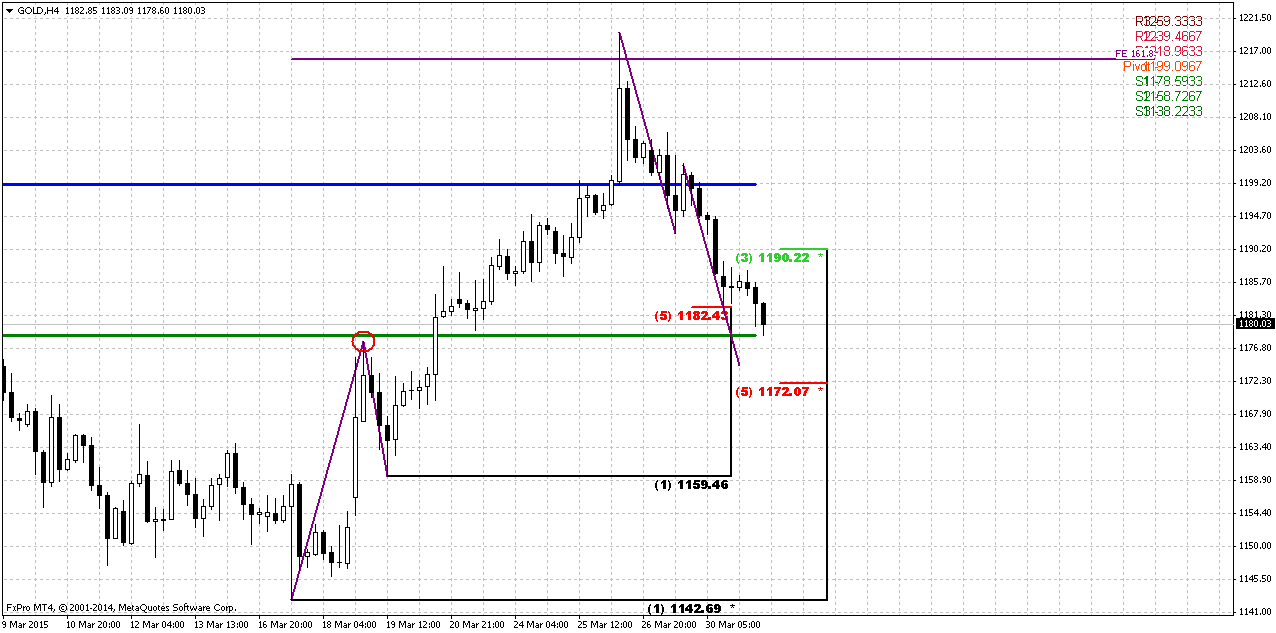
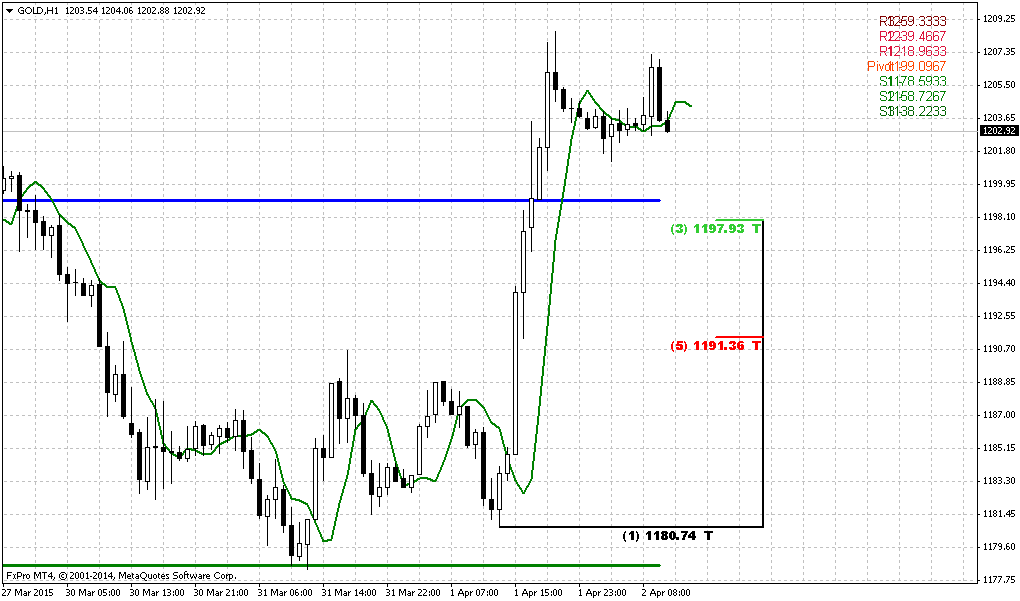
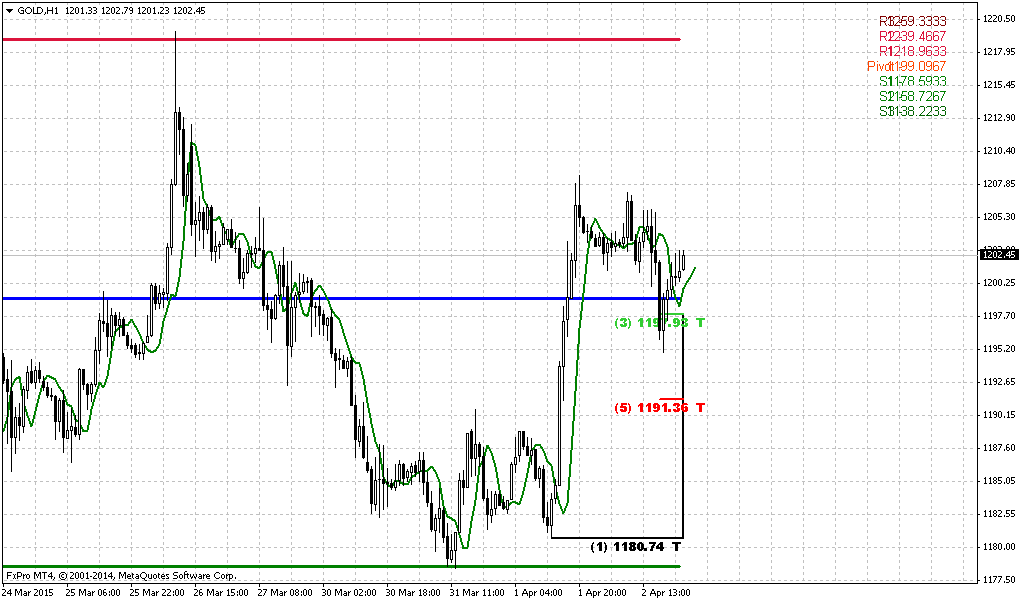
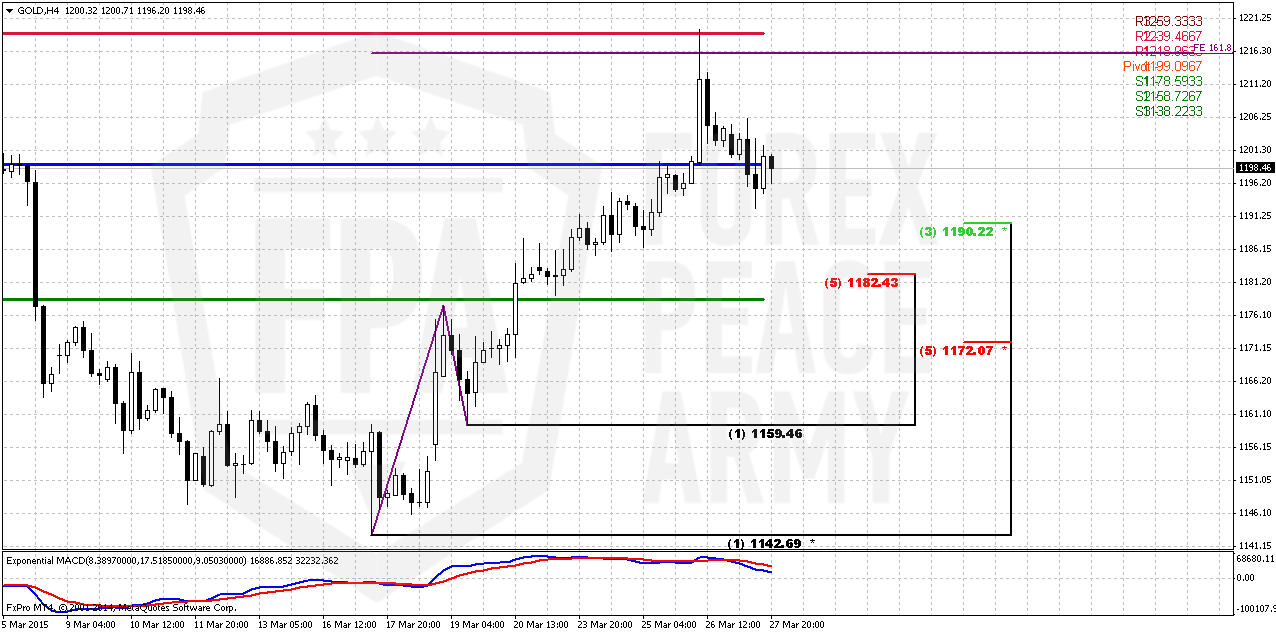
4-hour
So, trend has turned bearish here. If you remember we stand here with short-term bearish “Kibby Trade” – combination of overbought and AB-CD 1.618 extension resistance. Still, downward action, as you can see, a bit slow and does not have sign of thrust. It’s gradual. It means that this is probably retracement yet. Major level that we will watch on coming week is 1182-1190 cluster. This is K-support area and it stands very close to WPS1 as well. This should be enough to check whether downward action a reversal or retracement. If market has power and intension to continue move higher it should not pass through this area.
Conclusion:
Recent market data and opinion of investors tells about speculative character of recent rally. This action does not confirm by any real inflow. It means that upward action is very fragile and could turn down at any moment. Our major task here is to catch this moment.
From technical point of view we have no reasons yet to abandon possible long-term downward AB-CD as VoB (Volatility breakout) development. Fundamental background is not very supportive for gold right now and one cluster of events that could bring unexpected bullish surprise is geopolitical tensions.
In short-term perspective market stands in upside retracement. The first part of it has been completed recently, while whether we will get second part depends now on how market will behave around key 1182-1190 level. Right now we do not see signs that reversal already has happened. Downward action looks gradual and does not exclude second leg of upside retracement by far.
The technical portion of Sive's analysis owes a great deal to Joe DiNapoli's methods, and uses a number of Joe's proprietary indicators. Please note that Sive's analysis is his own view of the market and is not endorsed by Joe DiNapoli or any related companies.
Weekly Gold Tading Report prepared by Sive Morten exclusively for ForexPeaceArmy.com
Gold fell on Friday, snapping a seven-day rally as investors remained cautious ahead of comments from U.S. Federal Reserve Chair Janet Yellen, but the metal still looked set to post its second straight weekly gain.
Despite Friday's losses, gold was on track to finish the week up around 1.5 percent after its longest winning stretch since August 2012.
Yellen will speak in San Francisco on monetary policy in a speech scheduled for 1945 GMT and traders will be listening for clues on when the Fed may begin tightening monetary policy.
"Yellen ... has been accused of being too dovish and maybe she wants to react to that by making her speech sound a little bit less dovish," Saxo Bank senior manager Ole Hansen said.
Saudi Arabia and its allies launched air strikes in Yemen this week, rattling wider markets and supporting gold, usually seen as an insurance against risk. But even oil prices turned lower as fears eased about any disruption of Middle East crude shipments due to the Yemen conflict.
"Geopolitics has never been something that could set a trend in gold prices, it only causes a short-term deviation from the existing trend," Julius Baer head of commodity research Norbert Ruecker said.
Gold had gained strength after the Fed sounded cautious at its policy meeting last week about the pace of any interest rate increase, prompting the dollar to fall from multi-year highs.
Investor caution over the price rally was evident as SPDR Gold Trust, the world's largest gold-backed exchange-traded fund, continued to post outflows. Holdings fell nearly 6 tonnes on Thursday to 737.24 tonnes, the lowest level since January.
Palladium lost 3 percent to a 5-1/2-month low of $736.80 an ounce.
Mike Dragosits of TD Securities in Toronto said in a note that vehicle sales in China are expected to increase. The bank forecast palladium prices at $800 an ounce in the second quarter.
"Since each new vehicle sold in China is a major demand driver for palladium, in the catalytic converter, we would suggest that the downturn in prices for the metal is near a bottom," he wrote.
Recent CFTC data shows solid growth in speculative short positions, while long positions stand flat after drop. This confirms bearish sentiment and tells that current upside rally mostly technical and has no support from institutional investors. It seems that we should use it for short entry.
The same tells SPDR fund report. It shows outflows for 2nd week in a row. Storages have dropped from 750 tonnes to 744 two weeks before and now they have decreased to 737 tonnes –for another 7 tonnes, although gold was in upside action last week.
Again we remind that gold is entering into bearish seasonal trend. All these moments obviously do not support bullish reversal on gold. So sentiment statistics mostly confirms bearish sentiment and makes us treat recent upside action only as retracement. Thus, in long-term perspective we should use it for short entry.
Here is detailed breakdown of speculative positions:
Open interest:
Technicals
Monthly
There is really shy difference in close price from previous week. So, drop on recent couple of weeks looks significant. Here we still have last big pattern in progress that is Volatility breakout (VOB). It suggests at least 0.618 AB-CD down. And this target is 1050$. At the same time we need 1130 breakout to start clearly speak on 1050 target.
In the beginning of the year market showed solid upside action. Gold was able to exceed yearly pivot, passed half way to Yearly Pivot resistance 1 but right now has reversed down and closed below YPP. From technical point of view this is bearish sign. This could be very significant moment and next logical destination will be yearly pivot support 1 around 1083$.
Recent US economy data mostly shows solid growth, but labor cost not as stably good as unemployment. Many investors concern about anemic wage growth, although in recent time this indicator shows improving. So, it seems that gold will remain hostage of dollar value and US economical data (mostly inflation) in nearest perspective. Approximately the same was announced by Fed in forecast on inflation and had become a reason of dovish approach to rate hiking. Another concern right now is too strong dollar that becomes a problem per se for economy growth. Yesterday we’ve talked about this in our FX weekly research and if you want some details, please read it directly.
Still, if we will take into consideration geopolitical situation and risks that have appeared recently, it could happen that situation will change, especially if situation in Ukraine will escalate and peaceful regulation will fail. Day by day we see worrying geopolitical news.
That’s being said, economical data supports further gold decreasing but geopolicy could bring significant adjustment. Unfortunately the geopolicy is sphere where we can’t do much. As gold has passed through 1200, our next destination point is previous lows at 1130, but since gold is returning to them again – this is temporal destination and we should prepare for further downward action. Besides, right now we can clear recognized bearish dynamic pressure on monthly chart. Take a look, although trend has turned bullish, but market was unable to show more or less meaningful upside action. Right now we see the tendency of lower highs creation and this significantly increases chances on downward breakout.
Weekly
Trend has turned bearish. So gold was not able to hold above 1200 strong support and moved below not just Fib level, but also MPS1. This tells that previous upside trend has failed. If you will take a look at weekly chart closely you will find a lot of different targets – AB-CD’s, couple of butterflies etc. By the way, most recent action also could turn to butterfly…
But right now it makes sense probably to focus on most close target that is based on most recent AB-CD pattern. 1130 level is very close and it makes sense to take a look a bit lower. This AB-CD points on 1095-1100 destination point. Current picture points on solid chances of downward continuation, because CD leg is faster than AB. Right now market stands at resistance that includes some daily Fib level and as you can see – weekly previously broken lows. As market has no real support from big investors as CFTC and SPDR shows – chances on downward reversal looks significant.
All other targets stand significantly lower – 1080, 1050 and even 990$.
Daily
So guys, major question here – is it time to take short position or retracement could be higher? Based on sentiment data from CFTC, SPDR fund we could think that upward action should not be too deep and should finish somewhere around. At the same time market easily has passed through K-resistance area and only stopped due overbought. Unfortunately on daily chart we do not have any clear patterns yet that could let us make conclusion. We even do not have sufficient thrust for DiNapoli DRPO or “B&B” patterns.
It means that the only way how we could get the answer is to watch how market will react on intraday strong supports and how it will move to them. Gradual, choppy, slow action and standing above major support levels will increase chance on upside continuation. While thrusting plunge could be the sign of reversal down again. Any patterns also could give us assistance.
4-hour
So, trend has turned bearish here. If you remember we stand here with short-term bearish “Kibby Trade” – combination of overbought and AB-CD 1.618 extension resistance. Still, downward action, as you can see, a bit slow and does not have sign of thrust. It’s gradual. It means that this is probably retracement yet. Major level that we will watch on coming week is 1182-1190 cluster. This is K-support area and it stands very close to WPS1 as well. This should be enough to check whether downward action a reversal or retracement. If market has power and intension to continue move higher it should not pass through this area.
Conclusion:
Recent market data and opinion of investors tells about speculative character of recent rally. This action does not confirm by any real inflow. It means that upward action is very fragile and could turn down at any moment. Our major task here is to catch this moment.
From technical point of view we have no reasons yet to abandon possible long-term downward AB-CD as VoB (Volatility breakout) development. Fundamental background is not very supportive for gold right now and one cluster of events that could bring unexpected bullish surprise is geopolitical tensions.
In short-term perspective market stands in upside retracement. The first part of it has been completed recently, while whether we will get second part depends now on how market will behave around key 1182-1190 level. Right now we do not see signs that reversal already has happened. Downward action looks gradual and does not exclude second leg of upside retracement by far.
The technical portion of Sive's analysis owes a great deal to Joe DiNapoli's methods, and uses a number of Joe's proprietary indicators. Please note that Sive's analysis is his own view of the market and is not endorsed by Joe DiNapoli or any related companies.